. 2015 Sep 2;15(9):22234-48.
doi: 10.3390/s150922234.

Multi-Wavelength Based Optical Density Sensor for Autonomous Monitoring of Microalgae

Affiliations

Multi-Wavelength Based Optical Density Sensor for Autonomous Monitoring of Microalgae

Fei Jia et al. Sensors (Basel). .

Abstract

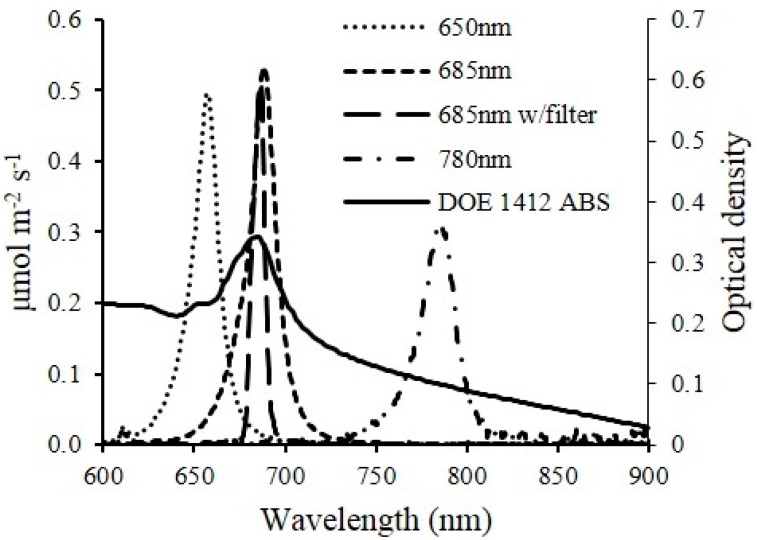
A multi-wavelength based optical density sensor unit was designed, developed, and evaluated to monitor microalgae growth in real time. The system consisted of five main components including: (1) laser diode modules as light sources; (2) photodiodes as detectors; (3) driver circuit; (4) flow cell; and (5) sensor housing temperature controller. The sensor unit was designed to be integrated into any microalgae culture system for both real time and non-real time optical density measurements and algae growth monitoring applications. It was shown that the sensor unit was capable of monitoring the dynamics and physiological changes of the microalgae culture in real-time. Algae biomass concentration was accurately estimated with optical density measurements at 650, 685 and 780 nm wavelengths used by the sensor unit. The sensor unit was able to monitor cell concentration as high as 1.05 g·L(-1) (1.51 × 10⁸ cells·mL(-1)) during the culture growth without any sample preparation for the measurements. Since high cell concentrations do not need to be diluted using the sensor unit, the system has the potential to be used in industrial microalgae cultivation systems for real time monitoring and control applications that can lead to improved resource use efficiency.

Keywords: microalgae; multi-wavelength; optical density; real-time monitoring and control.


Figures

Figure 1
Figure 1
Component layout of the optical sensor unit. Three laser diodes at wavelengths of 650 nm, 685 nm and 780 nm were aligned with 3 photodiodes with a detection range of 350–1100 nm. The flow chamber window was perpendicular to the laser beam.
Figure 2
Figure 2
Multi wavelength optical sensor integrated into air-lift flat panel photobioreactors for real-time microalgae growth monitoring.
Figure 3
Figure 3
Optical sensor integrated into an open pond raceway for real-time microalgae growth monitoring.
Figure 4
Figure 4
(a) Correlation between the optical densities of DOE 1412 in the PBR measured by a bench-top spectrophotometer (BT) and by the inline optical sensors (IOS). OD650 (BT) = 1.82 × OD650 (IOS) + 0.056 (AFDW < 0.592 g·L−1), OD685 (BT) = 1.70 × OD685 (IOS) + 0.11 (AFDW < 0.592 g·L−1), OD650 (BT) = 3.54 × OD650 (IOS) − 2.51 (0.592 g·L−1 < AFDW < 1.05 g·L−1), OD685 (BT) = 3.72 × OD685 (IOS) − 3.88 (0.592 g·L−1 < AFDW < 1.05 g·L−1), OD780 (BT) = 3.71 × OD780 (IOS) − 0.2445 (AFDW < 1.05 g·L−1). (b) Correlation between optical density (IOS) and AFDW, AFDW = 0.96 × OD780 (IOS) − 0.12 (R2 = 0.99); AFDW = 0.40 × OD650 (IOS) + 0.032 (R2 = 0.98); AFDW = 0.30 × OD685 (IOS) + 0.061 (R2 = 0.96).
Figure 5
Figure 5
Light absorbance spectrum of DOE 1412 and light spectra of laser diodes used on the optical sensor.
Figure 6
Figure 6
(a) Dynamics of optical density at 650 nm, 685 nm and 780 nm during semi-continuous culture of DOE 1412 run for 10 days. Illumination intensity was increased from 200 µmol·m−2·s−1 to 400 µmol·m−2·s−1 during the first batch on 3/2, it was then reduced to 200 µmol·m−2·s−1 by the end of the batch; (b) Growth rate of DOE 1412 at 650, 685 and 780 nm and (c) ratios of optical densities at 650/780 nm and 685/780 nm.
Figure 7
Figure 7
Optical density change of S. obliquus in open pond raceway over 18 days. Black arrows indicate events of water addition, precipitation and biomass harvesting.
Figure 8
Figure 8
(a) Photosynthetic active radiation (PAR) of a sunny day in Tucson, AZ, USA; (b) Growth rate (µ) of S. obliquus in open pond raceway of the same day; (c) Scattered plot of PAR and µ from the data presented in (a,b).

References

    1. Harun R., Singh M., Forde G.M., Danquah M.K. Bioprocess engineering of microalgae to produce a variety of consumer products. Renew. Sust. Energ. Rev. 2010;14:1037–1047. doi: 10.1016/j.rser.2009.11.004. - DOI
    1. Perez-Garcia O., Escalante F.M.E., de-Bashan L.E., Bashan Y. Heterotrophic cultures of microalgae: Metabolism and potential products. Water Res. 2011;45:11–36. doi: 10.1016/j.watres.2010.08.037. - DOI - PubMed
    1. Wiltshire K., Boersma M., Möller A., Buhtz H. Extraction of pigments and fatty acids from the green alga scenedesmus obliquus (chlorophyceae) Aquat. Ecol. 2000;34:119–126. doi: 10.1023/A:1009911418606. - DOI
    1. Barclay W.R., Meager K.M., Abril J.R. Heterotrophic production of long chain omega-3 fatty acids utilizing algae and algae-like microorganisms. J. Appl. Phycol. 1994;6:123–129. doi: 10.1007/BF02186066. - DOI
    1. Chisti Y. Biodiesel from microalgae. Biotechnol. Adv. 2007;25:294–306. doi: 10.1016/j.biotechadv.2007.02.001. - DOI - PubMed

Publication types