. 2015 Sep 14:6:8236.
doi: 10.1038/ncomms9236.

Cross-polarized photon-pair generation and bi-chromatically pumped optical parametric oscillation on a chip

Affiliations

Cross-polarized photon-pair generation and bi-chromatically pumped optical parametric oscillation on a chip

Christian Reimer et al. Nat Commun. .

Abstract

Nonlinear optical processes are one of the most important tools in modern optics with a broad spectrum of applications in, for example, frequency conversion, spectroscopy, signal processing and quantum optics. For practical and ultimately widespread implementation, on-chip devices compatible with electronic integrated circuit technology offer great advantages in terms of low cost, small footprint, high performance and low energy consumption. While many on-chip key components have been realized, to date polarization has not been fully exploited as a degree of freedom for integrated nonlinear devices. In particular, frequency conversion based on orthogonally polarized beams has not yet been demonstrated on chip. Here we show frequency mixing between orthogonal polarization modes in a compact integrated microring resonator and demonstrate a bi-chromatically pumped optical parametric oscillator. Operating the device above and below threshold, we directly generate orthogonally polarized beams, as well as photon pairs, respectively, that can find applications, for example, in optical communication and quantum optics.


Figures

Figure 1
Figure 1. Microring resonator characteristics.
Transmission spectrum measured with a high resolution Optical Spectrum Analyser (OSA), showing two TE and two TM resonances, with a relative frequency offset of 70 GHz. A very small amplitude, higher order mode excitation is also visible. However, these modes do not play any role in the FWM process due to the requirement of energy conservation. The insets show the TE and TM resonances in a linear scale (black) with a Lorentzian fit (red dashed).
Figure 2
Figure 2. Schematic of the novel approach used to achieve Type-II spontaneous FWM on a chip.
Stimulated FWM (St-FWM, dotted lines) is suppressed by an offset between the TE and TM resonances (dashed vertical lines), as the St-FWM gain does not overlap with any of the microring resonances. Correspondingly, Type-II spontaneous FWM (Sp-FWM, continuous line) is allowed and enhanced by the resonator.
Figure 3
Figure 3. Experimental set-up of the hybrid self-locked and external pumping scheme.
The TE polarization is pumped in a self-locked scheme, while the TM pump field (a CW external fibre laser actively locked to the resonance) is added and extracted by two polarization beam splitters (PBSs) placed before and after the microring resonator. The amplified spontaneous emission of the amplifier is transmitted through the band-pass filter before the resonator, thus selecting the desired pump resonance. The output of the resonator is then fed back into the amplifier and acts as a seed to initiate lasing on the TE resonance. The photon pairs are extracted at the through port of the resonator and directed, after filtering out the pump fields, to detectors D1 and D2. The arrow on top of the amplifier represents the propagation direction of the light inside the cavity. The coloured spheres with arrows illustrate the frequency and polarization of the involved fields: red and blue are the TE and TM pumps, respectively, while yellow and green are the TE and TM daughter photons, respectively, generated through Type-II spontaneous FWM.
Figure 4
Figure 4. Photon pair source characterisation.
(a) Measured photon coincidence peak, showing the raw measured coincidences (C) in Hz. The black curve corresponds to the optimum fit resulting in a measured photon bandwidth of 320 MHz, while the red curve corresponds to the fit with the expected photon bandwidth of 410 MHz. (b) CAR (coincidence-to-accidental ratio) as a function of balanced pump power (the line connecting the points is just for visual purposes), showing a CAR >10 for balanced pump powers between 3 and 5 mW. (c) Measured photon coincidence counts (sum of all coincidence counts measured within the FWHM of the coincidence peak) for balanced and unbalanced pump powers. In the unbalanced configuration (blue circles), the TE pump power is kept constant at 6 mW and the TM pump power is increased, showing a linear scaling behaviour. In the balanced configuration (red squares), TE and TM pump powers are identically increased, showing a clear quadratic scaling behaviour without any linear contribution.
Figure 5
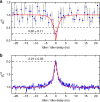
Figure 5. Heralded and idler–idler autocorrelation measurement.
(a) Measured heralded autocorrelation, showing a clear dip at zero delay below the limit for classical correlations (equal to 0.5), confirming the quantum nature and single-photon operation of the source. Ten bins were averaged for each point, displayed together with the statistical error (standard deviation of the 10 bin distribution). (b) Measured idler–idler autocorrelation, showing a clear peak with a maximum at 2.01±0.03, confirming the single-mode operation and high purity of the source.
Figure 6
Figure 6. Pair production rate at different resonances.
Measured pair production rate (blue circles) associated to the Type-II process at different resonator lines symmetrically located with respect to the pumps at 5 mW balanced pump power, showing good agreement with the approximated predicted curve (red line), see Methods for details.
Figure 7
Figure 7. Cross-polarized optical parametric oscillation.
Power scaling in a high-Q ring resonator with balanced pumps, initially showing a quadratic followed by a linear trend above OPO threshold at 14 mW. The inset presents the OPO spectrum measured with an optical spectrum analyser at 20 mW pump power.

References

    1. Franken P. A., Hill A. E., Peters C. W. & Weinreich G. Generation of optical harmonics. Phys. Rev. Lett. 7, 118–120 (1961).
    1. Mukamel S. Principles of Nonlinear Optical Spectroscopy Oxford Univ. Press (1999).
    1. Assanto G., Stegeman G. I., Sheik-Bahae M. & VanStryland E. Coherent interactions for all-optical signal processing via quadratic nonlinearities. IEEE J. Quant. Electron. 31, 673–681 (1995).
    1. Dodonov V. V. ‘Nonclassical' states in quantum optics: a ‘squeezed' review of the first 75 years. J. Opt. B Quantum Semiclassical Opt. 4, R1–R33 (2002).
    1. Agrawal G. P. Nonlinear Fiber Optics Academic Press (2001).

Publication types