. 2015 Oct 6;22(4):709-20.
doi: 10.1016/j.cmet.2015.08.006. Epub 2015 Sep 10.

Hepatic Bmal1 Regulates Rhythmic Mitochondrial Dynamics and Promotes Metabolic Fitness

Affiliations

Hepatic Bmal1 Regulates Rhythmic Mitochondrial Dynamics and Promotes Metabolic Fitness

David Jacobi et al. Cell Metab. .

Abstract

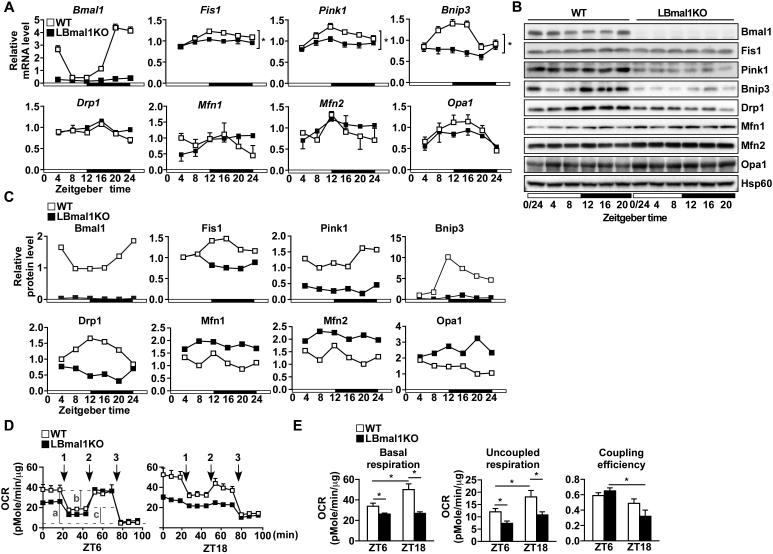
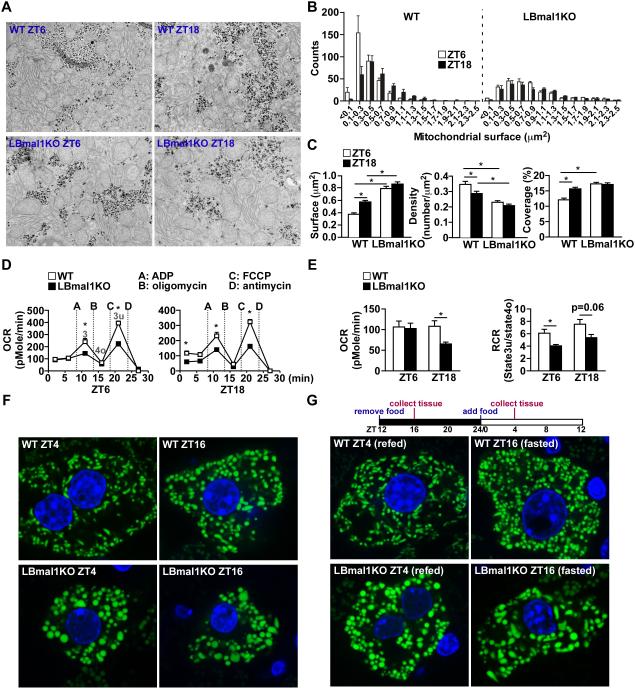
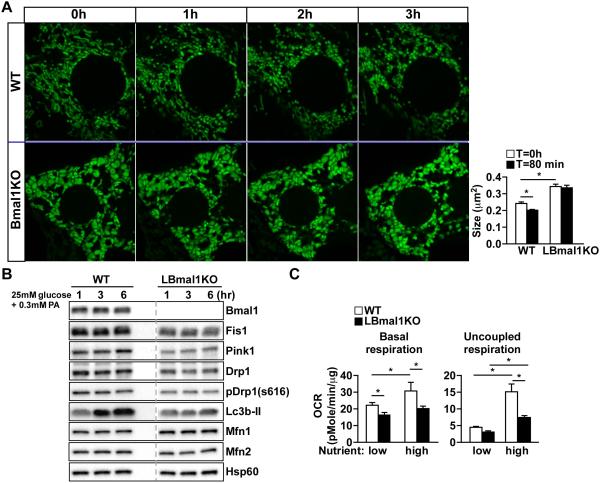
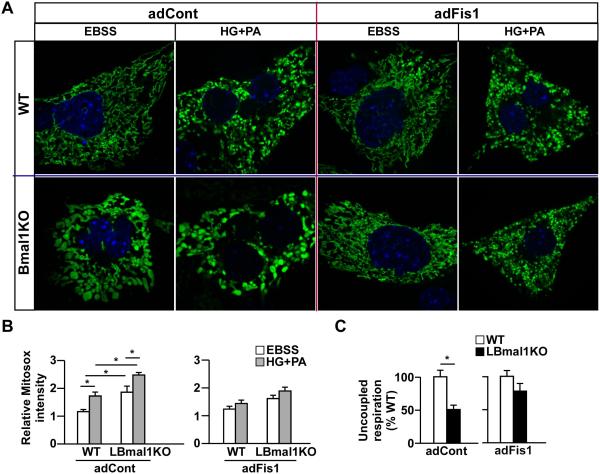
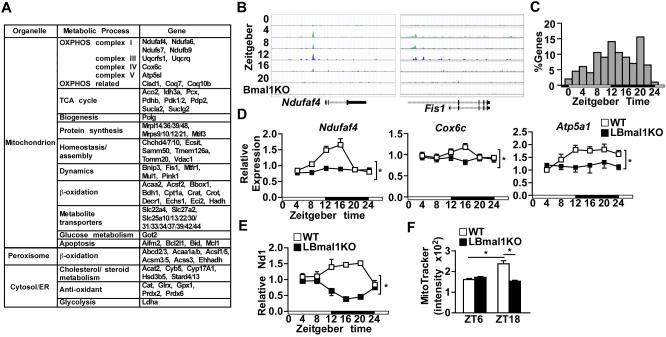
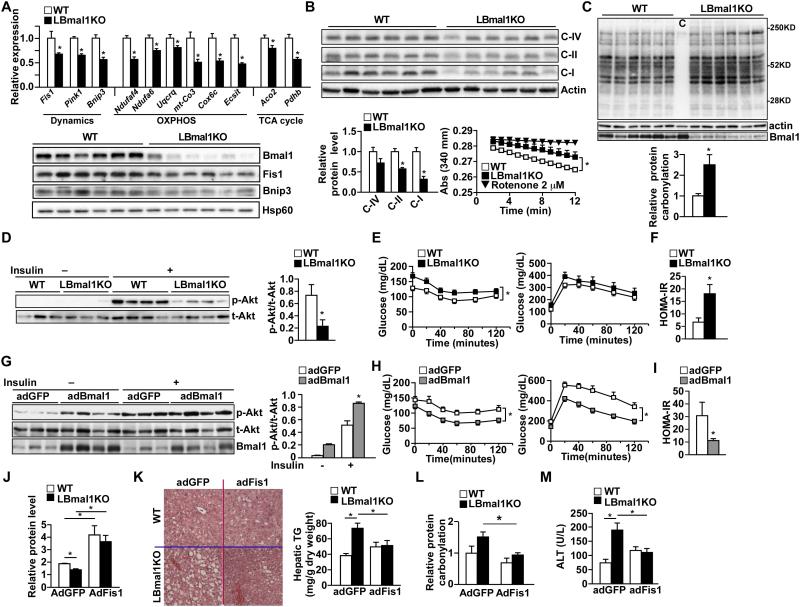
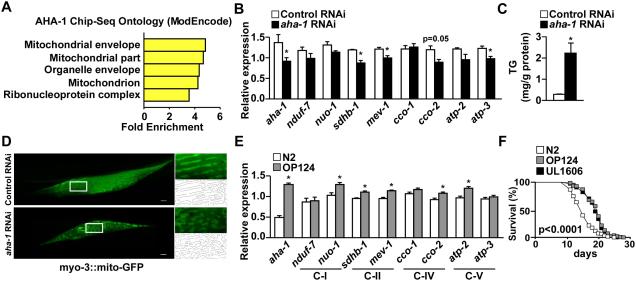
Mitochondria undergo architectural/functional changes in response to metabolic inputs. How this process is regulated in physiological feeding/fasting states remains unclear. Here we show that mitochondrial dynamics (notably fission and mitophagy) and biogenesis are transcriptional targets of the circadian regulator Bmal1 in mouse liver and exhibit a metabolic rhythm in sync with diurnal bioenergetic demands. Bmal1 loss-of-function causes swollen mitochondria incapable of adapting to different nutrient conditions accompanied by diminished respiration and elevated oxidative stress. Consequently, liver-specific Bmal1 knockout (LBmal1KO) mice accumulate oxidative damage and develop hepatic insulin resistance. Restoration of hepatic Bmal1 activities in high-fat-fed mice improves metabolic outcomes, whereas expression of Fis1, a fission protein that promotes quality control, rescues morphological/metabolic defects of LBmal1KO mitochondria. Interestingly, Bmal1 homolog AHA-1 in C. elegans retains the ability to modulate oxidative metabolism and lifespan despite lacking circadian regulation. These results suggest clock genes are evolutionarily conserved energetics regulators.


Figures

Figure 1
Figure 1. Rhythmic expression of mitochondrial dynamics genes in the liver is regulated by Bmal1
(A) Diurnal mRNA expression of genes involved in mitochondrial dynamics in WT and LBmal1KO livers determined by real-time PCR. (B) Western blot analyses of mitochondrial dynamics proteins throughout the day. Liver samples were collected every 4 hours for 24 hours. Pooled samples (n=3-4/time point/genotype, see also Table S4) were used for each time point. The white and black bar represents light cycle and dark cycle, respectively. Zeitgeber time ZT0: lights on; ZT12: lights off. (C) Western blot signals in (B) were quantified and normalized to the loading control (Hsp60). (D) Bioenergetics assays in hepatocytes from control and LBmal1KO mice isolated at ZT6 and ZT18. Numbers 1-3 refer to the time course of adding oligomycin, FCCP, and antimycin A/rotenone. a, b and c in ZT6 WT hepatocytes indicate the basal oxygen consumption rate (OCR), ATP turnover and uncoupled respiration (proton leak), respectively. (E) The basal OCR, uncoupled respiration, and coupling efficiency (ATP turnover/basal OCR) calculated based on data in (D). Data presented as mean ± SEM. *p<0.05.
Figure 2
Figure 2. Diurnal mitochondrial remodeling is abolished in LBmal1KO liver
(A) Representative electron microscopy images of liver sections from WT and LBmal1KO mice (n=3/time point/genotype) at ZT6 and ZT18. (B) Mitochondrial size distribution calculated from EM images in 1000 μm2 surface area/liver. (C) The mitochondrial surface (average), density, and coverage calculated from EM images at ZT6 and ZT18. (D) Coupling assay in mitochondria isolated from WT and LBmal1KO livers at ZT6 and ZT18. A-D refer to the time course of adding ADP, oligomycin, FCCP, and antimycin A. Stages 3, 4o, and 3u respiration are indicated. (E) The basal oxygen consumption rate (OCR, left panel) and respiratory control ratio (RCR=3u/4o, right panel) determined based on data in (D). (F) Images of liver tissue sections showing GFP-tagged mitochondria in WT and LBmal1KO mice fed ad libitum and sacrificed at ZT4 or ZT16. Green: Cox8a-GFP. Blue: nucleus stained with DAPI. (G) Images of mitochondrial network from fasted/refed mice. Food was removed at ZT12. Mice were sacrificed at ZT16 (fasted) or refed at ZT0 and sacrificed at ZT4 (see top panel for the experimental design). Data presented as mean ± SEM. *p<0.05.
Figure 3
Figure 3. Bmal1-controlled mitochondrial dynamics regulates metabolic flexibility
(A) Representative time-lapse confocal images of the mitochondrial network in WT or LBmal1KO primary hepatocytes. Cells were cultured in low nutrient (5.5 mM glucose) for 1 hr and switched to high nutrient (25 mM glucose/0.3 mM palmitic acid). Cox8a-GFP adenovirus was used to tag mitochondria. Right panel: The average mitochondrial size (n=10). (B) Western blotting of mitochondrial dynamics proteins in WT and LBmal1KO primary hepatocytes cultured in high nutrient for the indicated times. Samples were run on the same gel with lanes omitted for clarity (indicated with the dotted line). pDrp1(s616): phosphor-Drp1 at ser616 indicative of increased Drp1 activity. (C) The basal oxygen consumption rate (OCR) and uncoupled respiration of WT and LBmal1KO primary hepatocytes cultured in low or high nutrient medium for 4 hours. Data presented as mean ± SEM. *p<0.05.
Figure 4
Figure 4. Fis1 overexpression normalizes mitochondrial morphology and superoxide production in LBmal1KO primary hepatocytes
(A) Representative confocal images of the mitochondrial network in WT or LBmal1KO primary hepatocyte that were first infected with adCox8a-GFP, followed by adFis1 or control virus (empty vector, adCont). Cells were cultured either in EBSS or 25 mM glucose/0.3 mM palmitic acid (HG+PA). Blue: DAPI staining of nucleus. (B) Superoxide production assessed by MitoSOX Red normalized to MitoTracker green fluorescence in WT and LBmal1KO primary hepatocytes (representative images shown in Figure S3). Hepatocytes were transduced with adFis1 or adCont and cultured in EBSS or HG+PA. Results were quantified from 12 cells per group. (C) Uncoupled respiration measured by the Seahorse bioenergetics analyzer in WT and LBmal1KO hepatocytes transduced with adCont or adFis1 under HG+PA. Data presented as mean ± SEM. *p<0.05.
Figure 5
Figure 5. The oxidative metabolism pathway is a primary transcriptional target of the hepatic clock
(A) Partial list of the 211 genes involved in mitochondrial function that are bound by Bmal1, Clock, and Cry1 (see also Table S1). (B) ChIP-seq signal of representative Bmal1 target genes in WT and Bmal1 knockout (Bmal1KO) liver. Original data were derived from published sources (Koike et al., 2012). (C) The frequency distribution of peak mRNA expression throughout the day of the 211 genes involved in mitochondrial function. (D) Diurnal expression of mitochondrial oxidative metabolism genes in control and LBmal1KO mice. Liver samples were collected every 4 hr for 24 hr (n=3-4/time point/genotype). The white and black bar represents light cycle and dark cycle, respectively. (E-F) Mitochondrial biogenesis in liver samples isolated at different time points determined by the relative Nd1 DNA content (E) or by flow cytometry analysis of MitoTracker Green staining. Data presented as mean ± SEM. *p<0.05.
Figure 6
Figure 6. Hepatic Bmal1 regulates oxidative stress, lipid homeostasis, and insulin response
(A) Expression of Bmal1 targets involved in mitochondrial function in liver from WT and LBmal1KO mice on high fat diet (HFD) for 5 months. Samples were collected at ZT12 (n=6/genotype). Upper panel: mRNA expression determined by real-time PCR. Lower panel: Western blot analyses. (B) OXPHOS protein levels in livers from HFD fed WT and LBmal1KO mice (n=6/genotype). Upper panel: Western blot analysis. C-I, II, and IV: ETC complex I (Ndufa9), II (Sdha), and IV (Cox4). Lower left panel: quantification of protein levels normalized to actin. Lower right panel: Complex I activity using mitochondria isolated from livers of WT and LBmal1KO mice. Rotenone is used as a negative control. (C) Oxidative damage assessed by levels of protein carbonylation in liver lysate from WT and LBmal1KO mice (n=6) fed a HFD for 5 months using Western blotting. c: negative control liver lysate from a WT mouse omitting DNPH substrates. Quantification normalized to actin is shown at the lower panel. (D) Western blot analyses of hepatic insulin signaling. Akt phosphorylation was examined in livers collected prior to and 5 min after insulin injection (n=3-4). The level of insulin-stimulated phospho-Akt (p-Akt) was quantified and normalized to that of the total Akt (t-Akt, right panel). (E) ITT (left) and GTT (right) in high fat fed WT and LBmal1KO mice (n=7-8). (F) The HOMA-IR assessment. (G) Western blot analyses of liver insulin signaling in high fat fed control (adGFP) and hepatic Bmal1 over-expression (adBmal1) mice (n=3-4) (H-I) ITT, GTT, and HOMA-IR in adGFP and adBmal1 mice (n=5-6). (J)-(M) Effect of hepatic Fis1 overexpression in WT and LBmal1KO mice. Mice (HFD fed for 5 months; n=6/genotype) were given adGFP (control) or adFis1 for 1 week. (J) Quantification of hepatic Fis1 protein levels. (K) Left panel: liver histology with H & E staining; Right panel: hepatic triglyceride (TG) content. (L) Relative protein carbonylation in liver samples (n=4, see also Figure S5G). (M) Serum alanine aminotransferase (ALT) activity. Data presented as mean ± SEM. *p<0.05.
Figure 7
Figure 7. C. elegans Bmal1 homologue AHA-1 modulates oxidative metabolism and lifespan
(A) Gene ontology analysis of AHA-1 ChIP-seq data. (B) Expression analyses of potential AHA-1 target genes in OXPHOS based on the ChIP-seq analysis (see also Table S3) determined by real-time PCR in control (control RNAi) and aha-1 knockdown (aha-1 RNAi) worms. (C) Assessment of triglyceride (TG) content. (D) Representative fluorescence microscopy images showing muscle mitochondrial organization in mitochondrial reporter worms fed control or aha-1 RNAi. (E) OXPHOS gene expression in control (N2 strain) and aha-1 gain-of-function worms (strain OP124). C-I, II, IV and V: Mitochondrial Complex-I, II, IV and V. (F) Lifespan of control and two separate strains of aha-1 gain-of-function worms (OP124 and UL1606). Data presented as mean ± SEM. *p<0.05.

References

    1. Asher G, Schibler U. Crosstalk between components of circadian and metabolic cycles in mammals. Cell. Metab. 2011;13:125–137. - PubMed
    1. Balaban RS, Nemoto S, Finkel T. Mitochondria, Oxidants, and Aging. Cell. 2005;120:483–495. - PubMed
    1. Banerjee D, Kwok A, Lin SY, Slack FJ. Developmental timing in C. elegans is regulated by kin-20 and tim-1, homologs of core circadian clock genes. Dev. Cell. 2005;8:287–295. - PubMed
    1. Bass J, Takahashi JS. Circadian integration of metabolism and energetics. Science. 2010;330:1349–1354. - PMC - PubMed
    1. Bueno M, Lai YC, Romero Y, Brands J, St Croix CM, Kamga C, Corey C, Herazo-Maya JD, Sembrat J, Lee JS, et al. PINK1 deficiency impairs mitochondrial homeostasis and promotes lung fibrosis. J. Clin. Invest. 2015;125:521–538. - PMC - PubMed

Publication types

MeSH terms

LinkOut - more resources