. 2015 Sep 29;12(12):2099-110.
doi: 10.1016/j.celrep.2015.08.049. Epub 2015 Sep 10.

TCF1 Is Required for the T Follicular Helper Cell Response to Viral Infection

Affiliations

TCF1 Is Required for the T Follicular Helper Cell Response to Viral Infection

Tuoqi Wu et al. Cell Rep. .

Abstract

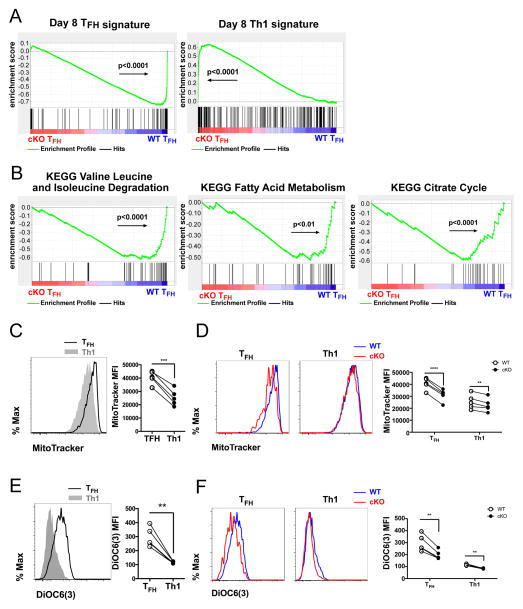
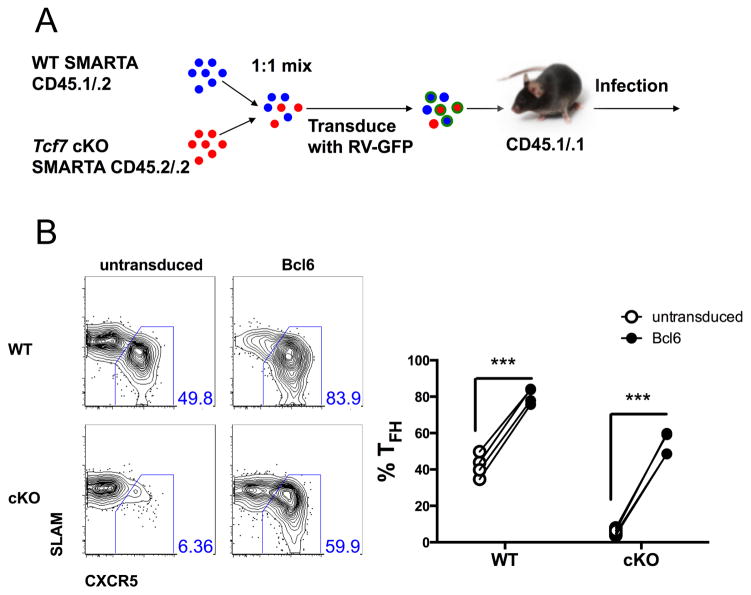
T follicular helper (TFH) and T helper 1 (Th1) cells generated after viral infections are critical for the control of infection and the development of immunological memory. However, the mechanisms that govern the differentiation and maintenance of these two distinct lineages during viral infection remain unclear. We found that viral-specific TFH and Th1 cells showed reciprocal expression of the transcriptions factors TCF1 and Blimp1 early after infection, even before the differential expression of the canonical TFH marker CXCR5. Furthermore, TCF1 was intrinsically required for the TFH cell response to viral infection; in the absence of TCF1, the TFH cell response was severely compromised, and the remaining TCF1-deficient TFH cells failed to maintain TFH-associated transcriptional and metabolic signatures, which were distinct from those in Th1 cells. Mechanistically, TCF1 functioned through forming negative feedback loops with IL-2 and Blimp1. Our findings demonstrate an essential role of TCF1 in TFH cell responses to viral infection.


Conflict of interest statement

The authors declare no competing financial interests.

Figures

Figure 1
Figure 1. TCF1 is differentially expressed between TFH and Th1 cells after LCMV infection
(A, B) 106 CellTrace Violet labeled (CTV) purified naïve CD45.1+ Blimp1-YFP SMARTA CD4 T cells were transferred into C57BL/6 mice followed by infection with LCMV Armstrong. Splenocytes (gated on CD45.1+ SMARTA CD4 T cells) were analyzed on day 1.5, 2, and 3 after infection. (A) Analyses of Blimp1-YFP, CXCR5, and TCF1 expression. (B) Analyses of CTV dilution plus phenotypic markers. (C) C57BL/6 mice received 104 purified naïve CD45.1+ Blimp1-YFP SMARTA CD4 T cells and were infected with LCMV Armstrong. Splenocytes (gated on SMARTA cells) were analyzed on day 7 p.i., for Blimp1-YFP, CXCR5, and TCF1. Right: TCF1 in SMARTA cells (blue) and host B cells (red). (D) TCF1 protein in day 3 TFH (CXCR5highTim3low), day 3 Th1 (CXCR5lowTim3high), day 8 TFH (CXCR5highSLAMlow), and day 8 Th1 (CXCR5lowSLAMhigh) SMARTA CD4 T cells. β-actin was used as a loading control. Data in (A, B) are from a single experiment (n≥2 per timepoint), representative of >4 independent experiments. Data in (C) are from a single experiment (n=3) representative of 2 independent experiments. Western blots are representative of 2 independent experiments.
Figure 2
Figure 2. IL-2 and Blimp1 negatively regulate TCF1 expression
(A) Naïve CD4 T cells were stimulated with anti-CD3 and anti-CD28 for 3 days, then cultured with or without hIL-2 for 1 day and the mean fluorescence intensity (MFI) of CD25 and TCF1 determined by flow cytometry. Unpaired Student’s t tests were performed; error bars represent SD. Data are from a single experiment representative of 4 independent experiments. (B) 106 SMARTA CD4 T cells were transduced with retroviruses containing a scrambled control sequence or shRNA for Prdm1, and transferred into C57BL/6 recipients followed by infection with LCMV. On day 3 p.i., TCF1 expression in Th1 (CXCR5lowCD25high) SMARTA cells was determined. Paired Student’s t tests were performed between transduced (GFP+) and untransduced populations within each group. Each line represents data from one individual mouse. Data are from a single experiment (n=4 per group) representative of 2 independent experiments. (C, D) Day 8 p.i., TFH and Th1 SMARTA T cells were isolated and ChIP assays performed with antibodies to Blimp-1 (C) or a control IgG, and with antibodies to modified histone H3 (D) as indicated. ChIPs were amplified by QRT-PCR for the indicated region. Data are the mean +/− SEM of three independent experiments. Significance was determined by an unpaired t test. (E) 293T cells were co-transfected with pGL3 SV40 promoter vector containing Tcf7 −30kb region and MSCV-IRES-GFP (MIG) with or without Blimp1. Luciferase activity was normalized to Renilla activity and adjusted to the fold increase over empty pGL3 SV40 vector. Data are the mean +/− SD of three independent transfections in one of 2 independent experiments. Significance was determined by an unpaired t test.
Figure 3
Figure 3. TCF1 is required for the differentiation of TFH cells
(A–D) Tcf7loxP/loxP; CD4-Cre (cKO) mice and littermate controls (WT) were infected with LCMV and splenocytes isolated on day 10 p.i.. (A) Analyses of CXCR5, SLAM, PD1, and Bcl6 in WT and cKO GP66-77 IAb tetramer+ CD4 T cells. (B) Numbers of GP66-77 IAb tetramer+ CXCR5highSLAMlow (TFH) and CXCR5lowSLAMhigh (Th1) CD4 T cells in spleens of WT or cKO mice. (C) Representative FACS plots of CXCR5 and SLAM staining (gated on CD44high CD4 T cells) and numbers of CXCR5highSLAMlowCD44high (TFH) CD4 T cells in spleens. (D) Representative FACS plots and numbers of FAShighGL7high (GC) B cells (gated on CD19+B220+ cells) and activated (IgDlow FAShigh) B cells in WT and cKO spleens. (E) Tcf7loxP/loxP; ERT2-Cre (iKO) mice were treated with either 2mg tamoxifen or vehicle daily for 3 days and then infected with LCMV. Day 10 p.i. analyses of CXCR5 and SLAM staining (gated on GP66-77 IAb tetramer+ CD4 T cells) and numbers of GP66-77 IAb tetramer+ CXCR5highSLAMlow (TFH) and CXCR5lowSLAMhigh (Th1) CD4 T cells in the spleens. Data in (A–D) are from a single experiment (n=4 per genotype), representing 2 independent experiments. Data in (E) are from a single experiment (n=4 per genotype), representative of 3 independent experiments. Significance was determined by unpaired t tests; error bars represent SD.
Figure 4
Figure 4. Loss of TCF1 causes a cell-intrinsic defect in TFH cell differentiation starting from early after infection
(A–E) Purified CD4 T cells from cKO (CD45.1CD45.2+) and WT (CD45.1+CD45.2+) SMARTA mice were mixed at ~1:1 ratio, transferred into WT CD45.1 mice (106 cells per recipient for day 3 and 104 cells for day 8 experiments). Chimeras were then infected with LCMV. TCF1 deletion was confirmed by flow cytometry (Figure S4A, S4D). Data are from a single experiment (n=4) representative of 3 independent experiments. Each line represents data from one mouse. (B, C) Frequencies of TFH (CXCR5high Tim3low or CXCR5highBcl6high) and Th1 (CXCR5low Tim3high) cells in WT and cKO SMARTA cells in spleens on day 3 p.i.. (D, E) Frequencies of TFH (CXCR5high SLAMlow or CXCR5highBcl6high) and Th1 (CXCR5low SLAMhigh) cells in splenic WT and cKO SMARTA cells on day 8 p.i.. (F, G) Purified CD4 T cells from iKO (CD45.1CD45.2+) and WT (CD45.1+CD45.2+) SMARTA mice were mixed at ~1:1 ratio and transferred into WT CD45.1 mice, which were then treated with 2mg tamoxifen for 3 days. Chimeras were then infected with LCMV and analyzed on 8 day p.i. for TCF1 (Figure S4K), and for frequencies of TFH (CXCR5high SLAMlow or CXCR5highBcl6high) and Th1 (CXCR5low SLAMhigh) cells in WT and iKO SMARTA cells. Data are from a single experiment (n=4) representative of 3 independent experiments. Each line represents data from one mouse. (H) SAP KO (CD45.2) mice were transferred with 5000 purified CD4 T cells from iKO or WT SMARTA (CD45.2+) mice, treated with 2mg tamoxifen daily for 3 days, infected with LCMV and splenocytes stained for GC (GL7high FAShigh) B cells and activated (IgDlow FAShigh) B cells on day 11p.i.. Flow plots were gated on CD19+B220+ cells. Data are from a single experiment (n=4) representative of 3 independent experiments. Statistical significance was determined by paired (B–G) or unpaired (H) t tests; error bars represent SD.
Figure 5
Figure 5. Loss of TCF1 changes the transcriptional and metabolic signatures of TFH cells
(A) Microarray analyses of day 8 TFH (CXCR5high SLAMlow) and Th1 (CXCR5low SLAMhigh) cKO and WT SMARTA cells isolated by cell sorting from co-transfer experimnets setup as in Figure 4A. Genes expressed >2-fold (p<0.05) in WT TFH cells than WT Th1 cells were listed as the TFH gene set and those >2-fold (p<0.05) expressed in WT Th1 cells were listed as the Th1 gene set (Table S1). Enrichment of gene sets in cKO relative to WT TFH cells were determined by GSEA. Positive enrichment scores (ES) indicate enrichment in cKO TFH cells; negative ES indicates enrichment in WT TFH cells. (B) Enrichment of gene sets related to branched chain amino acid degradation, fatty acid metabolism, and citrate cycle in cKO TFH relative to WT TFH cells determined by GSEA using KEGG curated pathway database. (C–F) Experiments were set up as Figure 4A. (C) Comparison of mitochondrial mass between day 8 WT TFH (CXCR5high SLAMlow solid line) and WT Th1 (CXCR5low SLAMhigh shaded) SMARTA cells, as determined by MitoTracker® Green FM. (D) Mitochondrial mass of day 8 TFH and Th1 cKO (red) and WT (blue) SMARTA cells. (E) Mitochondrial membrane potential of day 8 WT TFH (solid line) and WT Th1 (shaded) SMARTA cells, as determined by the MFI of DiOC6(3) staining. (F) Mitochondrial membrane potential of day 8 TFH and Th1 cKO (red) and WT (blue) SMARTA cells. Data in (C–F) are from single experiments (n=5) representative of 2 independent experiments. Statistical significance in (C–F) was determined by paired t tests. Each line represents data from a single mouse.
Figure 6
Figure 6. TCF1 suppresses the expression of Prdm1 and Il2ra
(A, B) QRT-PCR analyses of mRNA levels of Prdm1 and Il2ra in sorted day 3 (A) or day 8 (B) TFH and Th1 iKO and WT SMARTA cells, normalized to the mRNA levels of Actb. Data are from a single experiment representative of 2 independent experiments, set up as in Figure 4F and S4G. Statistical significance determined by an unpaired t test; error bars represent SD. (C) 104 purified CD4 T cells from cKO (CD45.1CD45.2+) and WT (CD45.1+CD45.2+) SMARTA mice were mixed at ~1:1 ratio and adoptively transferred into each recipient, which were then infected with LCMV. On day 5 p.i., splenocytes were collected, cultured with or without 50U/mL human rIL-2 for 20min at 37°C and MFI of pSTAT5 in TFH cKO and WT SMARTA determined. Data are from a single experiment (n=5) representative of 2 independent experiments. Significance was determined by a paired t test. (D) ChIP from day 8 TFH and Th1 SMARTA cells using antibodies to TCF1 or control IgG and amplified by QRT-PCR for the indicated regions (the third intron of Prdm1, the first intron of Il2ra, and −23kb from Il2ra TSS). Data are the mean +/− SEM of three independent experiments. Significance was determined by an unpaired t test.
Figure 7
Figure 7. Tcf7 deficiency is rescued by Bcl6 over-expression
(A) cKO and WT SMARTA CD4 T cells were mixed at ~1:1 ratio, transduced with retroviral constructs over-expressing Bcl6, and transferred into WT CD45.1 recipients (2×10⁴ cells per recipient) that were then infected with LCMV. (B) Frequencies of TFH within WT or cKO SMARTA cells untransduced or transduced with Bcl6 over-expression construct on day 8 p.i.. Data is from a single experiment representative of 2 independent experiments. Significance was determined by paired t tests.

References

    1. Allen CD, Okada T, Cyster JG. Germinal-center organization and cellular dynamics. Immunity. 2007;27:190–202. - PMC - PubMed
    1. Arsenio J, Kakaradov B, Metz PJ, Kim SH, Yeo GW, Chang JT. Early specification of CD8+ T lymphocyte fates during adaptive immunity revealed by single-cell gene-expression analyses. Nature immunology. 2014;15:365–372. - PMC - PubMed
    1. Ballesteros-Tato A, Leon B, Graf BA, Moquin A, Adams PS, Lund FE, Randall TD. Interleukin-2 inhibits germinal center formation by limiting T follicular helper cell differentiation. Immunity. 2012;36:847–856. - PMC - PubMed
    1. Baumjohann D, Okada T, Ansel KM. Cutting Edge: Distinct waves of BCL6 expression during T follicular helper cell development. Journal of immunology. 2011;187:2089–2092. - PubMed
    1. Cannons JL, Lu KT, Schwartzberg PL. T follicular helper cell diversity and plasticity. Trends in immunology. 2013;34:200–207. - PMC - PubMed

Publication types

MeSH terms