

Disaster risk profile and existing legal framework of Nepal: floods and landslides
- PMID: 26366106
- PMCID: PMC4562653
- DOI: 10.2147/RMHP.S90238
Disaster risk profile and existing legal framework of Nepal: floods and landslides
Abstract
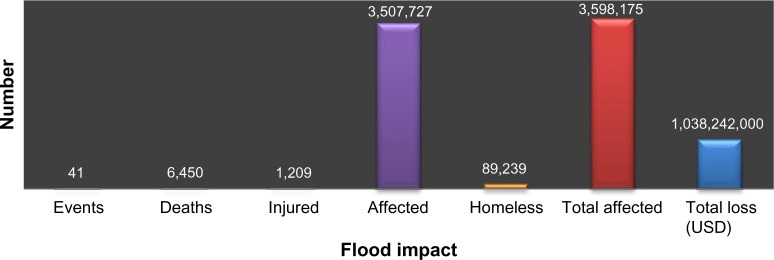
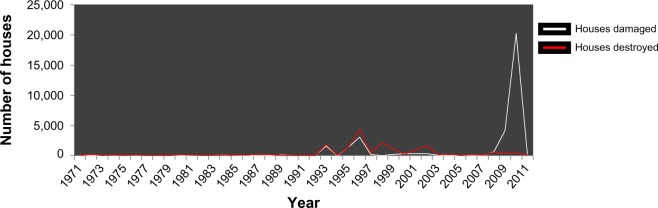
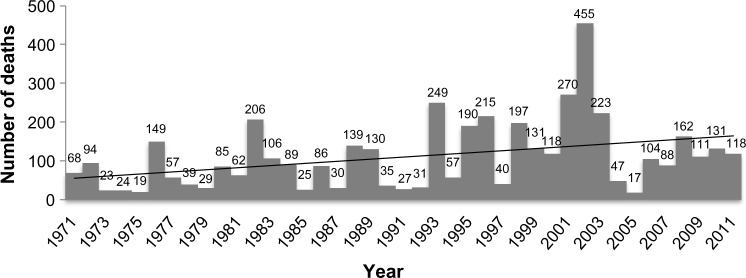
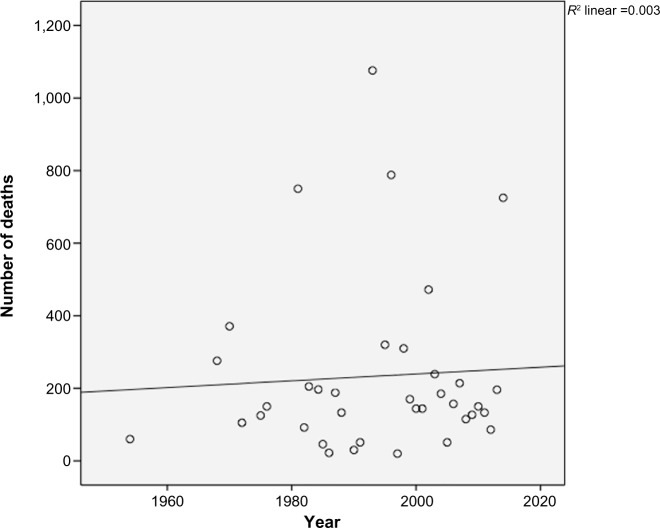
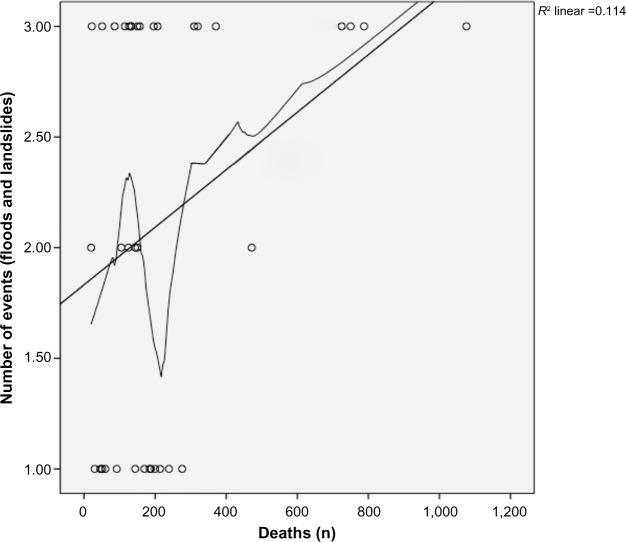
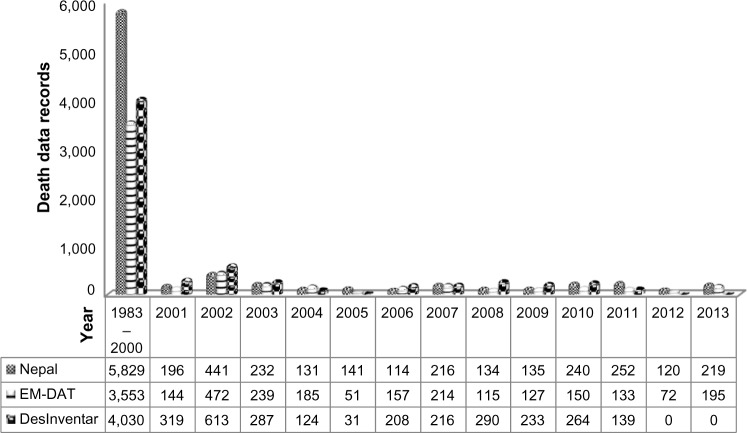
Nepal has a complicated geophysical structure that is prone to various kinds of disasters. Nepal ranks the most disaster-prone country in the world and has experienced several natural calamities, causing high property and life losses. Disasters are caused by natural processes, but may be increased by human activities. The overall objective of this paper is to analyze the disaster risk profile and existing legal framework of Nepal. The paper is based on secondary data sources. Major causative factors for floods and landslides are heavy and continuous rainfall, outburst floods, infrastructure failure, and deforestation. Historical data of natural disasters in Nepal show that water-induced disasters have killed hundreds of people and affected thousands every year. Likewise, properties worth millions of US dollars have been damaged. There is an increasing trend toward landslides and floods, which will likely continue to rise if proper intervention is not taken. A positive correlation between water-induced disasters and deaths has been observed. Nepal has a poor Index for Risk Management (INFORM). There are fluctuations in the recording of death data caused by flood and landslides. The Government of Nepal focuses more on the response phase than on the preparedness phase of disasters. The existing disaster management act seems to be weak and outdated. There is a gap in current legal procedure, so the country is in dire need of a comprehensive legal framework. The new proposed act seems to take a much broader approach to disaster management. With a long-term vision of managing disaster risk in the country, the Government of Nepal has begun the Nepal Risk Reduction Consortium (NRRC) in collaboration with development and humanitarian partners. In order to improve the vulnerability of Nepal, an early warning system, mainstreaming disasters with development, research activities, community participation and awareness, and a rainfall monitoring system must all be a focus.
Keywords: monsoon rainfall; natural disasters; natural hazards; risk; risk factors; vulnerability.
Figures
Similar articles
-
Risk factors for injuries in landslide- and flood-affected populations in Uganda.Prehosp Disaster Med. 2013 Aug;28(4):314-21. doi: 10.1017/S1049023X13000356. Epub 2013 Jun 10. Prehosp Disaster Med. 2013. PMID: 23746361
-
Guiding Documents for Disaster Risk Reduction and Management in Health Care System of Nepal.JNMA J Nepal Med Assoc. 2020 Oct 15;58(230):831-833. doi: 10.31729/jnma.5041. JNMA J Nepal Med Assoc. 2020. PMID: 34504377 Free PMC article.
-
Mental health and psychosocial support aspects in disaster preparedness: Nepal.Int Rev Psychiatry. 2006 Dec;18(6):587-92. doi: 10.1080/09540260601038407. Int Rev Psychiatry. 2006. PMID: 17162702
-
Trends in extreme rainfall and hydrogeometeorological disasters in the Metropolitan Area of São Paulo: a review.Ann N Y Acad Sci. 2020 Jul;1472(1):5-20. doi: 10.1111/nyas.14307. Epub 2020 Feb 13. Ann N Y Acad Sci. 2020. PMID: 32052870 Review.
-
Remote Sensing Methods for Flood Prediction: A Review.Sensors (Basel). 2022 Jan 26;22(3):960. doi: 10.3390/s22030960. Sensors (Basel). 2022. PMID: 35161706 Free PMC article. Review.
Cited by
-
Benchmarking Community Disaster Resilience in Nepal.Int J Environ Res Public Health. 2020 Mar 18;17(6):1985. doi: 10.3390/ijerph17061985. Int J Environ Res Public Health. 2020. PMID: 32197298 Free PMC article.
-
On people's perceptions of climate change and its impacts in a hotspot of global warming.PLoS One. 2025 Feb 13;20(2):e0317786. doi: 10.1371/journal.pone.0317786. eCollection 2025. PLoS One. 2025. PMID: 39946319 Free PMC article.
References
-
- Central Bureau of Statistics (CBS) National Population and Housing Census 2011 (National Report) Kathmandu: Government of Nepal; 2012. [Accessed: November 3, 2014]. Available from http://cbs.gov.np/wp-content/uploads/2012/11/National%20Report.pdf.
-
- National Society for Earthquake Technology – Nepal (NSET) Global Assessment of Risk: Nepal Country Report. Kathmandu: 2008. [Accessed November 3, 2014]. Available from http://www.gripweb.org/gripweb/sites/default/files/CSA_Report_Nepal_Draf....
-
- National Society for Earthquake Technology - Nepal (NSET) Nepal Country Report: Global Assessment of Risk. Kathmandu: United Nations Development Programme; 2009. [Accessed November 4, 2014]. Available from http://www.undp.org/content/dam/nepal/docs/reports/UNDP_NP_Nepal%20Count....
-
- Country Profile, hazard profile, disaster profile [webpage on the Inter-net] Government of Nepal; 2011. [Accessed November 16, 2014]. Available from: http://www.saarc-sadkn.org/countries/nepal/country_profile.aspx.
-
- Khanal NR, Shrestha M, Ghimire M, editors. Preparing for Flood Disaster: Mapping and Assessing Hazard in the Ratu Watershed, Nepal. Nepal: International Centre for Integrated Mountain Development (ICIMOD) and New Delhi: United Nations Educational Scientific and Cultural Organization (UNESCO); 2007.
LinkOut - more resources
Full Text Sources
Miscellaneous
