. 2015;11(5):1157-1174.
doi: 10.1007/s11306-015-0772-0. Epub 2015 Jan 20.

Comprehensive metabolome analyses reveal N-acetylcysteine-responsive accumulation of kynurenine in systemic lupus erythematosus: implications for activation of the mechanistic target of rapamycin

Affiliations

Comprehensive metabolome analyses reveal N-acetylcysteine-responsive accumulation of kynurenine in systemic lupus erythematosus: implications for activation of the mechanistic target of rapamycin

Andras Perl et al. Metabolomics. 2015.

Abstract

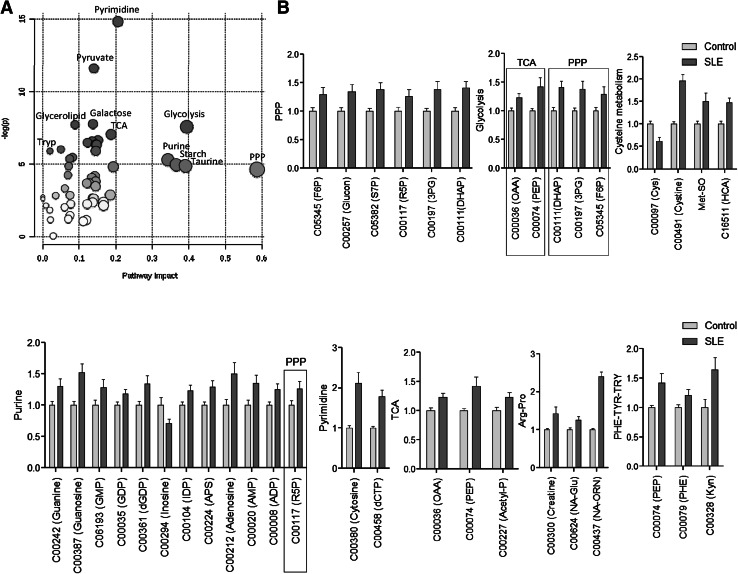
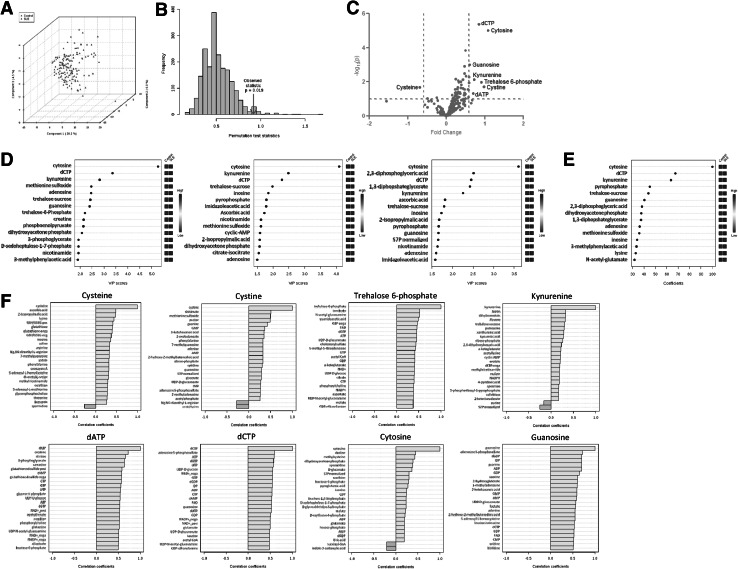
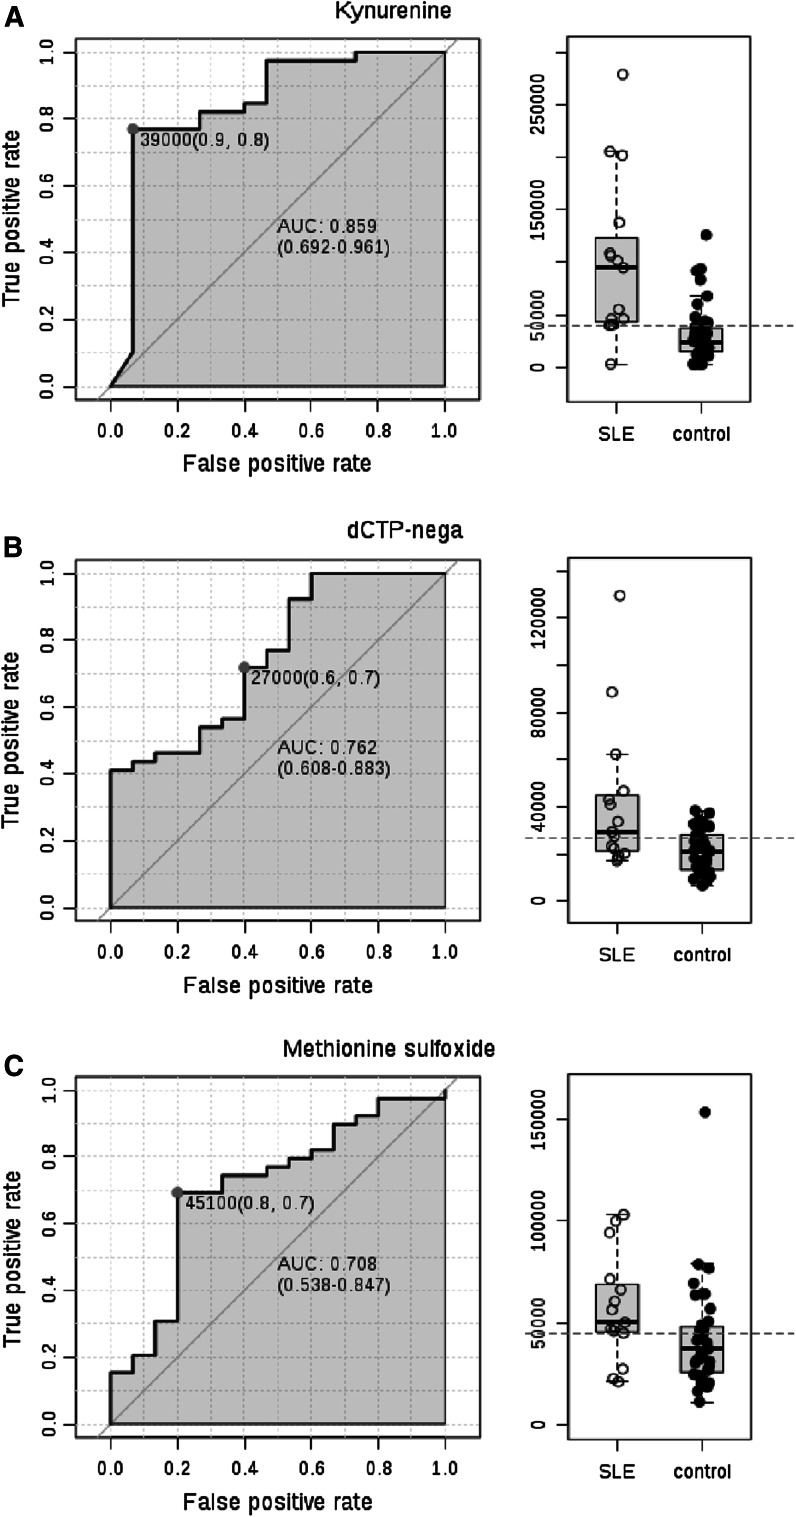
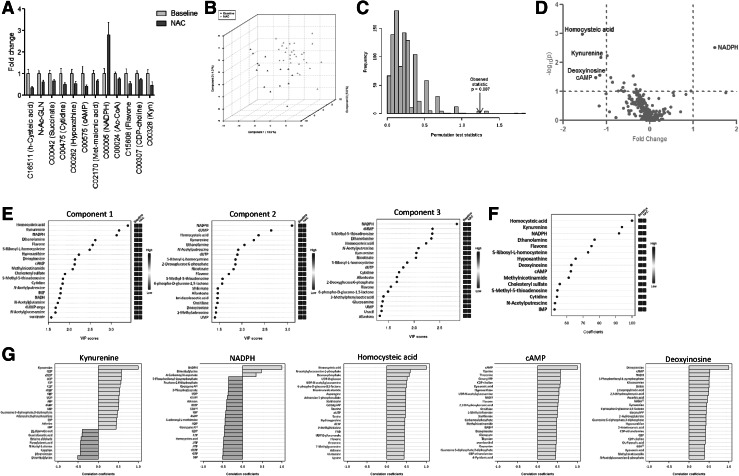
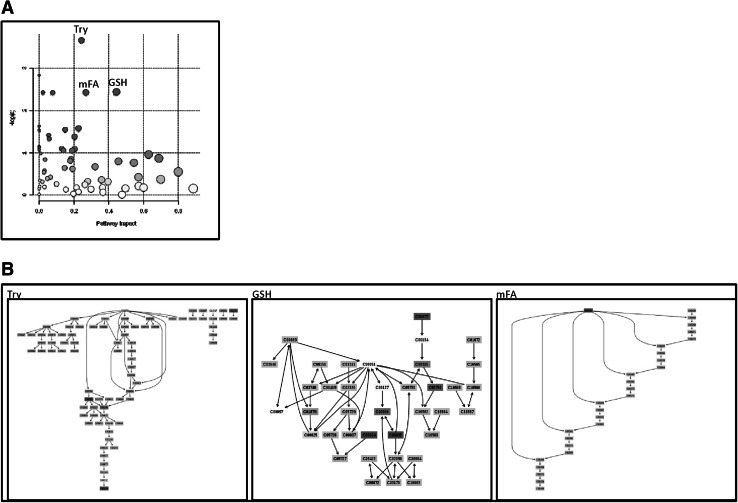
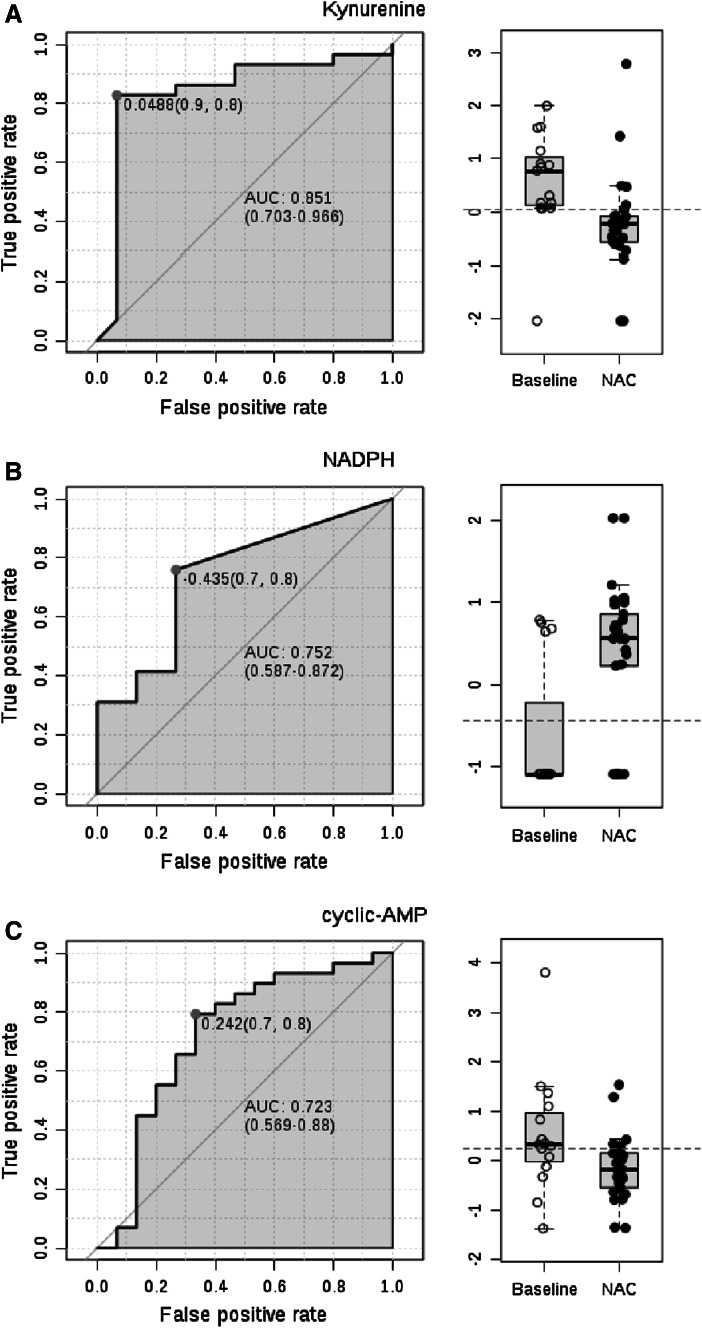
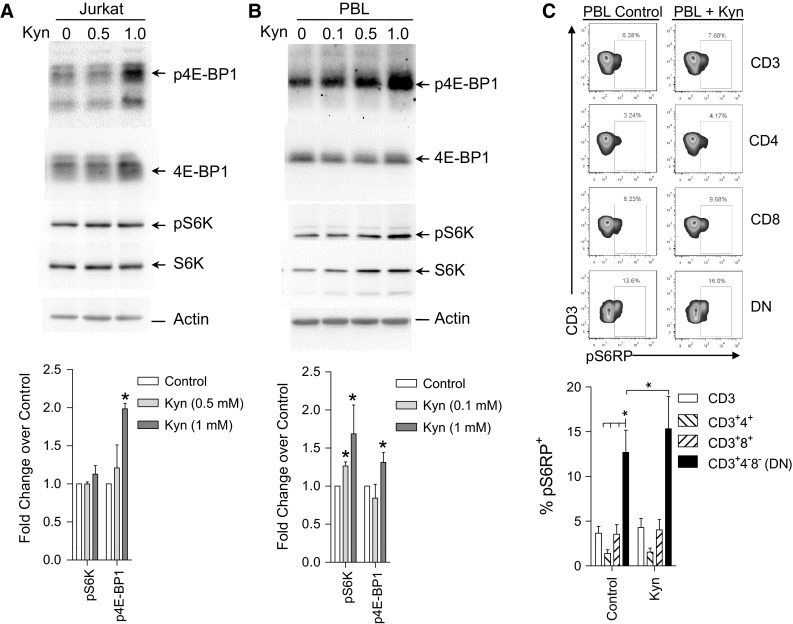
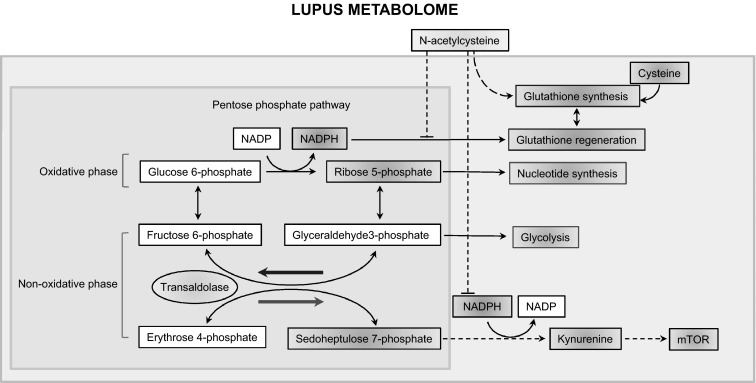
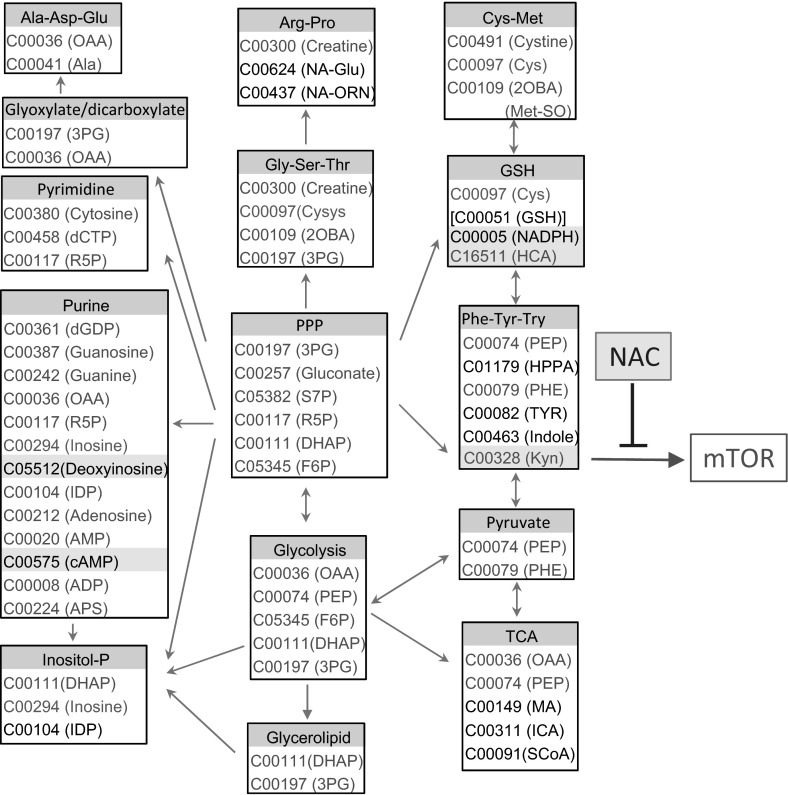
Systemic lupus erythematosus (SLE) patients exhibit depletion of the intracellular antioxidant glutathione and downstream activation of the metabolic sensor, mechanistic target of rapamycin (mTOR). Since reversal of glutathione depletion by the amino acid precursor, N-acetylcysteine (NAC), is therapeutic in SLE, its mechanism of impact on the metabolome was examined within the context of a double-blind placebo-controlled trial. Quantitative metabolome profiling of peripheral blood lymphocytes (PBL) was performed in 36 SLE patients and 42 healthy controls matched for age, gender, and ethnicity of patients using mass spectrometry that covers all major metabolic pathways. mTOR activity was assessed by western blot and flow cytometry. Metabolome changes in lupus PBL affected 27 of 80 KEGG pathways at FDR p < 0.05 with most prominent impact on the pentose phosphate pathway (PPP). While cysteine was depleted, cystine, kynurenine, cytosine, and dCTP were the most increased metabolites. Area under the receiver operating characteristic curve (AUC) logistic regression approach identified kynurenine (AUC = 0.859), dCTP (AUC = 0.762), and methionine sulfoxide (AUC = 0.708), as top predictors of SLE. Kynurenine was the top predictor of NAC effect in SLE (AUC = 0.851). NAC treatment significantly reduced kynurenine levels relative to placebo in vivo (raw p = 2.8 × 10⁻⁷, FDR corrected p = 6.6 × 10⁻⁵). Kynurenine stimulated mTOR activity in healthy control PBL in vitro. Metabolome changes in lupus PBL reveal a dominant impact on the PPP that reflect greater demand for nucleotides and oxidative stress. The PPP-connected and NAC-responsive accumulation of kynurenine and its stimulation of mTOR are identified as novel metabolic checkpoints in lupus pathogenesis.

Keywords: Kynurenine; N-acetylcysteine; Oxidative stress; Pentose phosphate pathway; mTOR.


Figures

Fig. 1
Fig. 1
Metabolic pathway analysis of quantitative changes in compound concentrations in PBL samples of 36 SLE patients relative to 42 healthy subjects matched for age within 10 years, gender, and ethnic background. a The ‘metabolome view’ shows all 80 KEGG metabolic pathways arranged according to the scores from enrichment analysis (y axis: −log p) and topology analysis (x axis: impact: number of detected metabolites in a pathway with significant p values). b Metabolites with altered levels in lupus PBL relative to matched healthy control PBL normalized to 1.0 for each compound. 6 of 34 altered metabolites can enter multiple pathways: 4 of such 6 metabolites are substrates in the PPP, while 2 metabolites are common with the TCA. Only 2/34 altered metabolites were depleted, cysteine and inosine
Fig. 2
Fig. 2
Partial least squares-discriminant analysis (PLS-DA) of metabolite concentrations in lupus and control PBL. Samples obtained from 36 lupus patients before initiation of treatment with NAC, e.g. Visit 1, were compared to samples from 42 healthy subjects processed in parallel. a 3-dimensional score plot of PLS-DA using components 1, 2, and 3, accounting for 20.2, 6.9, and 4.5 % of the total variance. b Validation of PLS-DA by permutation test p value <0.001. c Volcano plot is a combination of fold change (FC, log2 FC: X axis) and t test p values (−log10 p: Y axis). d Variable importance in projection (VIP) scores of 15 top contributors to PLS-DA components 1–3. e Coefficient-based importance measures of top 15 contributors to components 1–3. f Correlation plot showing the compounds as horizontal bars, with colors in light pink indicating positive correlations and those in light blue indicating negative correlations with top lupus-associated metabolites identified in the volcano plot (c). Values reflect Pearson’s correlation coefficients between metabolite concentrations at FDR p < 0.05 calculated by MetaboAnalyst (Color figure online)
Fig. 3
Fig. 3
Discrimination of the metabolome of lupus and control PBL based on area under the receiver operating characteristic (ROC) curve (AUC) logistic regression approach. For each of the top three discriminating metabolites, the left panel shows the AUC confidence interval, true positive and false positive rates, and confidence interval (CI), the right panel shows the concentrations of metabolites in PBL before (baseline) and during NAC treatment (NAC). AUC logistic regression approach identified Kyn (AUC = 0.859), dCTP (AUC = 0.762), and Met-SO (AUC = 0.708) to have the greatest specificity and sensitivity for distinguishing the metabolome of lupus and control PBL
Fig. 4
Fig. 4
Effect of in vivo NAC treatment on metabolite concentrations in lupus PBL by comparing pre-treatment samples obtained at visit 1 to samples obtained at visits 2–4 during biologically and clinical effective administration of NAC at doses of 2.4 g/day and 4.8 g/day. a Metabolite concentrations affected by NAC at p < 0.05 on the basis of ANOVA. b 3-dimensional score plot of PLS-DA with components 1, 2, and 3, accounting for 18.9, 5.8, and 4.3 % of the total variance. c Validation of PLS-DA by permutation test p = 0.007. d Volcano plot is a combination of fold change (log2 FC: X axis) and t test p values (−log10 p: Y axis). e Variable importance in projection (VIP) scores of 15 top contributors to the PLS-DA components 1–3. f Coefficient-based importance measures of the top 15 contributors to components 1–3. g Correlation plots showing the compounds as horizontal bars, with colors in light pink indicating positive correlations and light blue indicating negative correlations with top lupus-associated metabolites identified in the volcano plot (d). Values reflect Pearson’s correlation coefficients between metabolite concentrations at FDR p < 0.05 calculated by MetaboAnalyst (Color figure online)
Fig. 5
Fig. 5
Effect of NAC on the metabolome of lupus PBL. a Global metabolome and pathway analyses were performed between 15 pre-treatment samples obtained at visit 1 and 29 samples obtained at visits 2–4 during biologically and clinical effective administration of NAC at doses of 2.4 g/day in 17 patients and 4.8 g/day in 12 patients. b Effect of NAC on metabolic pathways. 3 pathways were affected by NAC treatment, tryptophan, GSH, and mitochondrial fatty acid elongation (mFA); none of these pathway effects survived FDR or Bonferroni correction
Fig. 6
Fig. 6
Receiver operating characteristic (ROC) curve logistic regression analysis of the metabolomic effects by NAC in lupus PBL. For each of the top three metabolites, the left panel shows the area under the ROC curve (AUC), true positive and false positive rates, and confidence interval (CI), the right panel shows the concentrations of metabolites in PBL before (baseline) and during NAC treatment (NAC). AUC logistic regression analysis indicated that Kyn (AUC = 0.851), NADPH (AUC = 0.752), and cAMP had the greatest specificity and sensitivity to detect the metabolomic effects of NAC in SLE (AUC = 0.723)
Fig. 7
Fig. 7
Activation of mTOR by kynurenine (Kyn). a Jurkat human T cells were incubated with or without Kyn at the indicated concentrations of 0.5 and 1 mM for 24 h and analyzed by western blot. mTORC1 activity was assessed by the levels of phosphorylated substrates, p4E-BP1 and pS6K, relative to actin control. b Western blot analysis of PBL from 8 healthy subjects incubated with or without Kyn at the indicated concentrations of 0.1, 0.5, and 1 mM for 24 h. C, Flow cytometry of intracellular pS6RP levels in CD4, CD8, DN T-cell subsets of 8 healthy subjects. While top panels show representative western blots (a, b) and flow cytometry dot plots (c), bottom panels indicate cumulative analyses. *reflect p values <0.05
Fig. 8
Fig. 8
Schematic diagram of the prominent metabolomic changes that impact the pentose phosphate pathway (PPP) in patients with SLE. Red and blue arrows mark the forward and reverse reactions in the PPP, which are catalyzed by transaldolase (TAL), respectively (Perl et al. 2011). Metabolites are highlighted in red or blue, which reflects their increase or decrease in lupus PBL. The PPP is connected with the depletion of cysteine and the accumulation of homocysteic acid (HCA) and kynurenine (Kyn). Therapeutic intervention with N-acetylcysteine (NAC) reverses the accumulation of Kyn and the activation of mTOR, which are thus considered redox-sensitive drivers of lupus pathogenesis (Color figure online)
Fig. 9
Fig. 9
Schematic interaction of metabolomic changes in lupus PBL via the PPP. Altered compounds are identified by standard KEGG codes and acronyms in parentheses: compounds in red indicate metabolites with increased levels in lupus PBL; compounds in blue indicate metabolites with reduced levels in lupus PBL; compounds affected by NAC treatment are highlighted in yellow; compounds in black indicate metabolites with increased levels in lupus PBL but not connected to the PPP. Green arrows indicate pathways connected by common metabolites, with arrowheads marking directionality of metabolic flux. Red arrows mark metabolites capable of directly activating mTOR (Color figure online)

References

    1. Aune TM, Pogue SL. Inhibition of tumor cell growth by interferon-γ is mediated by two distinct mechanisms dependent upon oxygen tension: Induction of tryptophan degradation and depletion of intracellular nicotinamide adenine dinucleotide. Journal of Clinical Investigation. 1989;84:863–875. doi: 10.1172/JCI114247. - DOI - PMC - PubMed
    1. Bar-Peled L, Chantranupong L, Cherniack AD, Chen WW, Ottina KA, Grabiner BC, Spear ED, Carter SL, Meyerson M, Sabatini DM. A tumor suppressor complex with GAP Activity for the Rag GTPases that signal amino acid sufficiency to mTORC1. Science. 2013;340:1100–1106. doi: 10.1126/science.1232044. - DOI - PMC - PubMed
    1. Ben-Sahra I, Howell JJ, Asara JM, Manning BD. Stimulation of de novo pyrimidine synthesis by growth signaling through mTOR and S6K1. Science. 2013;339:1323–1328. doi: 10.1126/science.1228792. - DOI - PMC - PubMed
    1. Boldyrev AA. Molecular mechanisms of homocysteine toxicity. Biochemistry (Moscow) 2009;74:589–598. doi: 10.1134/S0006297909060017. - DOI - PubMed
    1. Breton J, Avanzi N, Magagnin S, Covini N, Magistrelli G, Cozzi L, Isacchi A. Functional characterization and mechanism of action of recombinant human kynurenine 3-hydroxylase. European Journal of Biochemistry. 2000;267:1092–1099. doi: 10.1046/j.1432-1327.2000.01104.x. - DOI - PubMed

LinkOut - more resources