

Using neutral, selected, and hitchhiker loci to assess connectivity of marine populations in the genomic era
- PMID: 26366195
- PMCID: PMC4561567
- DOI: 10.1111/eva.12288
Using neutral, selected, and hitchhiker loci to assess connectivity of marine populations in the genomic era
Abstract
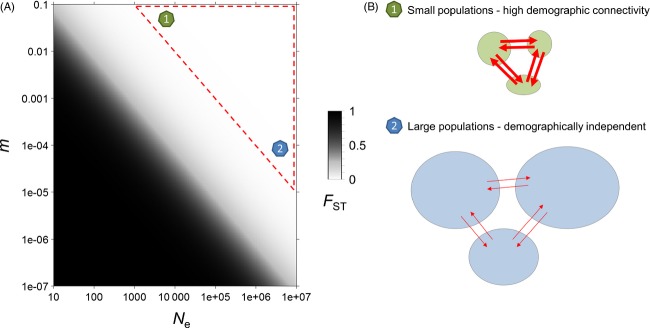
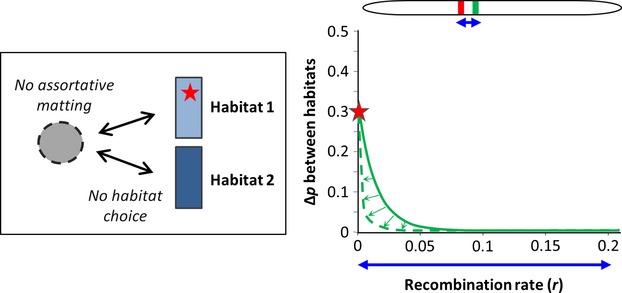
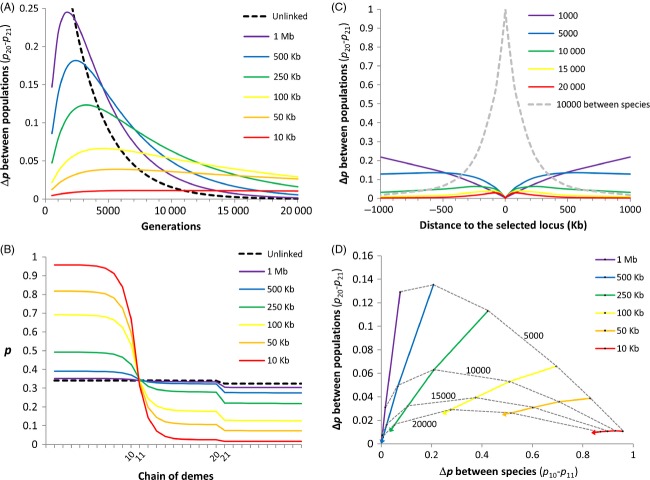
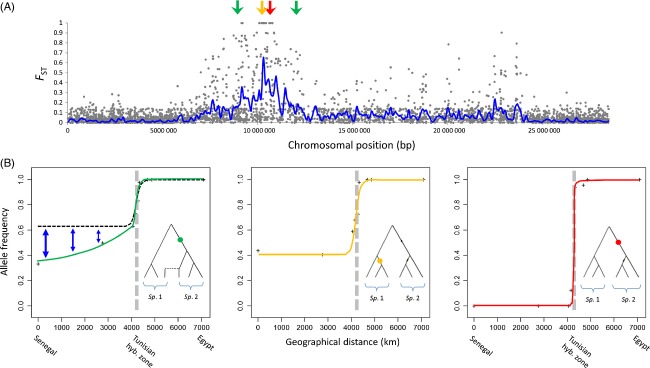
Estimating the rate of exchange of individuals among populations is a central concern to evolutionary ecology and its applications to conservation and management. For instance, the efficiency of protected areas in sustaining locally endangered populations and ecosystems depends on reserve network connectivity. The population genetics theory offers a powerful framework for estimating dispersal distances and migration rates from molecular data. In the marine realm, however, decades of molecular studies have met limited success in inferring genetic connectivity, due to the frequent lack of spatial genetic structure in species exhibiting high fecundity and dispersal capabilities. This is especially true within biogeographic regions bounded by well-known hotspots of genetic differentiation. Here, we provide an overview of the current methods for estimating genetic connectivity using molecular markers and propose several directions for improving existing approaches using large population genomic datasets. We highlight several issues that limit the effectiveness of methods based on neutral markers when there is virtually no genetic differentiation among samples. We then focus on alternative methods based on markers influenced by selection. Although some of these methodologies are still underexplored, our aim was to stimulate new research to test how broadly they are applicable to nonmodel marine species. We argue that the increased ability to apply the concepts of cline analyses will improve dispersal inferences across physical and ecological barriers that reduce connectivity locally. We finally present how neutral markers hitchhiking with selected loci can also provide information about connectivity patterns within apparently well-mixed biogeographic regions. We contend that one of the most promising applications of population genomics is the use of outlier loci to delineate relevant conservation units and related eco-geographic features across which connectivity can be measured.
Keywords: connectivity; gene flow; marine conservation; population genomics; population structure.
Figures
Similar articles
-
Identifying patterns of dispersal, connectivity and selection in the sea scallop, Placopecten magellanicus, using RADseq-derived SNPs.Evol Appl. 2016 Nov 2;10(1):102-117. doi: 10.1111/eva.12432. eCollection 2017 Jan. Evol Appl. 2016. PMID: 28035239 Free PMC article.
-
Understanding the Spatial Scale of Genetic Connectivity at Sea: Unique Insights from a Land Fish and a Meta-Analysis.PLoS One. 2016 May 19;11(5):e0150991. doi: 10.1371/journal.pone.0150991. eCollection 2016. PLoS One. 2016. PMID: 27195493 Free PMC article.
-
Population structure, genetic connectivity, and adaptation in the Olympia oyster (Ostrea lurida) along the west coast of North America.Evol Appl. 2019 Feb 28;12(5):923-939. doi: 10.1111/eva.12766. eCollection 2019 Jun. Evol Appl. 2019. PMID: 31080505 Free PMC article.
-
Larval dispersal and movement patterns of coral reef fishes, and implications for marine reserve network design.Biol Rev Camb Philos Soc. 2015 Nov;90(4):1215-47. doi: 10.1111/brv.12155. Epub 2014 Nov 25. Biol Rev Camb Philos Soc. 2015. PMID: 25423947 Review.
-
Beyond connectivity: how empirical methods can quantify population persistence to improve marine protected-area design.Ecol Appl. 2014 Mar;24(2):257-70. doi: 10.1890/13-0710.1. Ecol Appl. 2014. PMID: 24689139 Review.
Cited by
-
Transatlantic invasion routes and adaptive potential in North American populations of the invasive glossy buckthorn, Frangula alnus.Ann Bot. 2016 Nov;118(6):1089-1099. doi: 10.1093/aob/mcw157. Epub 2016 Aug 18. Ann Bot. 2016. PMID: 27539599 Free PMC article.
-
Analysis of Genome-Wide Differentiation between Native and Introduced Populations of the Cupped Oysters Crassostrea gigas and Crassostrea angulata.Genome Biol Evol. 2018 Sep 1;10(9):2518-2534. doi: 10.1093/gbe/evy194. Genome Biol Evol. 2018. PMID: 30184067 Free PMC article.
-
The role of genomic signatures of directional selection and demographic history in the population structure of a marine teleost with high gene flow.Ecol Evol. 2022 Dec 8;12(12):e9602. doi: 10.1002/ece3.9602. eCollection 2022 Dec. Ecol Evol. 2022. PMID: 36514551 Free PMC article.
-
Identifying patterns of dispersal, connectivity and selection in the sea scallop, Placopecten magellanicus, using RADseq-derived SNPs.Evol Appl. 2016 Nov 2;10(1):102-117. doi: 10.1111/eva.12432. eCollection 2017 Jan. Evol Appl. 2016. PMID: 28035239 Free PMC article.
-
Contribution of Protected Area Networks to Achieving Global Biodiversity Framework Targets and Sustainable Development Goals: Evidence From Coastal Shandong, China.Ecol Evol. 2025 Aug 17;15(8):e71900. doi: 10.1002/ece3.71900. eCollection 2025 Aug. Ecol Evol. 2025. PMID: 40831658 Free PMC article.
References
-
- Addison JA, Ort BS, Mesa KA. Pogson GH. Range-wide genetic homogeneity in the California sea mussel (Mytilus californianus): a comparison of allozymes, nuclear DNA markers, and mitochondrial DNA sequences. Molecular Ecology. 2008;17:4222–4232. - PubMed
-
- Allendorf FW, Hohenlohe PA. Luikart G. Genomics and the future of conservation genetics. Nature Reviews Genetics. 2010;11:697–709. - PubMed
-
- Almany GR, Berumen ML, Thorrold SR, Planes S. Jones GP. Local replenishment of coral reef fish populations in a marine reserve. Science. 2007;316:742–744. - PubMed
-
- Almany GR, Hamilton RJ, Bode M, Matawai M, Potuku T, Saenz-Agudelo P, Planes S, et al. Dispersal of grouper larvae drives local resource sharing in a coral reef fishery. Current Biology. 2013;23:626–630. - PubMed
-
- Ansmann IC, Parra GJ, Lanyon JM. Seddon JM. Fine-scale genetic population structure in a mobile marine mammal: inshore bottlenose dolphins in Moreton Bay, Australia. Molecular Ecology. 2012;21:4472–4485. - PubMed
Publication types
LinkOut - more resources
Full Text Sources
Other Literature Sources
Miscellaneous
