. 2015:2015:250265.
doi: 10.1155/2015/250265. Epub 2015 Aug 20.

Fractal analysis and the diagnostic usefulness of silver staining nucleolar organizer regions in prostate adenocarcinoma

Affiliations

Fractal analysis and the diagnostic usefulness of silver staining nucleolar organizer regions in prostate adenocarcinoma

Alex Stepan et al. Anal Cell Pathol (Amst). 2015.

Abstract

Pathological diagnosis of prostate adenocarcinoma often requires complementary methods. On prostate biopsy tissue from 39 patients including benign nodular hyperplasia (BNH), atypical adenomatous hyperplasia (AAH), and adenocarcinomas, we have performed combined histochemical-immunohistochemical stainings for argyrophilic nucleolar organizer regions (AgNORs) and glandular basal cells. After ascertaining the pathology, we have analyzed the number, roundness, area, and fractal dimension of individual AgNORs or of their skeleton-filtered maps. We have optimized here for the first time a combination of AgNOR morphological denominators that would reflect best the differences between these pathologies. The analysis of AgNORs' roundness, averaged from large composite images, revealed clear-cut lower values in adenocarcinomas compared to benign and atypical lesions but with no differences between different Gleason scores. Fractal dimension (FD) of AgNOR silhouettes not only revealed significant lower values for global cancer images compared to AAH and BNH images, but was also able to differentiate between Gleason pattern 2 and Gleason patterns 3-5 adenocarcinomas. Plotting the frequency distribution of the FDs for different pathologies showed clear differences between all Gleason patterns and BNH. Together with existing morphological classifiers, AgNOR analysis might contribute to a faster and more reliable machine-assisted screening of prostatic adenocarcinoma, as an essential aid for pathologists.


Figures

Figure 1
Figure 1
Segmentation and binarisation of argyrophilic nucleolar organizer regions (AgNORs). Histochemical-immunohistochemical stainings have been performed for AgNORs (dark dots) and glandular basal cells (a cocktail of p63 and 34βE12, visualized in green), with a Nuclear Red counterstaining in order to ensure a good pathological classification of nodular benign nodular hyperplasia (a), atypical adenomatous hyperplasia (b), and acinar adenocarcinoma Gleason grades 2 (c), 3 (g), 4 (h), and 5 (i). Following segmentation, binary images of AgNORs substractions have been generated ((d)–(f) and (j)–(l)). Scale bar represents 100 μm.
Figure 2
Figure 2
Larger scan areas (24x 400x) utilized for segmentation and binarisation of argyrophilic nucleolar organizer regions (AgNORs). An area of benign nodular hyperplasia is shown ((a)-(b)). Scale bar represents 200 μm.
Figure 3
Figure 3
Example of binarisation and pruning filtering. After segmentation of original images ((a), (d)), argyrophilic nucleolar organizer regions (AgNORs) are binarised ((b), (e)) and then skeletons of the AgNOR dots are extracted ((c), (f)) in order to offer a quantifiable view of the glandular distribution of the dots. Scale bar represents 100 μm.
Figure 4
Figure 4
Morphometric assessment of argyrophilic nucleolar organizer regions (AgNORs). AgNORs, counted as average per epithelial cells' nuclei (a) or without discrimination for all the cells in the 40x area (b), show no difference between different pathologies. Roundness factor of the AgNOR dots on individual 40x images cannot account also for difference between pathologies ((c), (d)). Roundness factor of the AgNOR dots on collages, however, could differentiate each Gleason pattern from benign nodular hyperplasia (BNH) and atypical adenomatous hyperplasia (AAH) ((e), (f)). Averaged areas of AgNORs have a very limited value, being able to differentiate only AAH from Gleason patterns 4 and 5 ((g), (h)). Bars represent standard deviation. represents significance on corrected ANOVA testing.
Figure 5
Figure 5
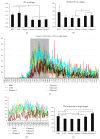
Testing different measurements for argyrophilic nucleolar organizer regions (AgNORs) for select epithelial, stromal, and complete 400x areas showed strong direct correlations between data coming from epithelia and complete tissue areas (r > 0.89 on Pearson testing).
Figure 6
Figure 6
Fractal analysis assessment of argyrophilic nucleolar organizer regions (AgNORs). Benign nodular hyperplasia (BNH), atypical adenomatous hyperplasia (AAH), and Gleason pattern 2 have significantly higher fractal dimensions (FDs) compared to Gleason patterns 3–5 (a). Skeleton reductions of the AgNORs could show significant differences only between Gleason patterns 2-3 group and Gleason patterns 4-5 group (b). Frequency distribution of FDs reveals global maxim values for the interval of 1.05–1.09 (c), and after plotting the average values for this narrowed interval, the filtered data revealed significant differences between BNH, AAH, Gleason patterns 2–4 group, and Gleason pattern 5 group ((d)-(e)). Bars represent standard deviation ((a), (b)) or standard errors of the means (e). represents significance on corrected ANOVA testing.

Similar articles

Cited by

References

    1. Jemal A., Bray F., Center M. M., Ferlay J., Ward E., Forman D. Global cancer statistics. CA: A Cancer Journal for Clinicians. 2011;61(2):69–90. doi: 10.3322/caac.20107. - DOI - PubMed
    1. Eble J. N., Sauter G., Epstein J. I., Sesterhenn I. A. Pathology and Genetics of Tumours of the Urinary System and Male Genital Organs. Lyon, France: IARC Press; 2008.
    1. Kwak J. T., Hewitt S. M., Sinha S., Bhargava R. Multimodal microscopy for automated histologic analysis of prostate cancer. BMC Cancer. 2011;11, article 62 doi: 10.1186/1471-2407-11-62. - DOI - PMC - PubMed
    1. Ferlay J., Steliarova-Foucher E., Lortet-Tieulent J., et al. Cancer incidence and mortality patterns in Europe: estimates for 40 countries in 2012. European Journal of Cancer. 2013;49(6):1374–1403. - PubMed
    1. Ferlay J., Shin H.-R., Bray F., Forman D., Mathers C., Parkin D. M. Estimates of worldwide burden of cancer in 2008: GLOBOCAN 2008. International Journal of Cancer. 2010;127(12):2893–2917. doi: 10.1002/ijc.25516. - DOI - PubMed

LinkOut - more resources