. 2015 Nov;47(11):1357-62.
doi: 10.1038/ng.3401. Epub 2015 Sep 14.

Population genetic differentiation of height and body mass index across Europe

Affiliations

Population genetic differentiation of height and body mass index across Europe

Matthew R Robinson et al. Nat Genet. 2015 Nov.

Abstract

Across-nation differences in the mean values for complex traits are common, but the reasons for these differences are unknown. Here we find that many independent loci contribute to population genetic differences in height and body mass index (BMI) in 9,416 individuals across 14 European countries. Using discovery data on over 250,000 individuals and unbiased effect size estimates from 17,500 sibling pairs, we estimate that 24% (95% credible interval (CI) = 9%, 41%) and 8% (95% CI = 4%, 16%) of the captured additive genetic variance for height and BMI, respectively, reflect population genetic differences. Population genetic divergence differed significantly from that in a null model (height, P < 3.94 × 10(-8); BMI, P < 5.95 × 10(-4)), and we find an among-population genetic correlation for tall and slender individuals (r = -0.80, 95% CI = -0.95, -0.60), consistent with correlated selection for both phenotypes. Observed differences in height among populations reflected the predicted genetic means (r = 0.51; P < 0.001), but environmental differences across Europe masked genetic differentiation for BMI (P < 0.58).


Conflict of interest statement

The authors declare no conflicts of interest pertaining to this study.

Figures

Figure 1
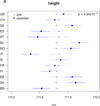
Figure 1. Observed divergence and predicted genetic divergence in height and body mass index (BMI) and height across 14 European nations
Across Europe, the observed means and predicted genetic means for height and BMI of 14 European nations are shown. From recently published data, we estimated national differences in mean height and BMI for 14 European nations accounting for time trends (Figure 1), with a European average height of 171.1 (95% CI: 169.6, 172.8) and average BMI of 25.0 (95% CI: 24.7, 25.3) across nations for males between the years 2000 and 2010.
Figure 2
Figure 2. Predicted genetic differentiation compared to the expectation under drift for height and body mass index across 14 European nations
Mean predicted genetic (blue) and null model (grey) values of 14 European nations are shown, with 95% credible intervals, for (a) height (cm) and (b) body mass index (BMI units). ISO2 country codes indicate each nation. The average p-value of differentiation from the null expectation is p<4.3e−14 for height and p<8.7e−07 for BMI. (c) Pattern of population co-differentiation of height and body mass index across 14 European nations (blue). The negative population genetic co-differentiation of −0.80 (95% CI: −0.95, −0.60) is represented by a blue ellipse.
Figure 3
Figure 3. Association between observed population means and predicted genetic population means for height and body mass index across 14 European nations
Predicted population genetic means and observed population means for (a) height and (b) body mass index (BMI). P values give the significance of the multivariate Pearson product moment correlation between the predicted population genetic means and the observed population means for both traits. For height, the correlation (r = 0.51; 95% CI 0.39, 0.61) was greater than that expected under the null model (r = 0.03, 95% CI −0.21, 0.17). For BMI, the correlation (r = −0.10, 95% CI −0.19, 0.01) was not significantly different from the null expectation (r = −0.08, 95% CI −0.24, 0.15).

Similar articles

  • Inference of the genetic architecture underlying BMI and height with the use of 20,240 sibling pairs.
    Hemani G, Yang J, Vinkhuyzen A, Powell JE, Willemsen G, Hottenga JJ, Abdellaoui A, Mangino M, Valdes AM, Medland SE, Madden PA, Heath AC, Henders AK, Nyholt DR, de Geus EJ, Magnusson PK, Ingelsson E, Montgomery GW, Spector TD, Boomsma DI, Pedersen NL, Martin NG, Visscher PM. Hemani G, et al. Am J Hum Genet. 2013 Nov 7;93(5):865-75. doi: 10.1016/j.ajhg.2013.10.005. Epub 2013 Oct 31. Am J Hum Genet. 2013. PMID: 24183453 Free PMC article.
  • Genome partitioning of genetic variation for complex traits using common SNPs.
    Yang J, Manolio TA, Pasquale LR, Boerwinkle E, Caporaso N, Cunningham JM, de Andrade M, Feenstra B, Feingold E, Hayes MG, Hill WG, Landi MT, Alonso A, Lettre G, Lin P, Ling H, Lowe W, Mathias RA, Melbye M, Pugh E, Cornelis MC, Weir BS, Goddard ME, Visscher PM. Yang J, et al. Nat Genet. 2011 Jun;43(6):519-25. doi: 10.1038/ng.823. Epub 2011 May 8. Nat Genet. 2011. PMID: 21552263 Free PMC article.
  • FTO genotype is associated with phenotypic variability of body mass index.
    Yang J, Loos RJ, Powell JE, Medland SE, Speliotes EK, Chasman DI, Rose LM, Thorleifsson G, Steinthorsdottir V, Mägi R, Waite L, Smith AV, Yerges-Armstrong LM, Monda KL, Hadley D, Mahajan A, Li G, Kapur K, Vitart V, Huffman JE, Wang SR, Palmer C, Esko T, Fischer K, Zhao JH, Demirkan A, Isaacs A, Feitosa MF, Luan J, Heard-Costa NL, White C, Jackson AU, Preuss M, Ziegler A, Eriksson J, Kutalik Z, Frau F, Nolte IM, Van Vliet-Ostaptchouk JV, Hottenga JJ, Jacobs KB, Verweij N, Goel A, Medina-Gomez C, Estrada K, Bragg-Gresham JL, Sanna S, Sidore C, Tyrer J, Teumer A, Prokopenko I, Mangino M, Lindgren CM, Assimes TL, Shuldiner AR, Hui J, Beilby JP, McArdle WL, Hall P, Haritunians T, Zgaga L, Kolcic I, Polasek O, Zemunik T, Oostra BA, Junttila MJ, Grönberg H, Schreiber S, Peters A, Hicks AA, Stephens J, Foad NS, Laitinen J, Pouta A, Kaakinen M, Willemsen G, Vink JM, Wild SH, Navis G, Asselbergs FW, Homuth G, John U, Iribarren C, Harris T, Launer L, Gudnason V, O'Connell JR, Boerwinkle E, Cadby G, Palmer LJ, James AL, Musk AW, Ingelsson E, Psaty BM, Beckmann JS, Waeber G, Vollenweider P, Hayward C, Wright AF, Rudan I, Groop LC, Metspalu A, Khaw KT, van Duijn CM, Borecki IB, Province MA, War… See abstract for full author list ➔ Yang J, et al. Nature. 2012 Oct 11;490(7419):267-72. doi: 10.1038/nature11401. Epub 2012 Sep 16. Nature. 2012. PMID: 22982992 Free PMC article.
  • Genome-wide genetic homogeneity between sexes and populations for human height and body mass index.
    Yang J, Bakshi A, Zhu Z, Hemani G, Vinkhuyzen AA, Nolte IM, van Vliet-Ostaptchouk JV, Snieder H; Lifelines Cohort Study; Esko T, Milani L, Mägi R, Metspalu A, Hamsten A, Magnusson PK, Pedersen NL, Ingelsson E, Visscher PM. Yang J, et al. Hum Mol Genet. 2015 Dec 20;24(25):7445-9. doi: 10.1093/hmg/ddv443. Epub 2015 Oct 22. Hum Mol Genet. 2015. PMID: 26494901
  • A population genetic interpretation of GWAS findings for human quantitative traits.
    Simons YB, Bullaughey K, Hudson RR, Sella G. Simons YB, et al. PLoS Biol. 2018 Mar 16;16(3):e2002985. doi: 10.1371/journal.pbio.2002985. eCollection 2018 Mar. PLoS Biol. 2018. PMID: 29547617 Free PMC article.

Cited by

References

    1. Moussavi S, et al. Depression, chronic diseases, and decrements in health: results from the World Health Surveys. Lancet. 2007;370:851–858. - PubMed
    1. Wild S, Roglic G, Green A, Sicree R, King H. Global Prevalence of Diabetes: Estimates for the year 2000 and projections for 2030. Diabetes Care. 2004;27:1047–1053. - PubMed
    1. Dye C. Global Burden of Tuberculosis: Estimated Incidence, Prevalence, and Mortality by Country. JAMA. 1999;282:677. - PubMed
    1. Lopez AD, Mathers CD, Ezzati M, Jamison DT, Murray CJL. Global and regional burden of disease and risk factors, 2001: systematic analysis of population health data. Lancet. 2006;367:1747–1757. - PubMed
    1. Wang H, et al. Age-specific and sex-specific mortality in 187 countries, 1970–2010: a systematic analysis for the Global Burden of Disease Study 2010. Lancet. 2012;380:2071–2094. - PubMed

Publication types

MeSH terms