. 2015 Dec;43(12):1031-1046.e12.
doi: 10.1016/j.exphem.2015.08.013. Epub 2015 Sep 11.

FANCA safeguards interphase and mitosis during hematopoiesis in vivo

Affiliations

FANCA safeguards interphase and mitosis during hematopoiesis in vivo

Zahi Abdul-Sater et al. Exp Hematol. 2015 Dec.

Abstract

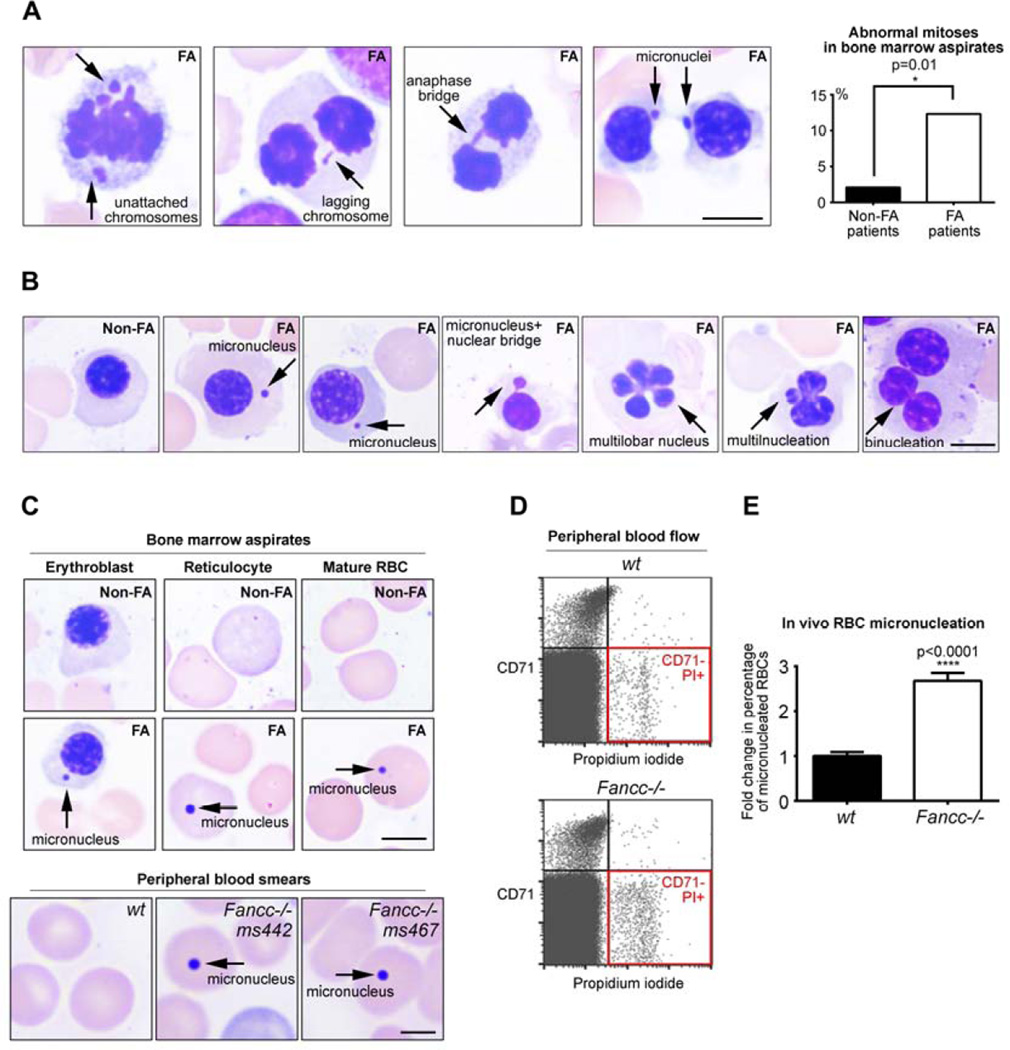
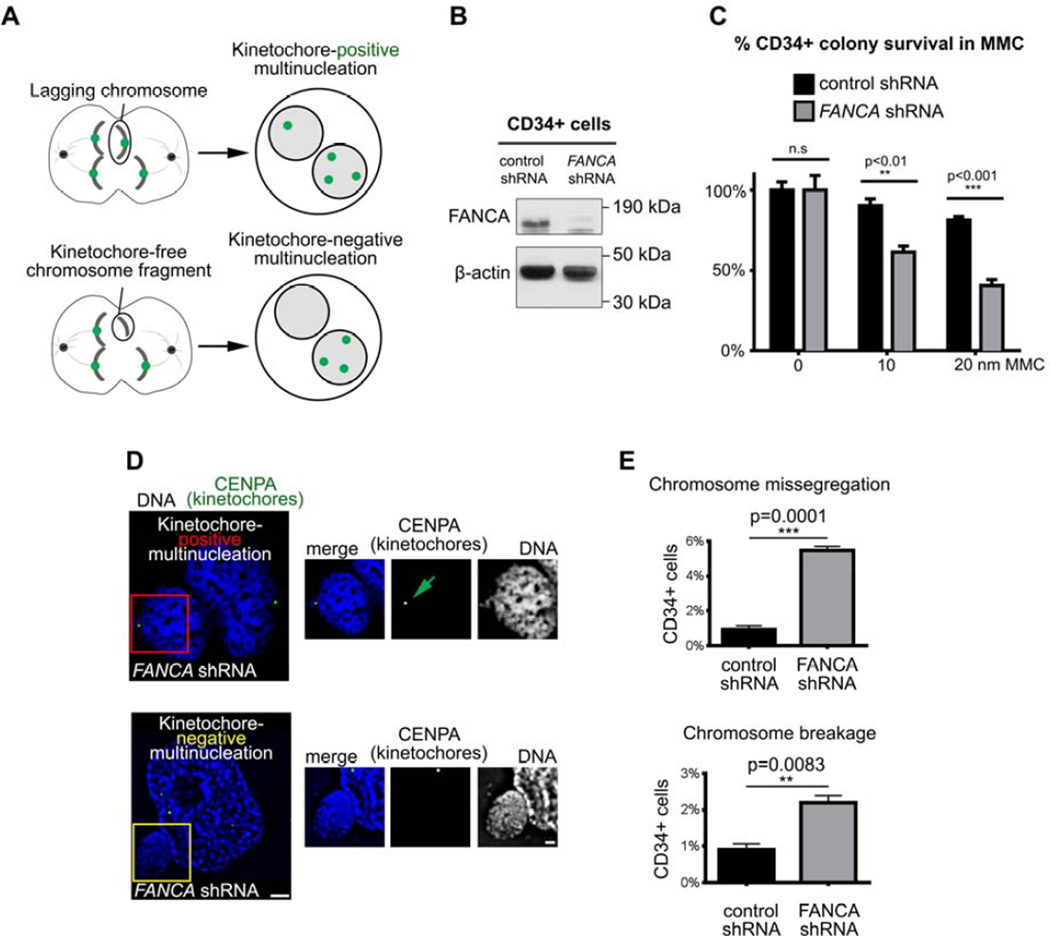
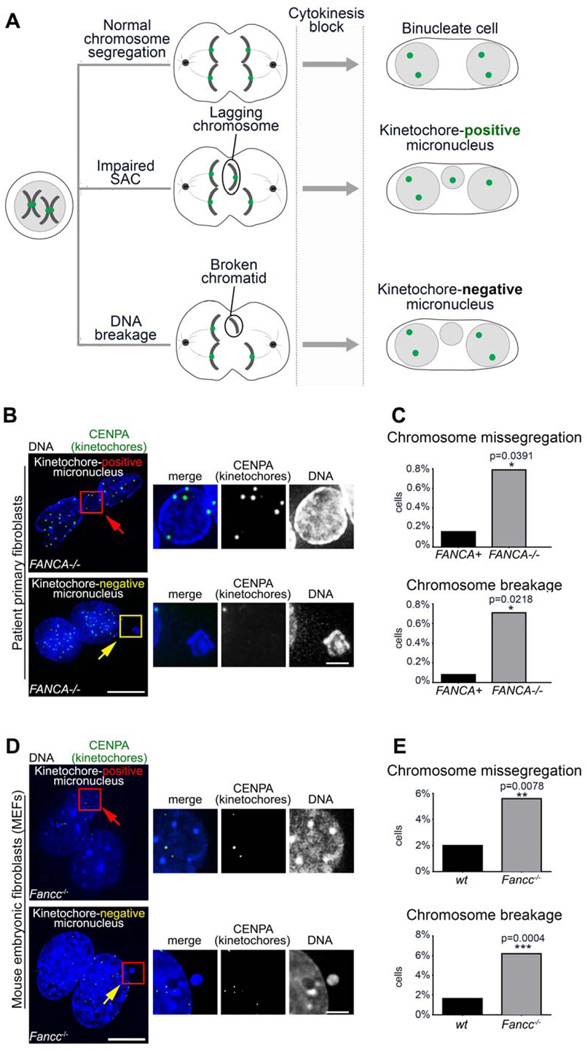
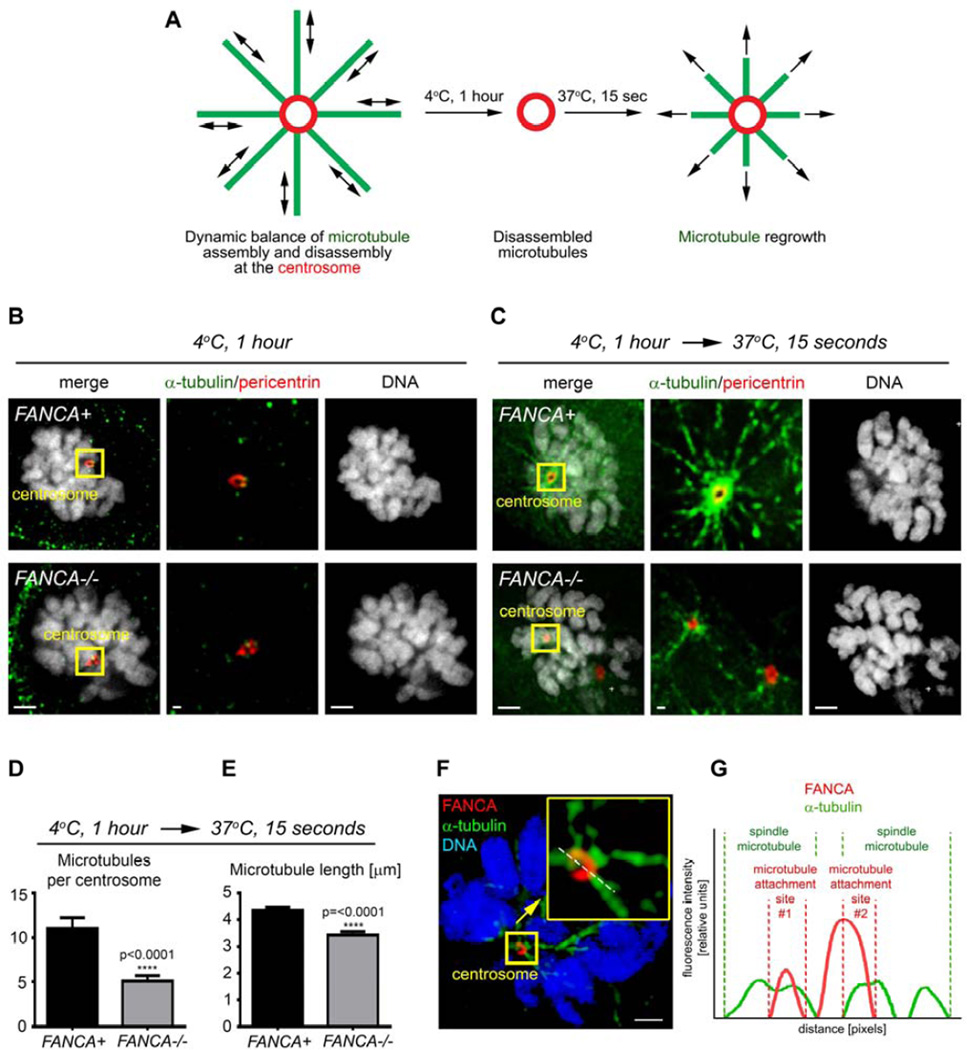
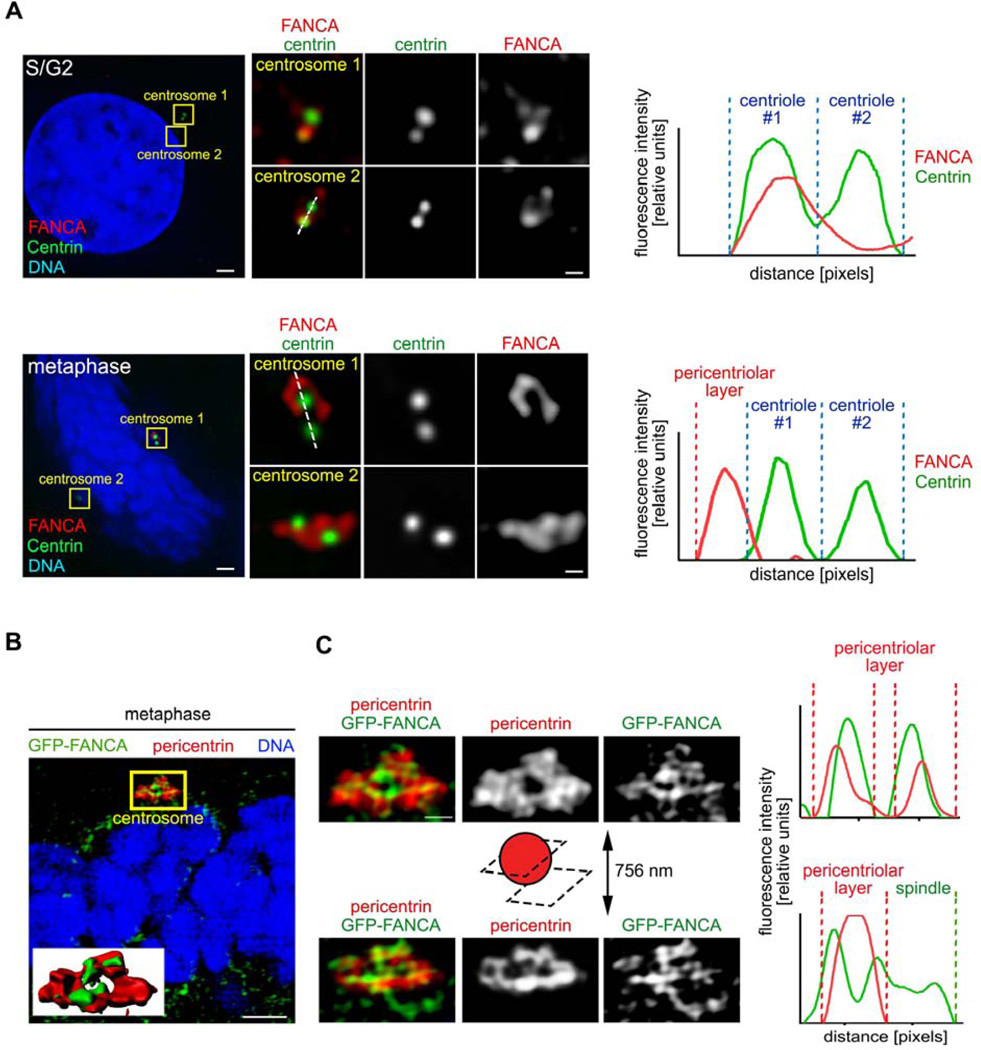
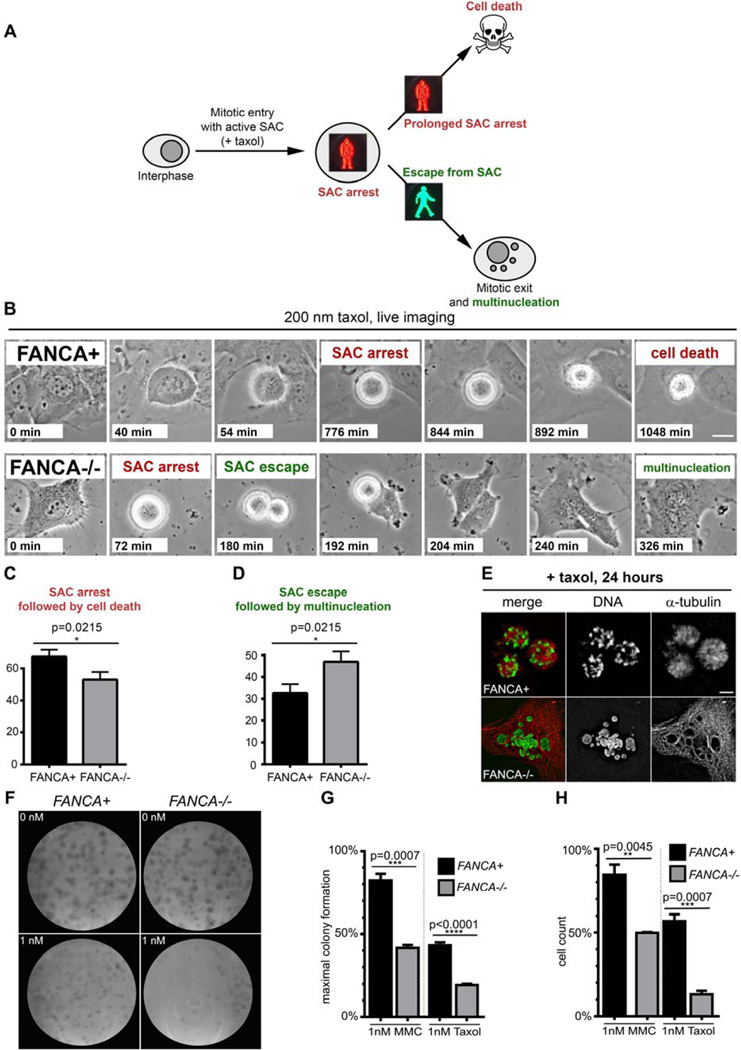
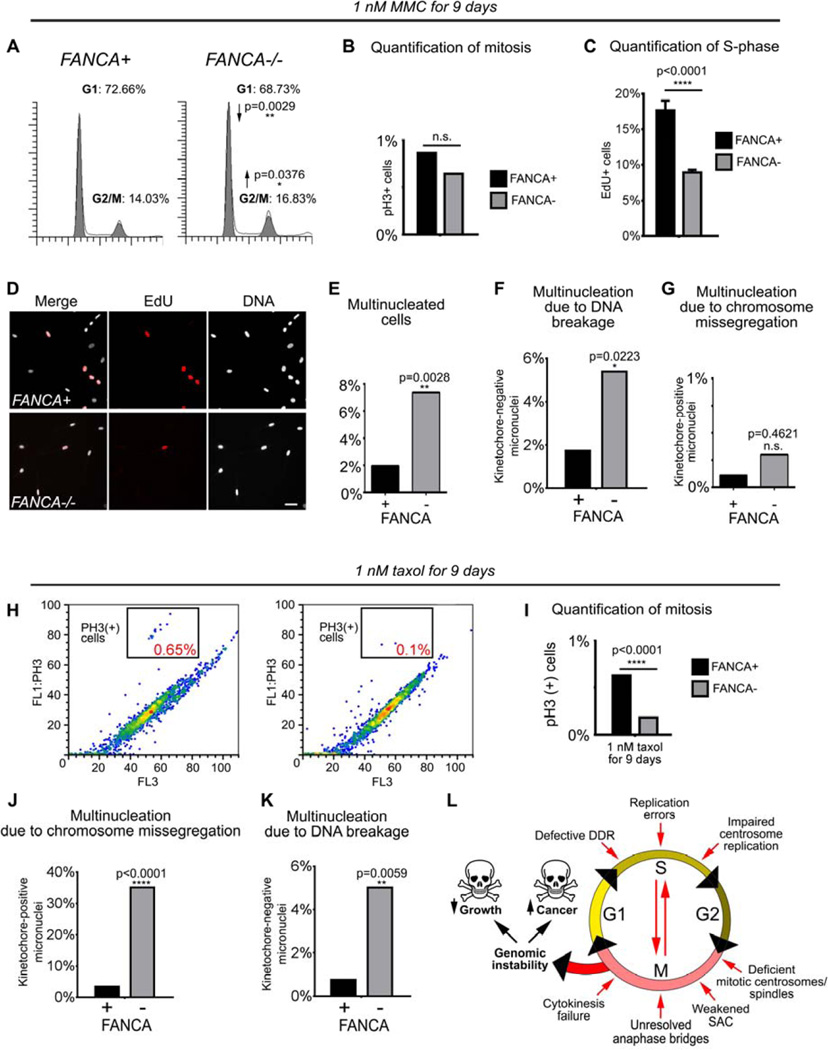
The Fanconi anemia (FA/BRCA) signaling network controls multiple genome-housekeeping checkpoints, from interphase DNA repair to mitosis. The in vivo role of abnormal cell division in FA remains unknown. Here, we quantified the origins of genomic instability in FA patients and mice in vivo and ex vivo. We found that both mitotic errors and interphase DNA damage significantly contribute to genomic instability during FA-deficient hematopoiesis and in nonhematopoietic human and murine FA primary cells. Super-resolution microscopy coupled with functional assays revealed that FANCA shuttles to the pericentriolar material to regulate spindle assembly at mitotic entry. Loss of FA signaling rendered cells hypersensitive to spindle chemotherapeutics and allowed escape from the chemotherapy-induced spindle assembly checkpoint. In support of these findings, direct comparison of DNA crosslinking and anti-mitotic chemotherapeutics in primary FANCA-/- cells revealed genomic instability originating through divergent cell cycle checkpoint aberrations. Our data indicate that FA/BRCA signaling functions as an in vivo gatekeeper of genomic integrity throughout interphase and mitosis, which may have implications for future targeted therapies in FA and FA-deficient cancers.


Conflict of interest statement

CONFLICT OF INTEREST DISCLOSURE

The authors declare that no conflicts of interest exist.

Figures

Figure 1
Figure 1. In vivo chromosomal instability and abnormal mitoses during human FANCA−/− and murine Fancc−/− hematopoiesis
(A) Representative abnormal mitoses in FANCA−/− patient bone marrow aspirates. Quantification (upper right) represents data from 2 different FA patients and 2 non-FA patients (96 mitoses in non-FA and 73 mitoses in FA; Fisher’s exact test). Scale bars: 5 µm. (B) Examples of abnormal interphase nuclear morphology in FANCA−/− patients’ hematopoietic cells that have undergone aberrant mitoses compared to a normal non-FA interphase erythroblast. Scale bars: 5 µm (C) Micronucleation of FANCA−/− bone marrow erythroblasts, reticulocytes and mature red blood cells (top) and Fancc−/− murine RBCs in peripheral blood (bottom). Scale bars: 5 µm (top); 2µm (bottom). (D) Increased frequency of CD71−, PI+ micronucleated mature RBCs in peripheral blood of 3-month-old Fancc−/− mice. (E) Quantification of micronucleated RBCs identified by flow cytometry is shown as fold change relative to wild-type levels. Bars indicate mean +/− SEM; >10 age-matched mice/genotype from multiple independent experiments were analyzed using a student’s t-test. All specimens were imaged with Zeiss Axiolab system equipped with an Axiocam 105 color camera.
Figure 2
Figure 2. FANCA maintains genomic integrity during interphase and mitosis in primary human CD34+ cells
(A) Assay schematic. Kinetochore/centrosome immunofluorescence staining distinguishes multinucleation generated through whole-chromosome missegregation from multinucleation resulting from DNA breakage. (B) FANCA shRNA efficiently knocks down FANCA protein in primary human CD34+ cells. β-actin serves as loading control. (C) Functional validation of FANCA shRNA in primary human CD34+ cells. FANCA shRNA renders CD34+ cells hypersensitive to mitomycin C compared to CD34+ cells compared with control shRNA. Error bars represent mean +/− SEM and significance was determined using a two-way ANOVA with Sidak correction. (D) Representative images of multinucleation resulting from FANCA knockdown in human CD34+ cells. Regions of interests are marked in red or yellow and enlarged on the right. Green arrow points to a CENPA-positive centromere/kinetochore within the supernumerary nucleus. Scale bars: 2µm (left) and 1µm (right) (E) Quantification of multinucleation resulting from weakened SAC or chromosome breakage in control and FANCA-knockdown CD34+ cells. At least 500 cells per group were counted. Results were analyzed using a student’s t-test and represented as mean +/− SEM.
Figure 3
Figure 3. Micronucleation upon loss of FA signaling results from a combination of interphase and mitotic errors
(A) Schematic of cytokinesis-block micronucleus test that discriminates the origin of aneuploidy based on the presence or absence of kinetochores within micronuclei. (B) Representative images of micronuclei in FANCA−/− primary patient fibroblasts. Scale bars: 10µm (left) and 2µm (right) (C) Quantification of micronuclei resulting from whole-chromosome missegregation versus chromosome breakage in primary FANCA−/− and FANCA+ fibroblasts. Error bars represent mean +/− SEM. (D) Representative images of micronuclei in Fancc−/− MEFs. Scale bars: 10µm (left) and 2µm (right) (E) Quantification of micronucleation resulting from chromosome missegregation and chromosome breakage in wt and Fancc−/− MEFs. At least 260 cells were counted per condition and significance was determined by student’s t-test. Cells were imaged with deconvolution microscopy (Applied Precision personalDx) and deconvolved with Softworx imaging suite (10 iterations, ratio: conservative).
Figure 4
Figure 4. Loss of FANCA disrupts spindle microtubule assembly at prometaphase centrosomes
(A) Experiment design. Microtubules of living FANCA−/− and FANCA+ cells were destabilized by cold treatment (4°C for 1 hour). Cells were then returned to 37°C to initiate microtubule reassembly and fixed with 4% paraformaldehyde 15 seconds later. (B) Cold treatment fully destabilizes microtubules in FANCA+ and FANCA−/− prometaphase cells. (C) Representative images of mitotic spindle assembly in FANCA+ and FANCA−/− prometaphase cells stained with anti-α-tubulin (green) and anti-pericentrin (red) antibodies. Images were captured with 60× lens on the Deltavision deconvolution microscope. Scale bars: 2µm (left and right) and 500nm (region of interest showed in the center). (D, E) Quantification of spindle microtubules per centrosome (D) and the microtubule length (µM) (E) in gene-corrected and FANCA−/− cells treated as described in (A). Data represents 2 independent experiments (n=130 microtubules/experiment), and error bars represent SEM. (E) Representative mitotic HeLa cell stained with anti-FANCA (red) and anti-α-tubulin (green) antibodies, imaged on an ELYRA PS.1 super-resolution microscope using SIM technology. Insert shows enlarged centrosome-containing region of interest. White line shows the line of fluorescence intensity profile. Scale bar: 2µm. Cells were imaged with deconvolution microscopy (Applied Precision personalDx) and deconvolved with Softworx imaging suite (10 iterations, ratio: conservative). (F) Fluorescence intensity profiles of FANCA (red) and α-tubulin (green) signal.
Figure 5
Figure 5. FANCA shuttles to the pericentriolar material during mitosis
(A) HeLa cells were immunostained with antibodies against endogenous FANCA (red) and centrin (green), imaged with deconvolution microscopy (Applied Precision personalDx) and deconvolved with Softworx imaging suite (10 iterations, ratio: conservative). Fluorescence intensity profiles demonstrate that FANCA colocalizes with centrin in interphase and migrates away from centrioles at metaphase. Scale bars: 1.5 µm (left) and 300 nm (right) (B) Representative super-resolution image of human fibroblast stably expressing GFP-FANCA and stained with antibody against the pericentriolar material marker (pericentrin). Inserted 3D rendering of the centrosome shows colocalization of GFP-FANCA and pericentrin. Scale bars: 2 µm. The yellow region of interest is magnified (C) to show FANCA fibers embedded within the PCM (centrosome cross-section) and extending towards the spindle (centrosome outer layer section). Fluorescence intensity profiles (right) of GFP-FANCA/pericentrin signal at PCM and spindle are shown on the right. Scale bar: 500 nm. SR-SIM images were acquired on Zeiss ELYRA PS.1 super-resolution microscopy system and exported using Imaris imaging suite.
Figure 6
Figure 6. Loss of FANCA promotes escape from SAC and is synthetic lethal with low-dose taxol exposure
(A) Assay schematic. Prolonged activation of SAC triggers cell death to prevent genomic instability by eliminating cells that cannot satisfy the checkpoint. Escape from SAC followed by erratic chromosome segregation and mitotic exit generates multinucleated cells. (B) Representative time-lapse imaging snapshots of FANCA+ and FANCA−/− cells exposed to taxol. Note prolonged SAC arrest followed by cell death in gene-corrected cell and escape for SAC followed by cytokinesis failure and multinucleation in FANCA−/− cell. Scale bar: 15 µm. Time from mitotic entry is shown for each frame. Time-lapse phase-contrast frames of cells grown in DMSO supplemented with 10% FBS at 37°C, 5% CO2 were acquired every 2 minutes for at least 24 hours on a Nikon Biostation live-imaging system (C, D) Quantification of time-lapse imaging experiments. FANCA−/− cells are more likely to escape SAC and less likely to be eliminated through SAC-associated death compared to gene-corrected isogenic cells (p=0.0215). Data for 115 mitotic FANCA+ cells and 129 mitotic FANCA−/− cells (three experimental replicates for each cell line) were analyzed with two-tailed t-test. See Supplemental Movies 1–2. (E) Prolonged prometaphase arrest in FANCA+ cells and multinucleation in FANCA−/− cells upon 24-hour exposure to taxol in an independent experiment. Images acquired on an Applied Precision personalDx deconvolution microscope. (F) Representative colony-forming (CFU) assay plates. Primary FANCA−/− fibroblasts and FANCA”+ fibroblasts (500 cells per 10 cm2 plate) were exposed to taxol for 11 days. Note decreased colony formation on FANCA−/− plates exposed to 1 nM of taxol. (G) Quantification of the CFU assay shown in (F). FANCA−/− cells are more sensitive to 1 nM taxol than FANCA+ cells in the CFU assay. 1 nM MMC was used as positive control. (H) Direct cell counts confirm that stable expression of FANCA rescues both taxol and MMC hypersensitivity of FANCA−/− patient cells. Two-way ANOVA with Sidak correction was used for data comparison. Data show pooled results of three separate experiments, expressed as the mean ± SEM in triplicates.
Figure 7
Figure 7. FANCA−/− cells exposed to genotoxic stressors develop genomic instability through a combination of interphase and mitotic checkpoint abnormalities
(A) Prolonged activation of the G2/M checkpoint in FANCA−/− cells grown in low-dose MMC for 9 days. (B) No difference in mitotic cell fraction between MMC-treated FANCA−/− and FANCA+ cells indicates that the increased FANCA−/− G2/M fraction shown in (A) reflects G2 arrest prior to mitotic entry. (C, D) DNA replication arrest in FANCA−/− cells exposed to 1 nM MMC is rescued by FANCA gene correction. S-phase cells were labeled red by EdU incorporation. (E, F, G) Increased multinucleation due to DNA breakage, but not chromosome missegregation, in FANCA−/− cells grown in low-dose MMC. (H, I) Flow cytometry shows decreased fraction of mitotic cells in FANCA−/− cells exposed to sublethal dose of taxol. (J, K) Treatment with taxol increases chromosome segregation errors and chromosome breakage in FANCA−/− cells. (L) Compound interphase and mitotic origins of genomic instability in FA-deficient cells (see text for discussion). Exponential accumulation of DNA damage may result in activation of cell cycle arrest/apoptosis (bone marrow failure) or malignant transformation (leukemia and solid tumors). All flow cytometry data represent pooled 3 replicates for each cell line and condition compared with two-tailed t-test. EdU incorporation counts were compared via two-way ANOVA with Sidak’s multiple comparisons test.

References

    1. Kottemann MC, Smogorzewska A. Fanconi anaemia and the repair of Watson and Crick DNA crosslinks. Nature. 2013;493(7432):356–363. - PMC - PubMed
    1. Rosenberg PS, Alter BP, Ebell W. Cancer risks in Fanconi anemia: findings from the German Fanconi Anemia Registry. Haematologica. 2008;93(4):511–517. - PubMed
    1. Alter BP, Giri N, Savage SA, et al. Malignancies and survival patterns in the National Cancer Institute inherited bone marrow failure syndromes cohort study. Br J Haematol. 2010;150(2):179–188. - PMC - PubMed
    1. Alter BP. Fanconi anemia and the development of leukemia. Best Pract Res Clin Haematol. 2014;27(3–4):214–221. - PMC - PubMed
    1. D'Andrea AD. Susceptibility pathways in Fanconi's anemia and breast cancer. N Engl J Med. 2010;362(20):1909–1919. - PMC - PubMed

Publication types

Substances

LinkOut - more resources