

Re-assess Vector Indices Threshold as an Early Warning Tool for Predicting Dengue Epidemic in a Dengue Non-endemic Country
- PMID: 26366874
- PMCID: PMC4569482
- DOI: 10.1371/journal.pntd.0004043
Re-assess Vector Indices Threshold as an Early Warning Tool for Predicting Dengue Epidemic in a Dengue Non-endemic Country
Abstract
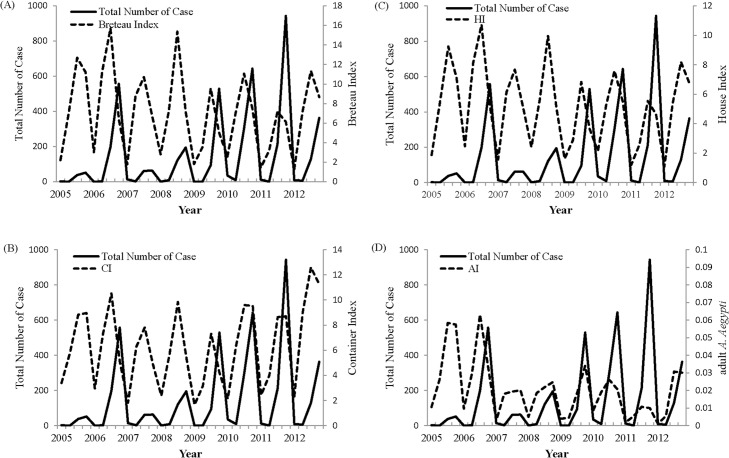
Background: Despite dengue dynamics being driven by complex interactions between human hosts, mosquito vectors and viruses that are influenced by climate factors, an operational model that will enable health authorities to anticipate the outbreak risk in a dengue non-endemic area has not been developed. The objectives of this study were to evaluate the temporal relationship between meteorological variables, entomological surveillance indices and confirmed dengue cases; and to establish the threshold for entomological surveillance indices including three mosquito larval indices [Breteau (BI), Container (CI) and House indices (HI)] and one adult index (AI) as an early warning tool for dengue epidemic.
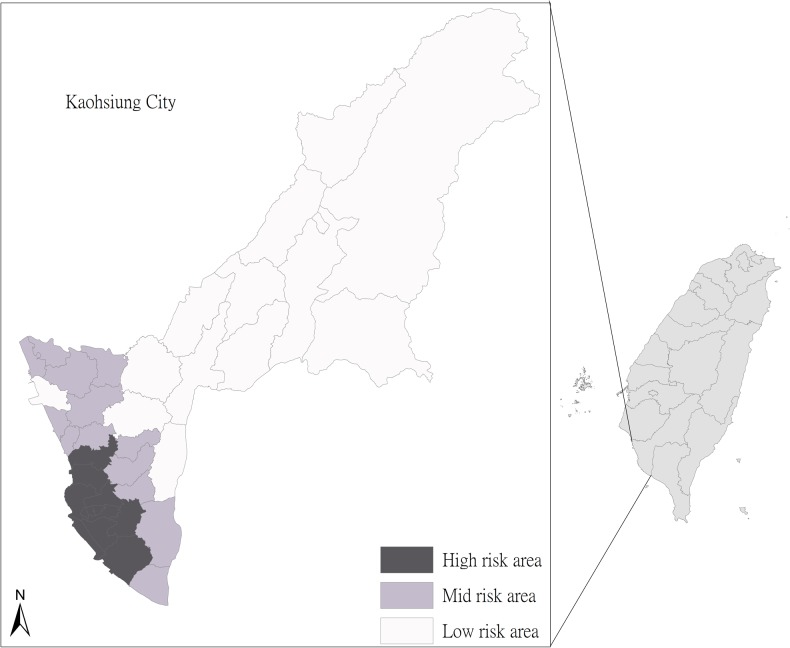
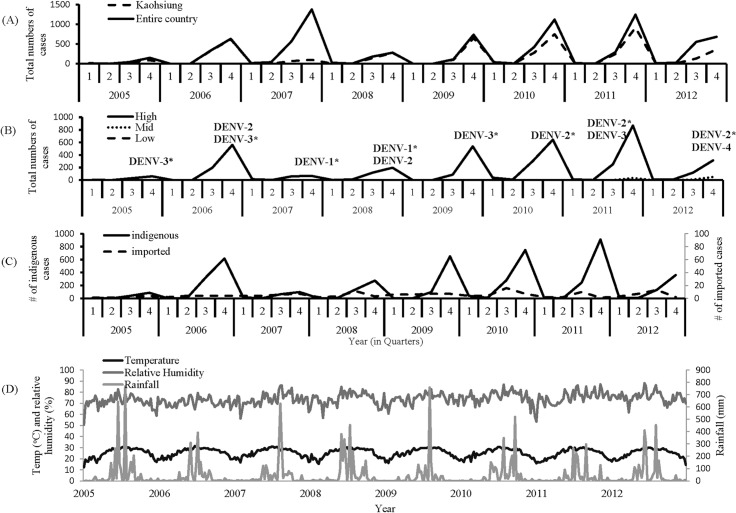
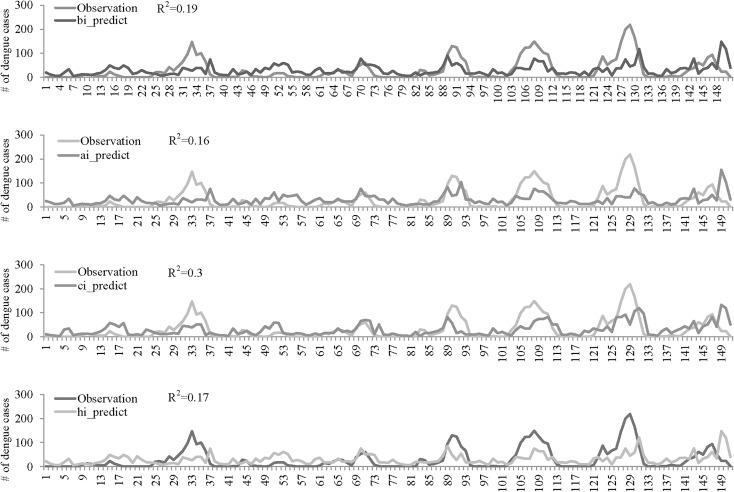
Methodology/principal findings: Epidemiological, entomological and meteorological data were analyzed from 2005 to 2012 in Kaohsiung City, Taiwan. The successive waves of dengue outbreaks with different magnitudes were recorded in Kaohsiung City, and involved a dominant serotype during each epidemic. The annual indigenous dengue cases usually started from May to June and reached a peak in October to November. Vector data from 2005-2012 showed that the peak of the adult mosquito population was followed by a peak in the corresponding dengue activity with a lag period of 1-2 months. Therefore, we focused the analysis on the data from May to December and the high risk district, where the inspection of the immature and mature mosquitoes was carried out on a weekly basis and about 97.9% dengue cases occurred. The two-stage model was utilized here to estimate the risk and time-lag effect of annual dengue outbreaks in Taiwan. First, Poisson regression was used to select the optimal subset of variables and time-lags for predicting the number of dengue cases, and the final results of the multivariate analysis were selected based on the smallest AIC value. Next, each vector index models with selected variables were subjected to multiple logistic regression models to examine the accuracy of predicting the occurrence of dengue cases. The results suggested that Model-AI, BI, CI and HI predicted the occurrence of dengue cases with 83.8, 87.8, 88.3 and 88.4% accuracy, respectively. The predicting threshold based on individual Model-AI, BI, CI and HI was 0.97, 1.16, 1.79 and 0.997, respectively.
Conclusion/significance: There was little evidence of quantifiable association among vector indices, meteorological factors and dengue transmission that could reliably be used for outbreak prediction. Our study here provided the proof-of-concept of how to search for the optimal model and determine the threshold for dengue epidemics. Since those factors used for prediction varied, depending on the ecology and herd immunity level under different geological areas, different thresholds may be developed for different countries using a similar structure of the two-stage model.
Conflict of interest statement
The authors have declared that no competing interests exist.
Figures
Similar articles
-
Climate-based models for understanding and forecasting dengue epidemics.PLoS Negl Trop Dis. 2012;6(2):e1470. doi: 10.1371/journal.pntd.0001470. Epub 2012 Feb 14. PLoS Negl Trop Dis. 2012. PMID: 22348154 Free PMC article.
-
Identification of Aedes albopictus larval index thresholds in the transmission of dengue in Guangzhou, China.J Vector Ecol. 2015 Dec;40(2):240-6. doi: 10.1111/jvec.12160. J Vector Ecol. 2015. PMID: 26611957
-
The Critical Role of Early Dengue Surveillance and Limitations of Clinical Reporting - Implications for Non-Endemic Countries.PLoS One. 2016 Aug 8;11(8):e0160230. doi: 10.1371/journal.pone.0160230. eCollection 2016. PLoS One. 2016. PMID: 27501302 Free PMC article.
-
Discriminable roles of Aedes aegypti and Aedes albopictus in establishment of dengue outbreaks in Taiwan.Acta Trop. 2014 Feb;130:17-23. doi: 10.1016/j.actatropica.2013.10.013. Epub 2013 Oct 23. Acta Trop. 2014. PMID: 24161880 Review.
-
[Prediction and prevention of dengue epidemics].Bull Soc Pathol Exot. 1996;89(2):123-6; discussion 127. Bull Soc Pathol Exot. 1996. PMID: 8924770 Review. French.
Cited by
-
Utility of entomological indices for predicting transmission of dengue virus: secondary analysis of data from the Camino Verde trial in Mexico and Nicaragua.PLoS Negl Trop Dis. 2020 Oct 26;14(10):e0008768. doi: 10.1371/journal.pntd.0008768. eCollection 2020 Oct. PLoS Negl Trop Dis. 2020. PMID: 33104693 Free PMC article.
-
Location, seasonal, and functional characteristics of water holding containers with juvenile and pupal Aedes aegypti in Southern Taiwan: A cross-sectional study using hurdle model analyses.PLoS Negl Trop Dis. 2018 Oct 15;12(10):e0006882. doi: 10.1371/journal.pntd.0006882. eCollection 2018 Oct. PLoS Negl Trop Dis. 2018. PMID: 30321168 Free PMC article.
-
Taxonomy for citizen actions on public health and climate change: a proposal.Rev Saude Publica. 2022 Jan 5;55:119. doi: 10.11606/s1518-8787.2021055003823. eCollection 2022. Rev Saude Publica. 2022. PMID: 35019053 Free PMC article.
-
Relationships between traditional larval indices and meteorological factors with the adult density of Aedes albopictus captured by BG-mosquito trap.PLoS One. 2020 Jun 11;15(6):e0234555. doi: 10.1371/journal.pone.0234555. eCollection 2020. PLoS One. 2020. PMID: 32525905 Free PMC article.
-
Defining the Risk of Zika and Chikungunya Virus Transmission in Human Population Centers of the Eastern United States.PLoS Negl Trop Dis. 2017 Jan 17;11(1):e0005255. doi: 10.1371/journal.pntd.0005255. eCollection 2017 Jan. PLoS Negl Trop Dis. 2017. PMID: 28095405 Free PMC article.
References
-
- Sangkawibha N, Rojanasuphot S, Ahandrik S, Viriyapongse S, Jatanasen S, et al. (1984) Risk factors in dengue shock syndrome: a prospective epidemiologic study in Rayong, Thailand. I. The 1980 outbreak. Am J Epidemiol 120: 653–669. - PubMed
Publication types
MeSH terms
LinkOut - more resources
Full Text Sources
Other Literature Sources
Medical
