. 2015 Sep 14;11(9):e1004346.
doi: 10.1371/journal.pcbi.1004346. eCollection 2015 Sep.

The Internal Dynamics of Fibrinogen and Its Implications for Coagulation and Adsorption

Affiliations

The Internal Dynamics of Fibrinogen and Its Implications for Coagulation and Adsorption

Stephan Köhler et al. PLoS Comput Biol. .

Abstract

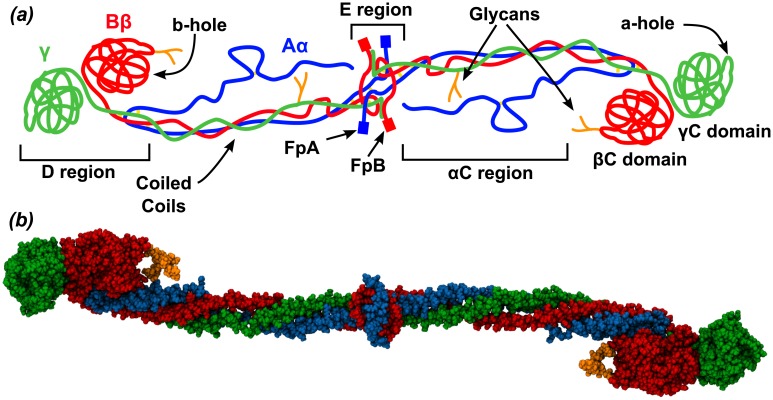
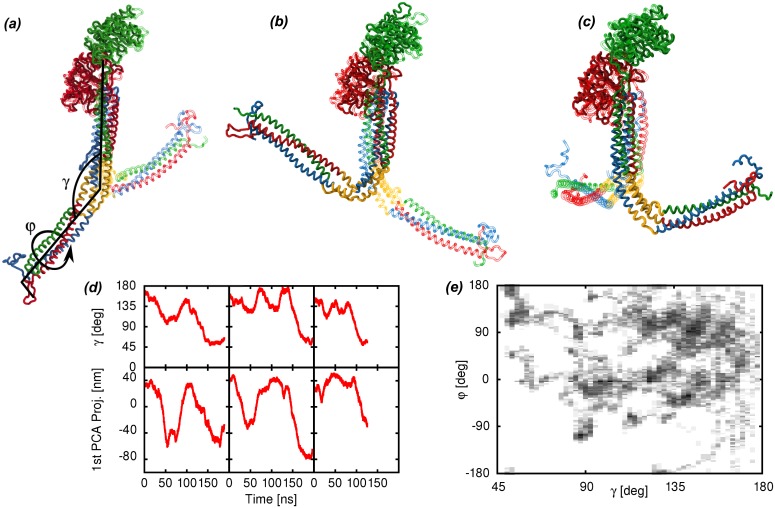
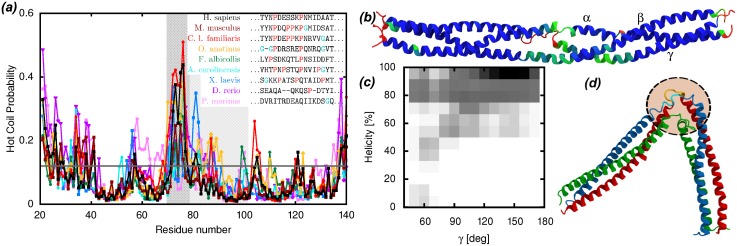
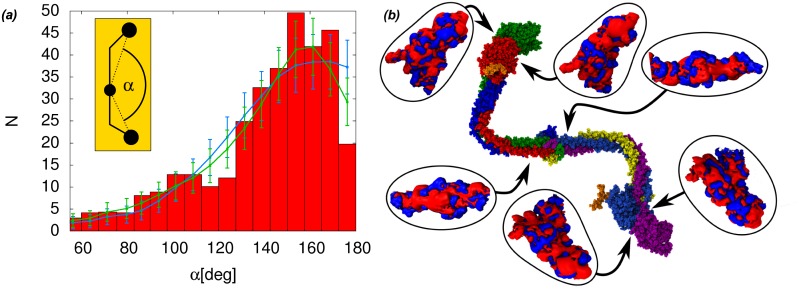
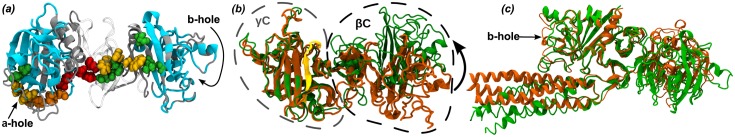
Fibrinogen is a serum multi-chain protein which, when activated, aggregates to form fibrin, one of the main components of a blood clot. Fibrinolysis controls blood clot dissolution through the action of the enzyme plasmin, which cleaves fibrin at specific locations. Although the main biochemical factors involved in fibrin formation and lysis have been identified, a clear mechanistic picture of how these processes take place is not available yet. This picture would be instrumental, for example, for the design of improved thrombolytic or anti-haemorrhagic strategies, as well as, materials with improved biocompatibility. Here, we present extensive molecular dynamics simulations of fibrinogen which reveal large bending motions centered at a hinge point in the coiled-coil regions of the molecule. This feature, likely conserved across vertebrates according to our analysis, suggests an explanation for the mechanism of exposure to lysis of the plasmin cleavage sites on fibrinogen coiled-coil region. It also explains the conformational variability of fibrinogen observed during its adsorption on inorganic surfaces and it is supposed to play a major role in the determination of the hydrodynamic properties of fibrinogen. In addition the simulations suggest how the dynamics of the D region of fibrinogen may contribute to the allosteric regulation of the blood coagulation cascade through a dynamic coupling between the a- and b-holes, important for fibrin polymerization, and the integrin binding site P1.


Conflict of interest statement

The authors have declared that no competing interests exist.

Figures

Fig 1
Fig 1. The fibrinogen molecule.
(a) Schematic representation of the fibrinogen molecule. The three chains of Fg, Aα, Bβ and γ are shown in blue, red and green, respectively. (b) Van der Waals representation of the crystallographic structure (pdb 3GHG) of Fg, color coded as in (a). Carbohydrates are in orange. The αC region and the FpA and FpB peptides were not resolved in the crystal structure.
Fig 2
Fig 2. Characterization of the large bending motions of fibrinogen.
(a)(c) Dominant PCA modes of the Fg protomer with the hinge region highlighted in yellow (chains colored according to Fig 1). For each PCA mode, the two structures with the largest (solid) and smallest (transparent) projection along the PCA mode are represented. An illustration of the bending angle γ and the torsion angle φ is superimposed to the first PCA mode. The three groups of atoms used to define the γ angle are the E region (α50–58, β82–90, γ23–31), the hinge region (α99–110, β130–155, γ70–100) and the D region (β200–458, γ140–394). The four groups of atoms used to define the φ are one part of the E region (α50–58, γ23–31), another part of the E region (β82–90, γ23–31), the hinge region (α99–110, β130–155, γ70–100) and the D region (β200–458, γ140–394)(d) Time series of the γ angle and of the projection of the trajectories along the first PCA component from selected simulation runs. The plots show both the reversibility of the motion and the time scale along which it occurs. (e) Distribution of the bending angle γ and dihedral angle φ around the hinge of the Fg protomer as observed in the present simulations. The elongated conformation of Fg observed in the crystals correspond to a γ angle close to 160°.
Fig 3
Fig 3. Functional role of the bending motions in the coiled-coil region of fibrinogen.
(a) DisEMBL “hot coil” predictions for the sequences of the γ chain from several vertebrates, highlighting the fact that the flexibility of the non-helical loop is a conserved feature. The hinge region is shaded and, within that region, the non-helical loop segment is dark shaded. The inset legend reports the sequence alignment of the non-helical loop region across the same vertebrates, highlighting the content of glycine and proline residues. (b) Cartoon representation of the coiled-coil region of Fg colored according to the fraction of the simulation time spent in an α-helical conformation (red = 0, green = 0.85, blue = 1). The N-termini of the segments are on the left. The regions with lower helical fraction are in good agreement with regions with lower protection factors as determined in H/D exchange experiments [29]. (c) Probability distribution of the fraction of helical residues around the Aα104–105 and Bβ133–134 plasmin cleavage sites as a function of the bending angle γ. Dark shades correspond to high probability. The three residues preceding and following the cleavage sites (i.e., Aα102–107 and Bβ131–136) have been included in the calculation of the helicity. Larger bending (lower γ angle) correlates with lower helical content. (d) Snapshot of the conformation of the bent coiled-coil region (chains colored as in Fig 1) showing the disrupted secondary structure around the plasmin cleavage sites (rendered yellow and cyan inside the dashed circle).
Fig 4
Fig 4. Modelling of fibrinogen adsorption on mica and electrostatic analysis.
(a) The independent hinge model (blue line, χ 2 = 1.55) and the general model (green line, χ 2 = 1.0) for Fg flexibility upon adsorption are fitted to the experimental data (red histograms) of the distribution of the α angle in the tri-nodular structures observed by AFM measurements of Fg adsorbed on mica [7]. The error bars on the fit are equal to the square root of the expected count number N in each bin (i.e. assuming a poissonian distribution in each bin). The inset shows the definition of α on the simplified Fg model. (b) Typical bent conformation of the fibrinogen dimer with the electrostatic potential at D- and E-regions, highlighting the presence of a large negatively charged patch on one side of the surface of the D region. Drawn are the isosurfaces at ±26.7mV (blue/red).
Fig 5
Fig 5. Dynamics in the D region of fibrinogen.
(a) Visualization of the ensemble of pathways of correlated motion connecting the a- and the b-hole at the two ends of the D region. Pathways connecting all residues in the gray regions have been considered, but only the residues in the blue regions can be actually connected. Residues are colored according to the fraction of pathways they belong to, from red (100%) to green (25%). Thus, all correlated motions occurring at the two ends of the D region involve the residues colored in red. (b) Structures of the D region with the largest (orange) and smallest (green) projection along the largest PCA mode. The picture shows the cleft hosting the P1 integrin binding site (in yellow). The two projections can be associated with the open (orange) and closed (green) state of the cleft, and help elucidating how dynamics in the D region may affect binding. (c) Structures of the D region and the C-terminal segment of the coiled-coil region (residues α125–189, β155–458 and γ100–394) with the largest and smallest projection along the second largest PCA mode. The picture shows how the opening of the b-hole, indicated by the arrow, is coordinated to the shift of the coiled-coil region away from the βC domain.
Fig 6
Fig 6. A simplified model of fibrinogen adsorption.
(a) Simplified model of fibrinogen flexibility. The hinge bending angles (γ 1, φ 1, γ 2 and φ 2) represent the only degrees of freedom of the molecule in this representation. The geometrical parameters are determined from the crystal structure of Fg. (b) 2D projection of the model as seen in AFM experiments.

Similar articles

Cited by

References

    1. Weisel JW. Structure of fibrin: impact on clot stability. J Thromb Haemost. 2007. July;5 Suppl 1:116–124. 10.1111/j.1538-7836.2007.02504.x - DOI - PubMed
    1. Takagi T, Doolittle RF. Amino acid sequence studies on the α chain of human fibrinogen. Location of four plasmin attack points and a covalent cross-linking site. Biochemistry. 1975;14(23):5149–5156. 10.1021/bi00694a020 - DOI - PubMed
    1. Takagi T, Doolittle RF. Amino acid sequence studies on plasmin-derived fragments of human fibrinogen. Amino-terminal sequences of intermediate and terminal fragments. Biochemistry. 1975;14(5):940–946. 10.1021/bi00676a010 - DOI - PubMed
    1. Mihalyi E. Kinetics and molecular mechanism of the proteolytic fragmentation of fibrinogen. Ann NY Acad Sci. 1983. June;408:60–70. 10.1111/j.1749-6632.1983.tb23234.x - DOI - PubMed
    1. Kollman J, Pandi L, Sawaya M, Riley M, Doolittle R. Crystal Structure of Human Fibrinogen. Biochemistry. 2009;48:3877–3886. 10.1021/bi802205g - DOI - PubMed

Publication types

LinkOut - more resources