. 2015 Sep 14;10(9):e0137915.
doi: 10.1371/journal.pone.0137915. eCollection 2015.

Sparse Spectro-Temporal Receptive Fields Based on Multi-Unit and High-Gamma Responses in Human Auditory Cortex

Affiliations

Sparse Spectro-Temporal Receptive Fields Based on Multi-Unit and High-Gamma Responses in Human Auditory Cortex

Rick L Jenison et al. PLoS One. .

Abstract

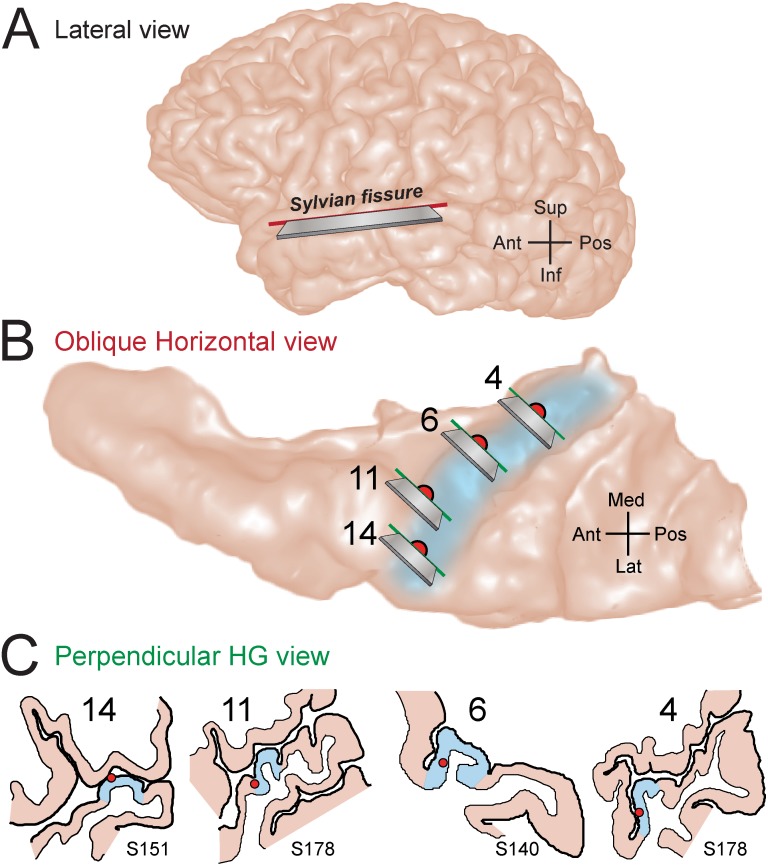
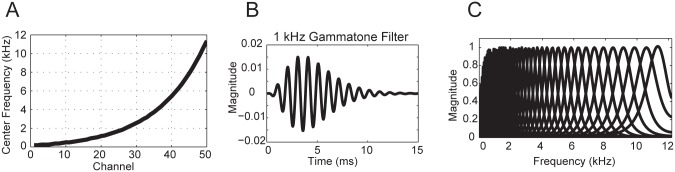
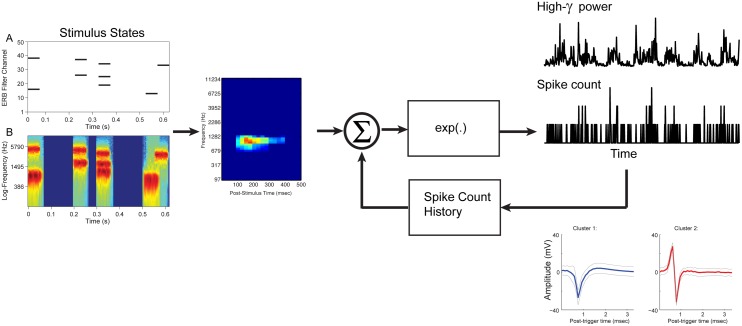
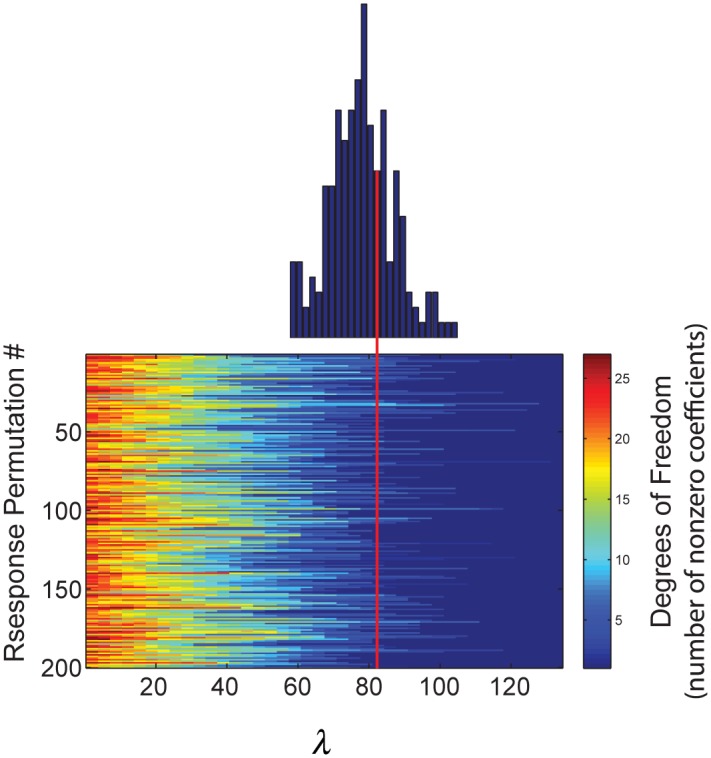
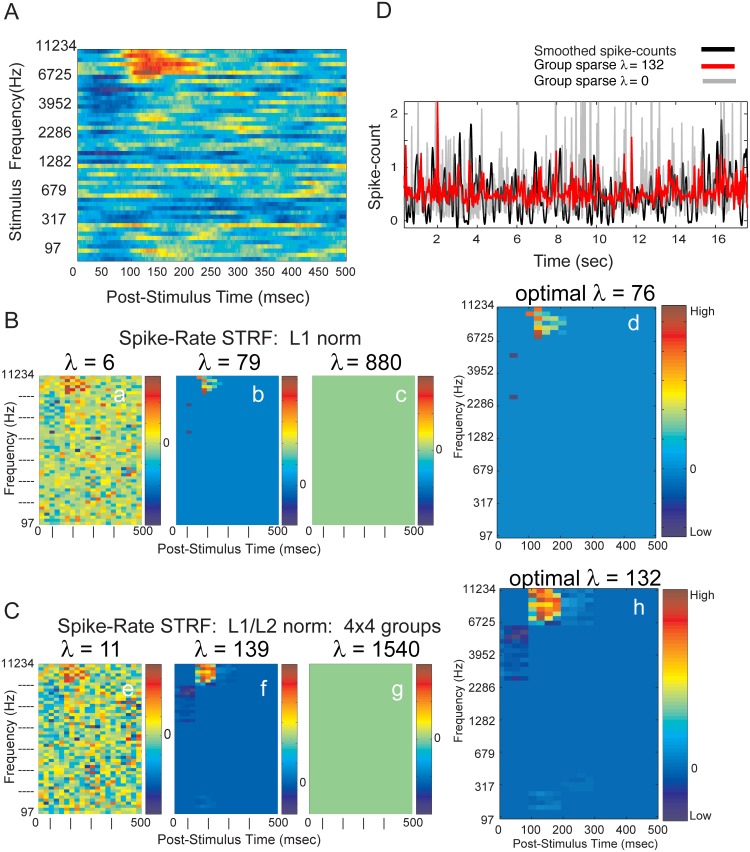
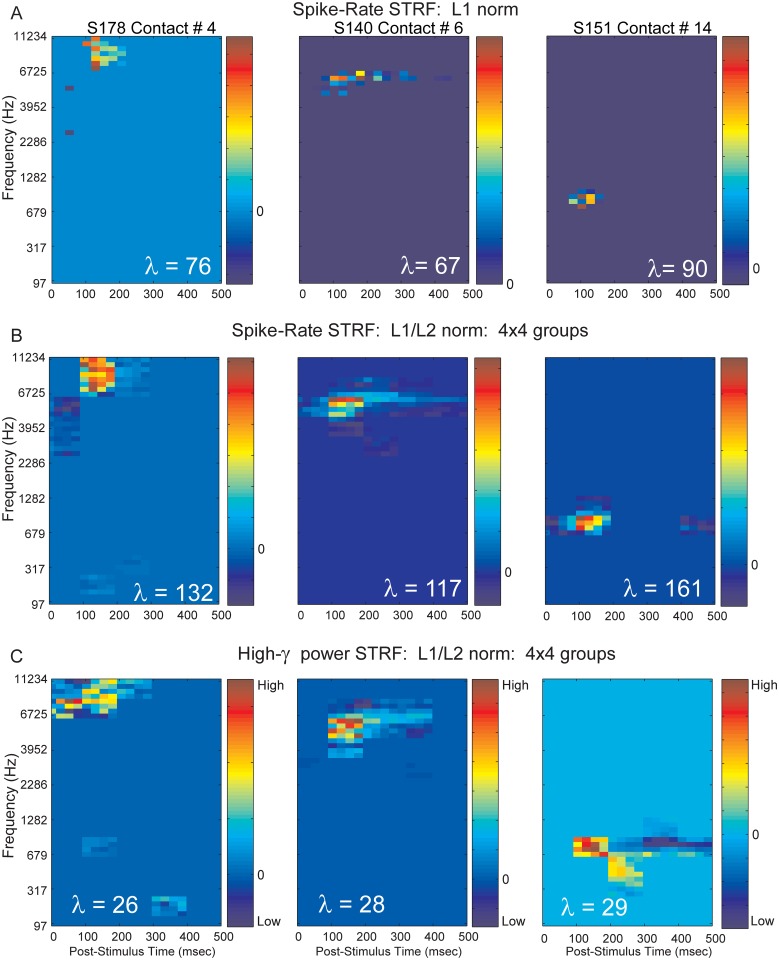
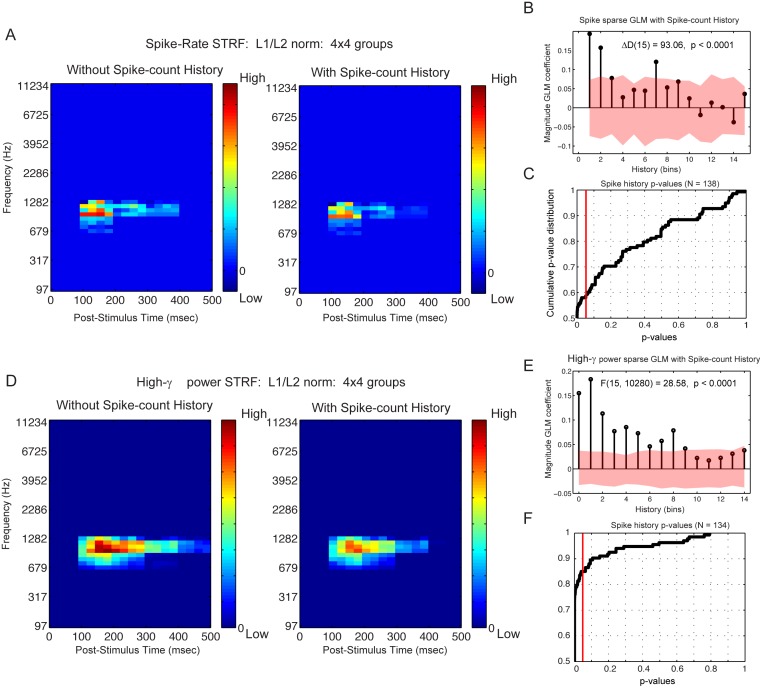
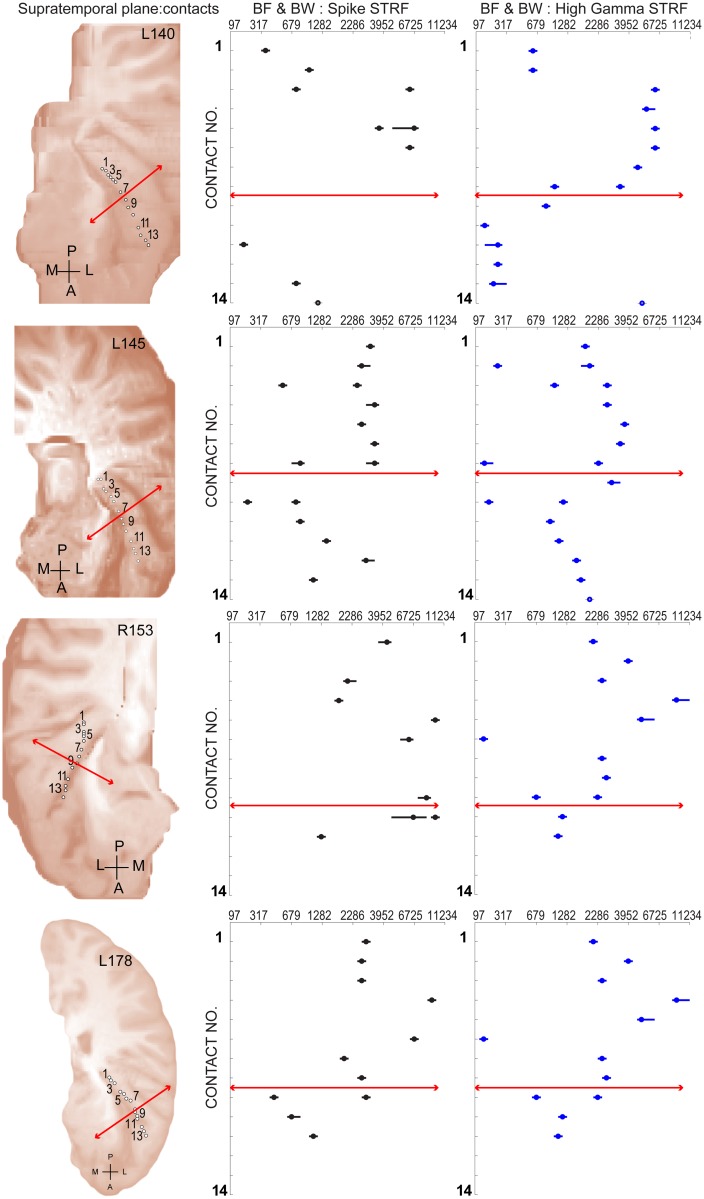
Spectro-Temporal Receptive Fields (STRFs) were estimated from both multi-unit sorted clusters and high-gamma power responses in human auditory cortex. Intracranial electrophysiological recordings were used to measure responses to a random chord sequence of Gammatone stimuli. Traditional methods for estimating STRFs from single-unit recordings, such as spike-triggered-averages, tend to be noisy and are less robust to other response signals such as local field potentials. We present an extension to recently advanced methods for estimating STRFs from generalized linear models (GLM). A new variant of regression using regularization that penalizes non-zero coefficients is described, which results in a sparse solution. The frequency-time structure of the STRF tends toward grouping in different areas of frequency-time and we demonstrate that group sparsity-inducing penalties applied to GLM estimates of STRFs reduces the background noise while preserving the complex internal structure. The contribution of local spiking activity to the high-gamma power signal was factored out of the STRF using the GLM method, and this contribution was significant in 85 percent of the cases. Although the GLM methods have been used to estimate STRFs in animals, this study examines the detailed structure directly from auditory cortex in the awake human brain. We used this approach to identify an abrupt change in the best frequency of estimated STRFs along posteromedial-to-anterolateral recording locations along the long axis of Heschl's gyrus. This change correlates well with a proposed transition from core to non-core auditory fields previously identified using the temporal response properties of Heschl's gyrus recordings elicited by click-train stimuli.


Conflict of interest statement

Competing Interests: The authors have declared that no competing interests exist.

Figures

Fig 1
Fig 1. Locations of electrode recording sites within the superior temporal plane.
(A) MRI lateral-view rendering of a typical human left hemisphere. The Sylvian fissure is not visible from the cortical surface. The superior temporal plane was revealed along a section oriented at an oblique horizontal plane (solid red line with razor blade inset). (B) MRI rendering of superior temporal plane viewed from superior aspect. Light blue shading denotes the location of the obliquely oriented Heschl’s gyrus. The estimated locations of four recording sites selected from three different subjects (S140, S151, and S178) were projected to the surface of this illustrative brain and marked with filled red circles. MRI cross-sectional images containing the recording sites were obtained from sections oriented at an oblique frontal plane (solid green lines with razor blade inset), approximately perpendicular to the long axis of Heschl’s gyrus. (C) Line drawings of MRI cross sections show the position of the recording sites within the grey matter of Heschl’s gyrus for individual subjects.
Fig 2
Fig 2. Gammatone stimuli.
A) Human cochleotopic map of center frequencies from 100 to 11,234 Hz. B) Gammatone signal at 1 kHz center frequency. C) Gammatone filter bank with 50 channels.
Fig 3
Fig 3. Generalized Linear Model (GLM) schematic.
Stimulus-state matrix (A) is convolved with the Poisson estimated STRF, and exponentially transformed to generate a Poisson counting process. The corresponding stimulus Log-Spectrogram shown in lower panel (B). Alternatively, the stimulus-state matrix is convolved with the Log-normal estimated STRF and generates an exponential transformed High-γ process. Either model can include feedback of the spike-count history. Representative sorted multi-unit clusters from the same LFP recording are shown in the bottom right insets.
Fig 4
Fig 4. Discovery-based selection of lambda (λ).
Discovery-selection by permutation of the response r(t) to identify the minimum lambda necessary to reduce the degrees of freedom to zero. Empirical distribution shows the histogram of minimum λ over 200 repeated permutations and serves as the null distribution. The red arrow denotes the median of the distribution that we designate as the optimal λ.
Fig 5
Fig 5. STRF estimated from STA and from GLM.
(A) STRF from STA. Stimulus center frequencies ranged from 97 to 11,234 Hz. Spike-times were binned at 1 ms resolution. (B) Evolution of Spike-count STRF from GLM as a function of increasing λ for L1 norm LASSO: (a) very low values of λ lead to noisy estimates, (c) at very high values of λ all covariates are zero valued, (d) at optimal value of λ chosen from discovery-based selection. (C) Evolution of Spike-count STRF from GLM as a function of increasing λ for L1/L2 norm group LASSO: (e) very low, (g) very high, and (h) optimal values of λ. Optimization selects or removes, simultaneously, all the covariates forming a group. Groups are composed of 4x4, adjacent and non-overlapping covariates. (D) Predicted discharge λ CIF(t|H t) from representative segment of gammatone stimulus, with and without sparse-group regularization. Group-sparse regularized GLM consistently improved the prediction of validation data over non-regularized GLM prediction of expected spike-counts. Correlation coefficients are 0.133 with regularization (red) and 0.066 without regularization (gray). Neural responses from S178, electrode contact #4.
Fig 6
Fig 6. Spike-count and High-γ power STRFs derived with sparse GLM models.
Neural responses from S178 electrode contact #4 used in left column, responses from S140 electrode contact #6 used in middle column and from S151 electrode contact #14 used in right column (See also Fig 1). Optimal λ values are shown on insets. (A) Spike-count STRF using L1 sparsity-inducing norm. (B) Spike-count STRF using L1/L2 norm regularization that exploits group structure when covariates are partitioned into neighborhoods, or groups. In this case, optimization selects or removes all the variables forming a group. Groups are composed of 4x4, adjacent and non-overlapping covariates. (C) High-γ (70 to 150 Hz) band power STRF from L1/L2 norm regularization that exploits group structure. Groups are composed of 4x4, adjacent and non-overlapping covariates.
Fig 7
Fig 7. Spike-Count History contribution to spike-count and High-γ band power STRFs.
Neural responses from S178, electrode contact #11. Anatomical location shown in Fig 1. (A) Spike-count STRF estimated with L1/L2 sparsity-inducing norm and group structure GLM with Poisson distribution to link responses to predictors, without and with 350 ms spike-count history. (B) Magnitude of GLM spike-count history coefficients decreases with increasing history (i.e. time elapsed since current spike-count prediction). Shading represents 95% central range of null distribution estimated from permuted random shuffling of responses. (C) Cumulative distribution of p-values testing the contribution of spike-count history to current spike-count activity driven by gammatone stimuli. All p-values were adjusted for false discovery rate. (D) High-γ power STRF estimated with L1/L2 sparsity-inducing norm and group structure GLM with Poisson distribution to link responses to predictors, without and with 350 ms spike-count history. (E) Magnitude of GLM coefficients decreases with increasing spike-count history (i.e. time elapsed since current High-γ band power prediction). (F) Cumulative distribution of p-values testing the contribution of spike-count history to current High-γ power activity driven by gammatone stimuli. All p-values were adjusted for false discovery rate.
Fig 8
Fig 8. Best frequency and bandwidth estimated for sites within Heschl’s gyrus.
(Left column) Fourteen recording locations in each subject were projected to the surface and marked with open circles. Solid red line marks the transition from core to non-core fields estimated with click train stimuli. (Middle column) Open circles mark a single or multiple best-frequency (BF) value for each location estimated from spike-count STRF. Bandwidth (BW) is depicted by a solid black line centered on the best-frequency for each location. (Right column) BF and BW mapped using High-γ power STRF.

Similar articles

Cited by

References

    1. Clarke S, Morosan P. Architecture, Connectivity, and Transmitter Receptors of Human Auditory Cortex In: Poeppel D, Overath T, Popper AN, Fay RR, editors. The Human Auditory Cortex. Springer Handbook of Auditory Research. 43: Springer; New York; 2012. p. 11–38.
    1. Hackett TA. Anatomic organization of the auditory cortex. Handb Clin Neurol. 2015;129:27–53. Epub 2015/03/03. 10.1016/B978-0-444-62630-1.00002-0 B978-0-444-62630-1.00002–0 [pii]. . - DOI - PubMed
    1. Nourski KV, Brugge JF. Representation of temporal sound features in the human auditory cortex. Reviews in the Neurosciences. 2011;22(2):187–203. 10.1515/rns.2011.016 WOS:000300088800005. - DOI - PubMed
    1. Kaas JH, Hackett TA. Subdivisions of auditory cortex and processing streams in primates. Proceedings of the National Academy of Sciences of the United States of America. 2000;97(22):11793–9. 10.1073/pnas.97.22.11793 WOS:000090071000021. - DOI - PMC - PubMed
    1. Howard MA, Volkov IO, Noh MD, Granner MA, Mirsky R, Garell PC. Chronic microelectrode investigations of normal human brain physiology using a hybrid depth electrode. Stereotact Funct Neurosurg. 1997;68(1–4 Pt 1):236–42. Epub 1997/01/01. . - PubMed

Publication types