

Laboratory Evaluation of the Shinyei PPD42NS Low-Cost Particulate Matter Sensor
- PMID: 26367264
- PMCID: PMC4569398
- DOI: 10.1371/journal.pone.0137789
Laboratory Evaluation of the Shinyei PPD42NS Low-Cost Particulate Matter Sensor
Erratum in
-
Correction: Laboratory Evaluation of the Shinyei PPD42NS Low-Cost Particulate Matter Sensor.PLoS One. 2015 Oct 28;10(10):e0141928. doi: 10.1371/journal.pone.0141928. eCollection 2015. PLoS One. 2015. PMID: 26509438 Free PMC article. No abstract available.
Abstract
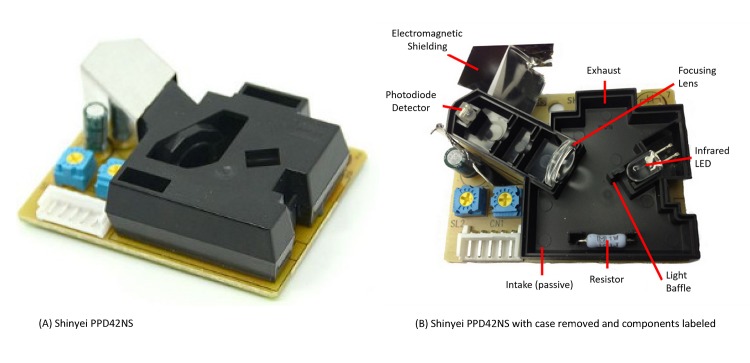
Objective: Finely resolved PM2.5 exposure measurements at the level of individual participants or over a targeted geographic area can be challenging due to the cost, size and weight of the monitoring equipment. We propose re-purposing the low-cost, portable and lightweight Shinyei PPD42NS particle counter as a particle counting device. Previous field deployment of this sensor suggests that it captures trends in ambient PM2.5 concentrations, but important characteristics of the sensor response have yet to be determined. Laboratory testing was undertaken in order to characterize performance.
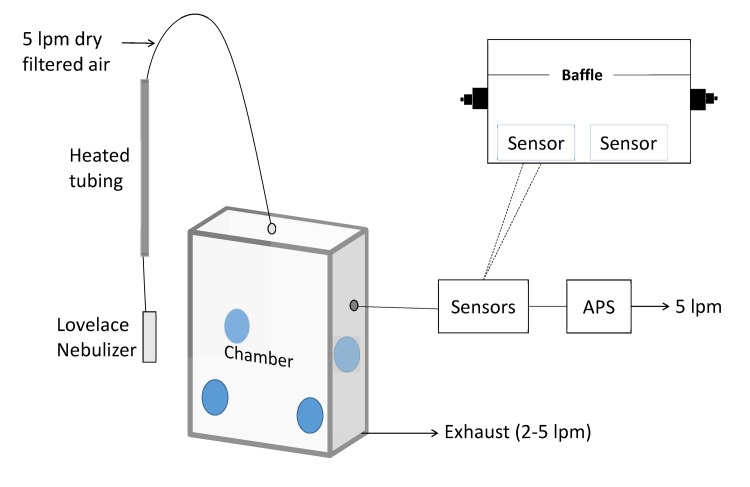
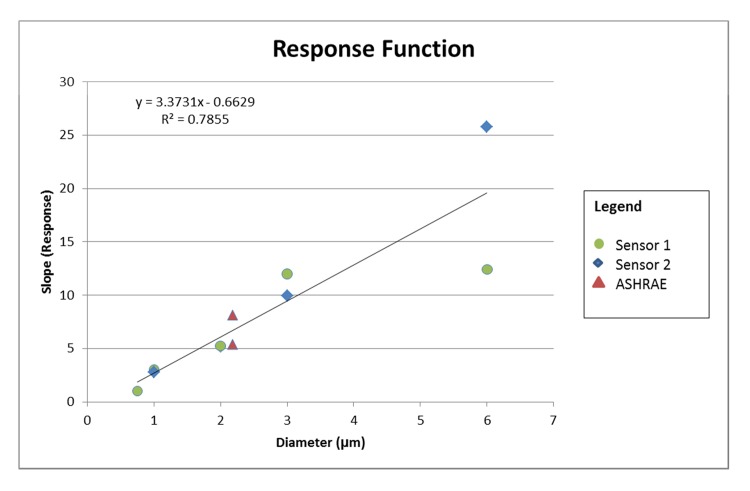
Methods: The Shinyei sensors, in-line with a TSI Aerosol Particle Sizer (APS) model 3321, tracked particle decay within an aerosol exposure chamber. Test atmospheres were composed of monodisperse polystyrene spheres with diameters of 0.75, 1, 2 3 and 6 um as well as a polydisperse atmosphere of ASHRAE test dust #1.
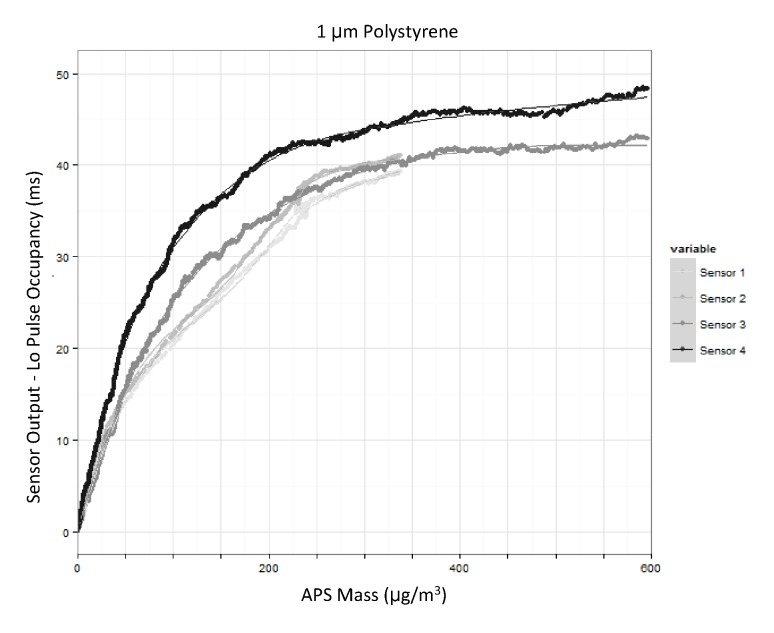
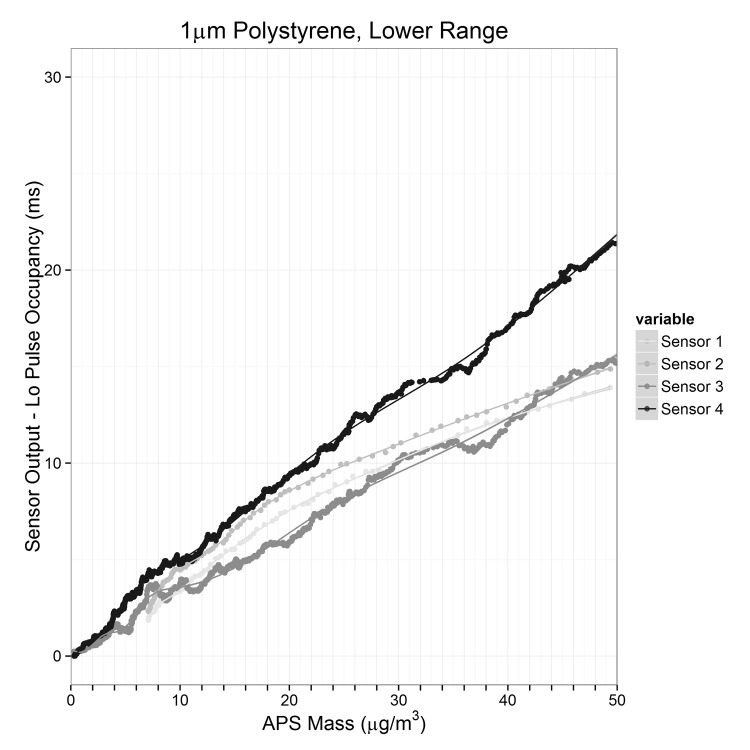
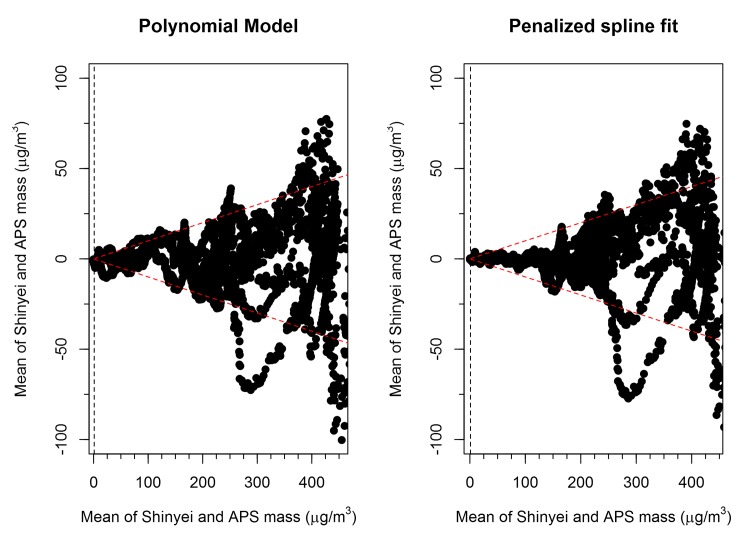
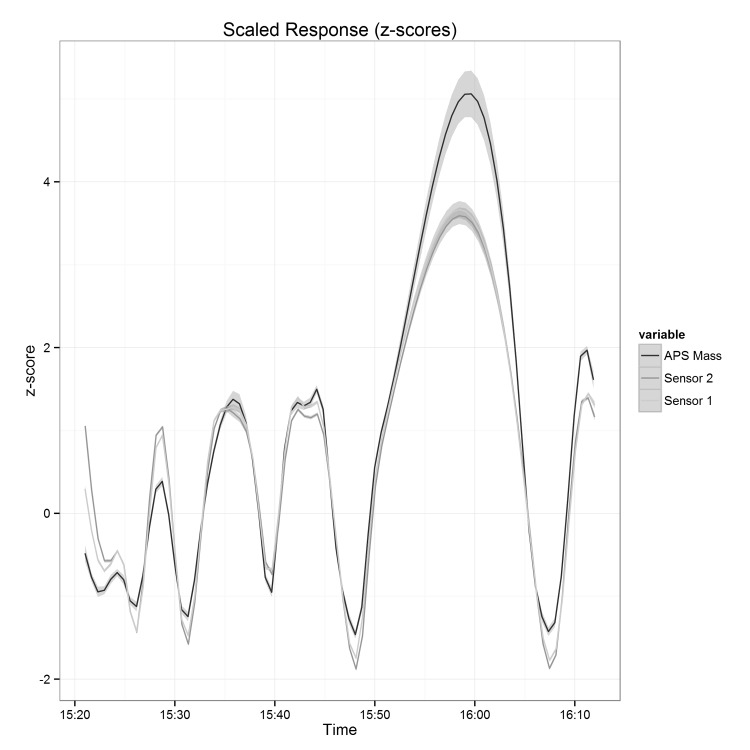
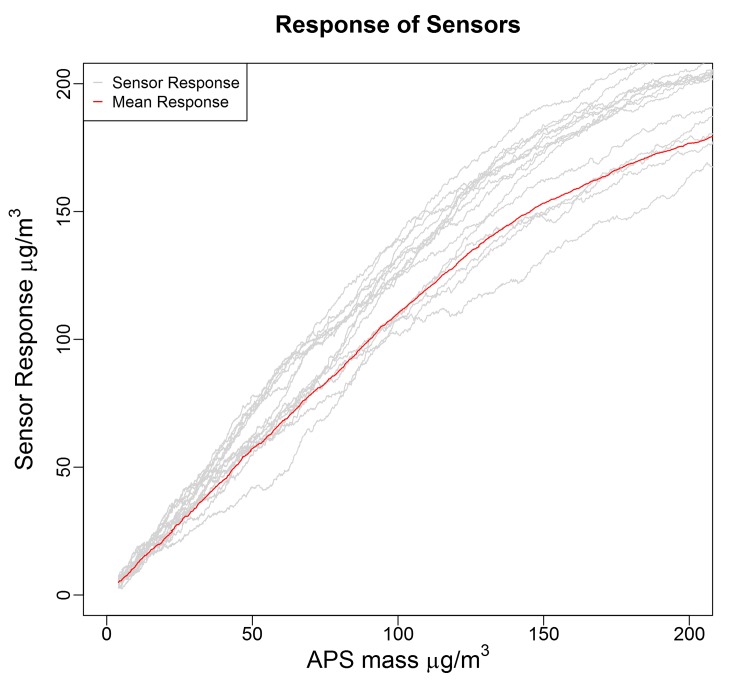
Results: Two-minute block averages of the sensor response provide a measurement with low random error, within sensor, for particles in the 0.75-6μm range with a limit of detection of 1 μg/m3. The response slope of the sensors is idiomatic, and each sensor requires a unique response curve. A linear model captures the sensor response for concentrations below 50 μg/m3 and for concentrations above 50 μg/m3 a non-linear function captures the response and saturates at 800 μg/m3. The Limit of Detection (LOD) is 1 μg/m3. The response time is on the order of minutes, making it appropriate for tracking short-term changes in concentration.
Conclusions: When paired with prior evaluation, these sensors are appropriate for use as ambient particle counters for low and medium concentrations of respirable particles (< 100 ug/m3). Multiple sensors deployed over a spatial grid would provide valuable spatio-temporal variability in PM2.5 and could be used to validate exposure models. When paired with GPS tracking, these devices have the potential to provide time and space resolved exposure measurements for a large number of participants, thus increasing the power of a study.
Conflict of interest statement
Figures
References
-
- Dockery DW, Pope CA III, Xu X, Spengler JD, Ware JH, Fay ME, et al. An association between air pollution and mortality in six US cities. N Engl J Med 1993;329(24):1753–1759. - PubMed
-
- Krewski D, Burnett RT, Goldberg MS, Hoover K, Siemiatycki J, Jerrett M, et al. Reanalysis of the Harvard Six Cities Study and the American Cancer Society Study of particulate air pollution and mortality Cambridge, MA: Health Effects Institute; 2000;295. - PubMed
-
- Krewski D, Jerrett M, Burnett RT, Ma R, Hughes E, Shi Y, et al. Extended follow-up and spatial analysis of the American Cancer Society study linking particulate air pollution and mortality.: Health Effects Institute; Boston, MA; 2009. - PubMed
-
- Lipfert F, Wyzga R, Baty J, Miller J. Traffic density as a surrogate measure of environmental exposures in studies of air pollution health effects: Long-term mortality in a cohort of US veterans. Atmos Environ 2006;40(1):154–169.
-
- Peng RD, Dominici F, Pastor-Barriuso R, Zeger SL, Samet JM. Seasonal analyses of air pollution and mortality in 100 US cities. Am J Epidemiol 2005. March 15;161(6):585–594. - PubMed
Publication types
MeSH terms
Substances
Grants and funding
LinkOut - more resources
Full Text Sources
Other Literature Sources
Medical
Miscellaneous
