Controlled Clinical Trial
. 2015 Sep 14;10(9):e0137429.
doi: 10.1371/journal.pone.0137429. eCollection 2015.

Dysbiosis in the Gut Microbiota of Patients with Multiple Sclerosis, with a Striking Depletion of Species Belonging to Clostridia XIVa and IV Clusters

Affiliations
Controlled Clinical Trial

Dysbiosis in the Gut Microbiota of Patients with Multiple Sclerosis, with a Striking Depletion of Species Belonging to Clostridia XIVa and IV Clusters

Sachiko Miyake et al. PLoS One. .

Abstract

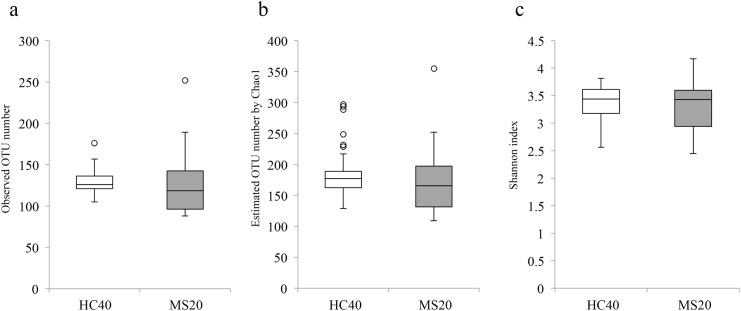
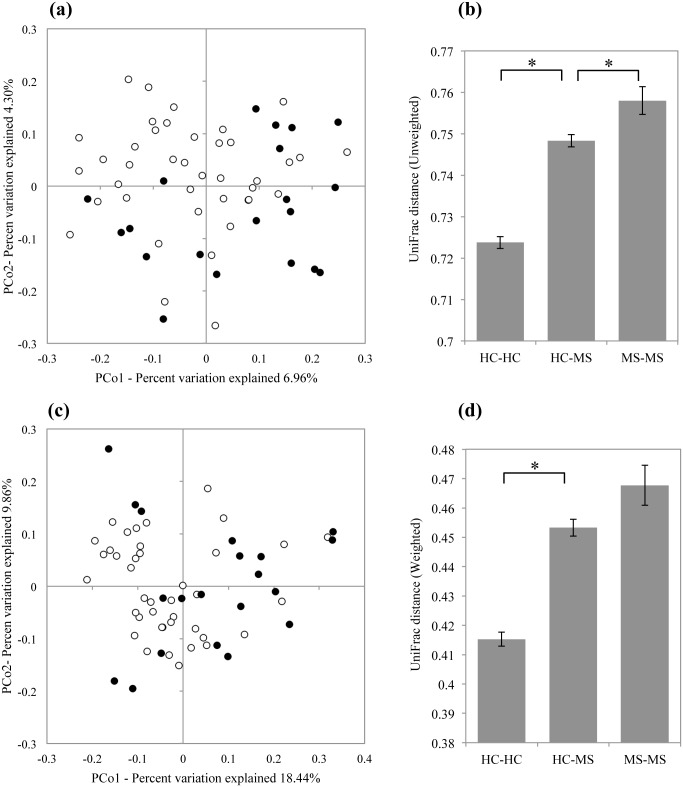
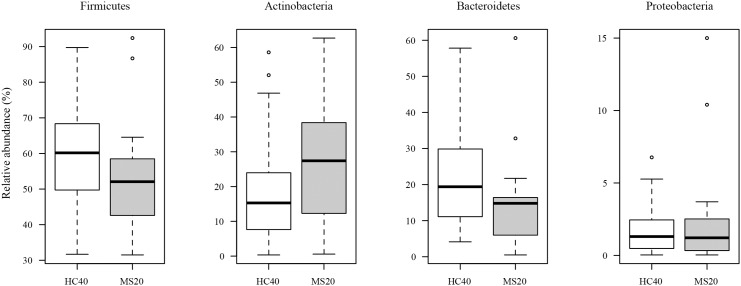
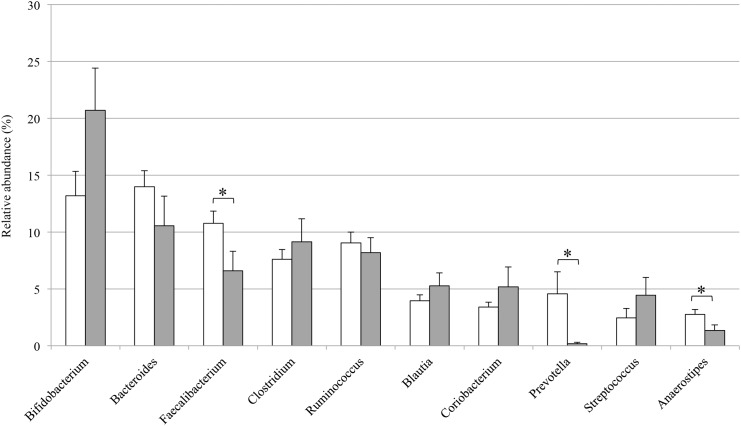
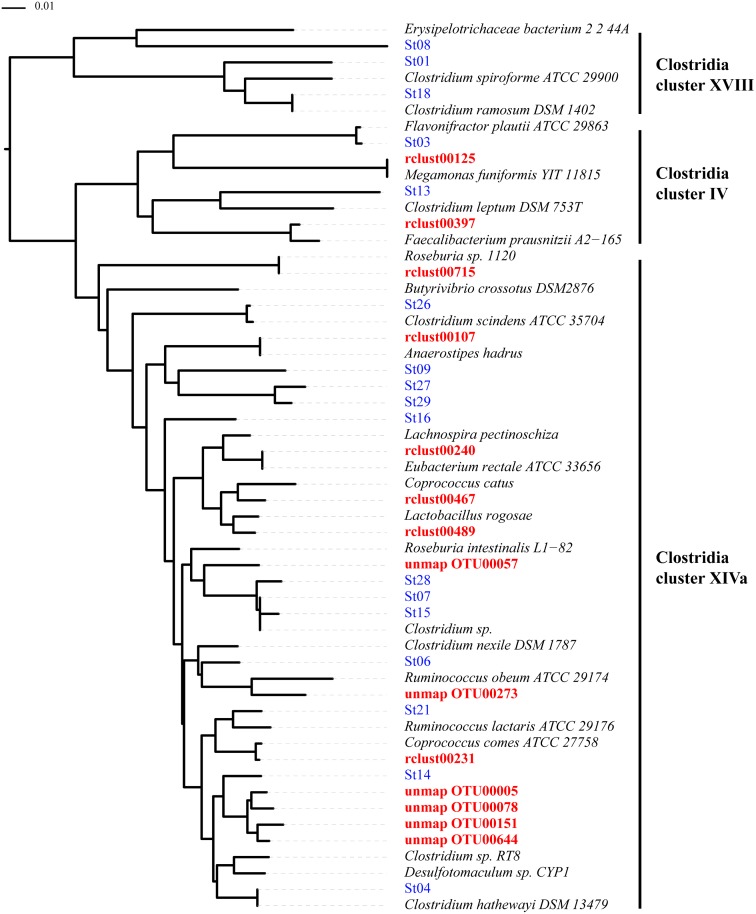
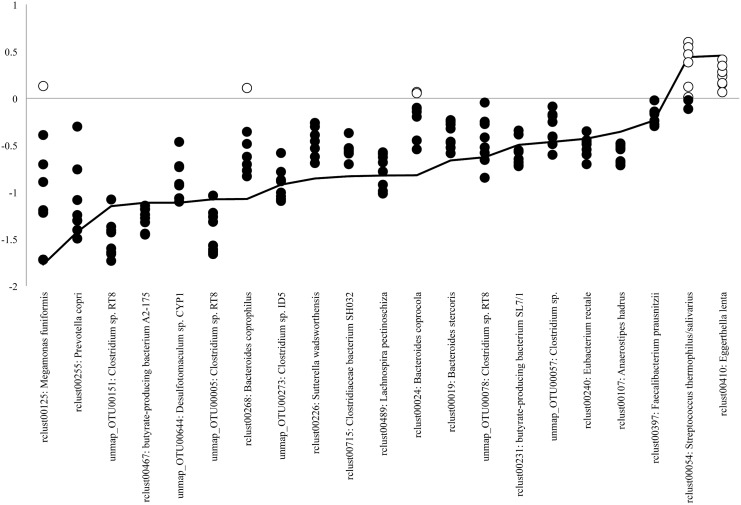
The pathogenesis of multiple sclerosis (MS), an autoimmune disease affecting the brain and spinal cord, remains poorly understood. Patients with MS typically present with recurrent episodes of neurological dysfunctions such as blindness, paresis, and sensory disturbances. Studies on experimental autoimmune encephalomyelitis (EAE) animal models have led to a number of testable hypotheses including a hypothetical role of altered gut microbiota in the development of MS. To investigate whether gut microbiota in patients with MS is altered, we compared the gut microbiota of 20 Japanese patients with relapsing-remitting (RR) MS (MS20) with that of 40 healthy Japanese subjects (HC40) and an additional 18 healthy subjects (HC18). All the HC18 subjects repeatedly provided fecal samples over the course of months (158 samples in total). Analysis of the bacterial 16S ribosomal RNA (rRNA) gene by using a high-throughput culture-independent pyrosequencing method provided evidence of a moderate dysbiosis in the structure of gut microbiota in patients with MS. Furthermore, we found 21 species that showed significant differences in relative abundance between the MS20 and HC40 samples. On comparing MS samples to the 158 longitudinal HC18 samples, the differences were found to be reproducibly significant for most of the species. These taxa comprised primarily of clostridial species belonging to Clostridia clusters XIVa and IV and Bacteroidetes. The phylogenetic tree analysis revealed that none of the clostridial species that were significantly reduced in the gut microbiota of patients with MS overlapped with other spore-forming clostridial species capable of inducing colonic regulatory T cells (Treg), which prevent autoimmunity and allergies; this suggests that many of the clostridial species associated with MS might be distinct from those broadly associated with autoimmune conditions. Correcting the dysbiosis and altered gut microbiota might deserve consideration as a potential strategy for the prevention and treatment of MS.


Conflict of interest statement

Competing Interests: The authors have declared that no competing interests exist.

Figures

Fig 1
Fig 1. OTU/species diversity and richness in gut microbiota of HC40 and MS20 subjects.
(a) Number of operational taxonomic units (OTUs) generated by clustering of 3,000 16S reads of gut microbiota samples from 40 healthy control subjects (HC40) and 20 patients with multiple sclerosis (MS20). (b) Estimated OTU numbers obtained from Chao1 extrapolation of the observed OTU numbers shown in (a). (c) Shannon index calculated from the observed OTU numbers. The vertical axes indicate the numbers of OTUs (a, b) and the Shannon index (c). Each box plot represents median, interquartile range, minimum, and maximum values.
Fig 2
Fig 2. UniFrac Principal Coordinate (PCoA) and UniFrac distance analyses for HC40 and MS20 subjects.
(a, c) Open and closed circles indicate individual subjects from HC40 and MS20, respectively. (a) The two components of the unweighted PCoA plot explained 6.96% and 4.30% of the variance. ANOSIM statistic, R = 0.239, P ≤ 0.0009. (b) Mean unweighted UniFrac distances for HC-HC, HC-MS, and MS-MS subjects. (c) The two components of the weighted PCoA plot explained 18.44% and 9.86% of the variance. ANOSIM statistic, R = 0.208, P ≤ 0.002. (d) Mean weighted UniFrac distances for HC-HC, HC-MS, and MS-MS subjects. (b, d) Error bars represent standard deviations of the UniFrac distances between samples. *P ≤ 0.05.
Fig 3
Fig 3. Bacterial composition at the phylum level in gut microbiota samples obtained from HC40 and MS20 subjects.
For phylum-level assignment of 16S reads (16S rRNA gene V1-V2 region) mapped to the known FL-16S sequences and unmapped OTUs (see Results), 70% sequence identity threshold was applied. The vertical axis represents the relative abundance of each phylum in the microbiota of HC40 (open bar) and MS20 (grey bar) subjects. Each box plot represents median, interquartile range, minimum, and maximum values.
Fig 4
Fig 4. Bacterial composition at the genus level in gut microbiota samples obtained from HC40 and MS20 subjects.
For genus-level assignment of 16S reads (16S rRNA gene V1-V2 region) mapped to the known FL-16S sequences and unmapped OTUs (see Results), 94% sequence identity threshold was applied. The vertical axis represents the relative abundance (%) of each genus in the microbiota of HC40 (open bar) and MS20 (grey bar) subjects. Error bars represent standard error of the mean. Asterisks indicate statistical significance determined by Welch’s t test (*P < 0.05).
Fig 5
Fig 5. Phylogenetic tree of 14 clostridial species exhibiting significant differences among groups and several known species.
The neighbor-joining method was used to construct the phylogenetic tree. Numbers at each node indicate the bootstrap support (1,000 replicates). Those written in red letters are 14 clostridial species having a significant difference in relative abundance between HC40 and MS20 samples. Treg-inducing strains are indicated by “St” and are written in blue letters [13].
Fig 6
Fig 6. Fold-change in the abundance of 21 species using longitudinal HC18 samples.
The vertical axis indicates the log value of fold-change in the abundance of 22 species for the comparison between MS20 and HC18 (nine longitudinal samples per individual) samples. Open and closed circles indicate log values of fold-change > 0 (increased in MS) and < 0 (decreased in MS), respectively. The average fold-change in the abundance of each species for the comparison between MS20 and HC40 samples was connected by a line.

Similar articles

Cited by

References

    1. Bach JF. The effect of infections on susceptibility to autoimmune and allergic diseases. N Engl J Med. 2002;347: 911–920. - PubMed
    1. Osoegawa M, Kira J, Fukazawa T, Fujihara K, Kikuchi S, Matsui M, et al. Temporal changes and geographical differences in multiple sclerosis phenotypes in Japanese: nationwide survey results over 30 years. Mult Scler. 2009;15: 159–173. 10.1177/1352458508098372 - DOI - PubMed
    1. International Multiple Sclerosis Genetics Consortium; Wellcome Trust Case Control Consortium 2, Sawcer S, Hellenthal G, Pirinen M, et al. Genetic risk and a primary role for cell-mediated immune mechanisms in multiple sclerosis. Nature. 2011;476: 214–219. 10.1038/nature10251 - DOI - PMC - PubMed
    1. Ascherio A, Munger KL. Environmental risk factors for multiple sclerosis. Part II: Noninfectious factors. Ann Neurol. 2007;61: 504–513. - PubMed
    1. Houzen H, Niino M, Hirotani M, Fukazawa T, Kikuchi S, Tanaka K, et al. Increased prevalence, incidence, and female predominance of multiple sclerosis in northern Japan. J Neurol Sci. 2012;323: 117–122. - PubMed

Publication types