
The UK10K project identifies rare variants in health and disease

UK10K Consortium et al. Nature. .

Abstract

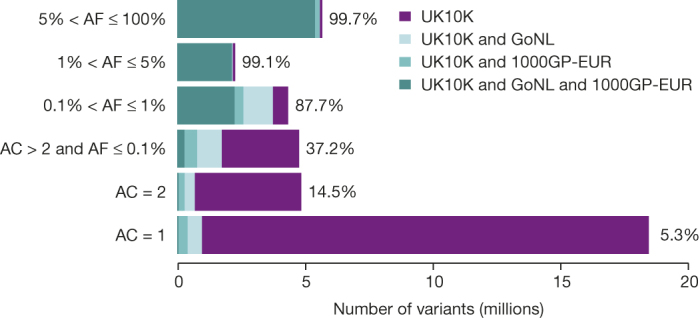
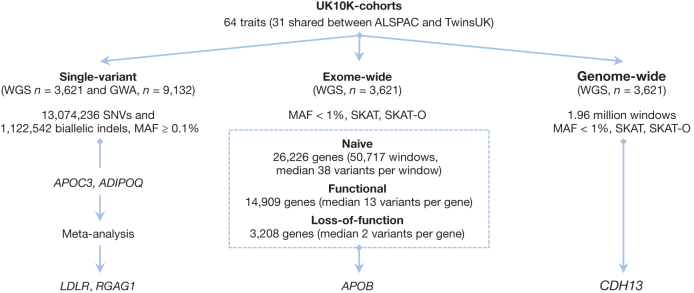
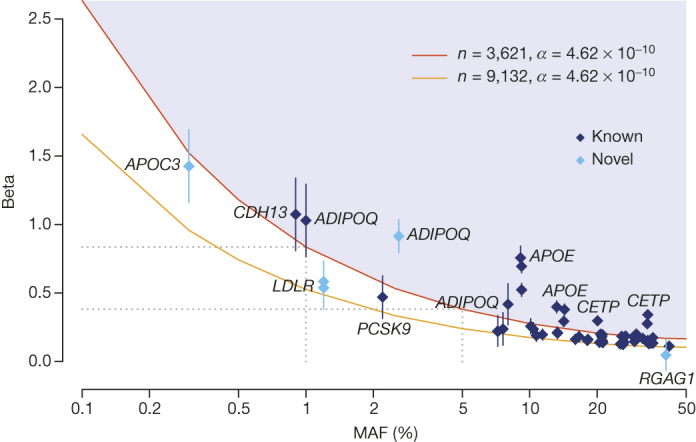
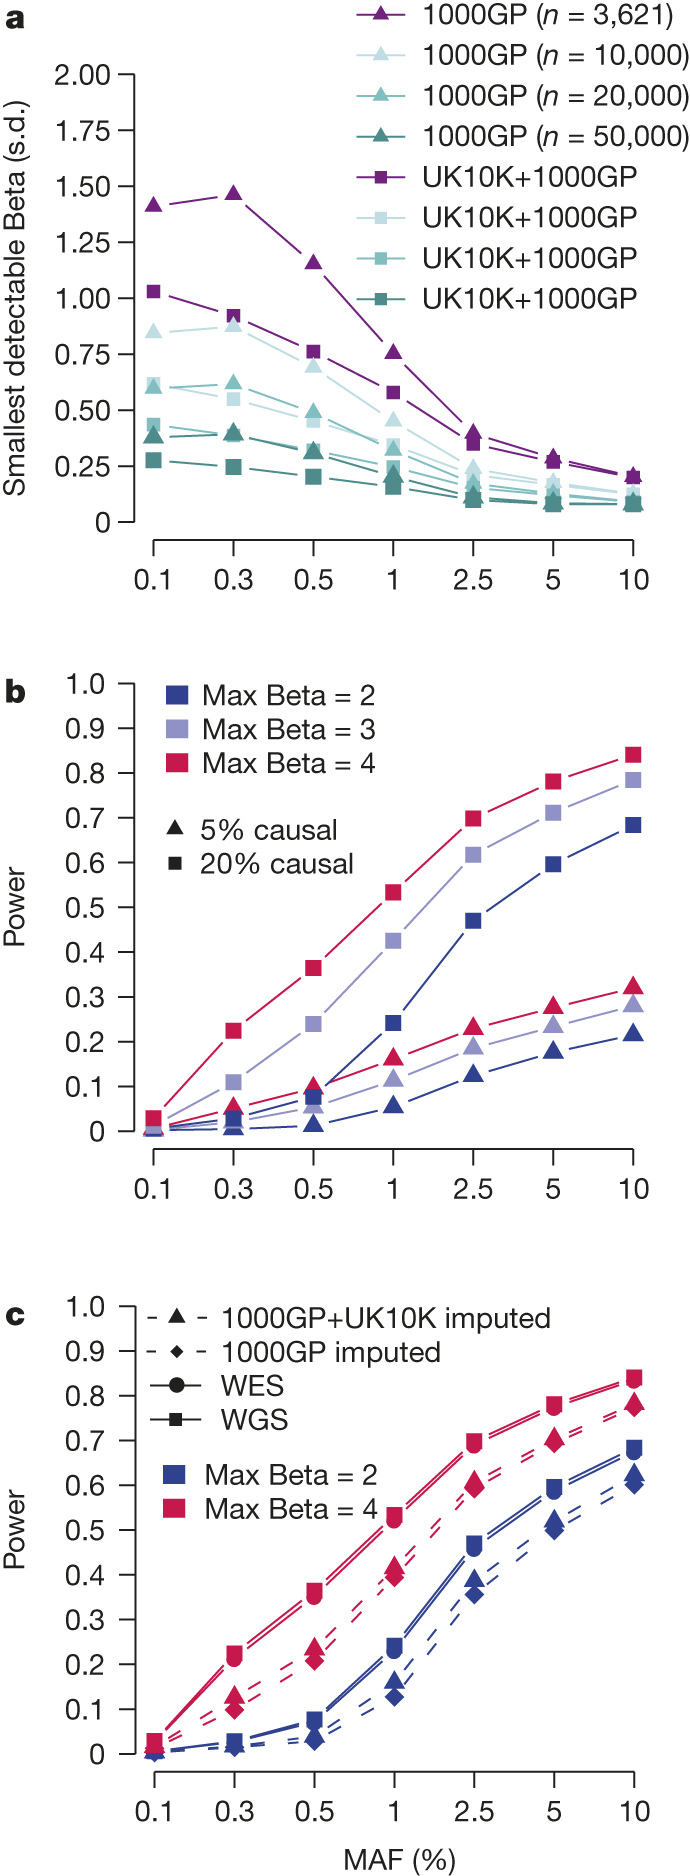
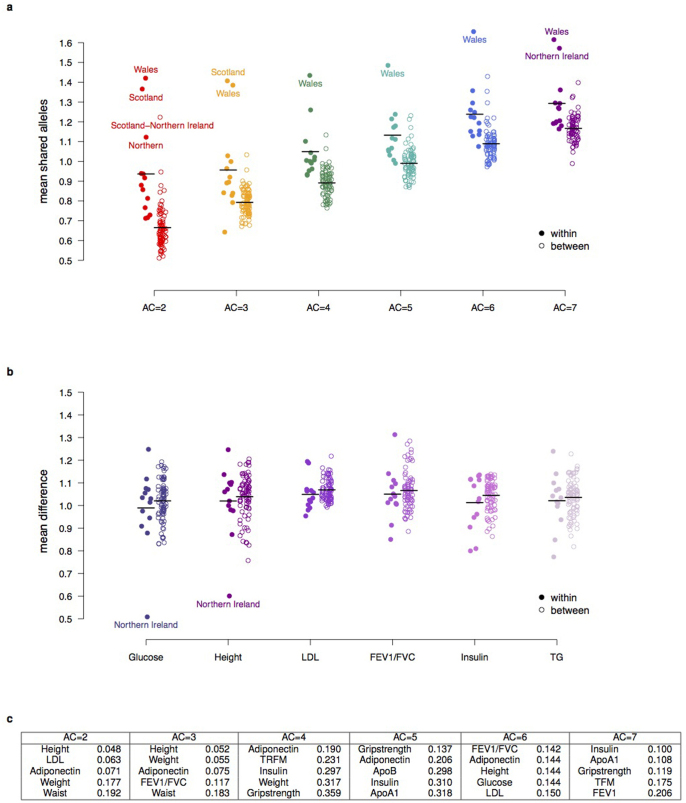
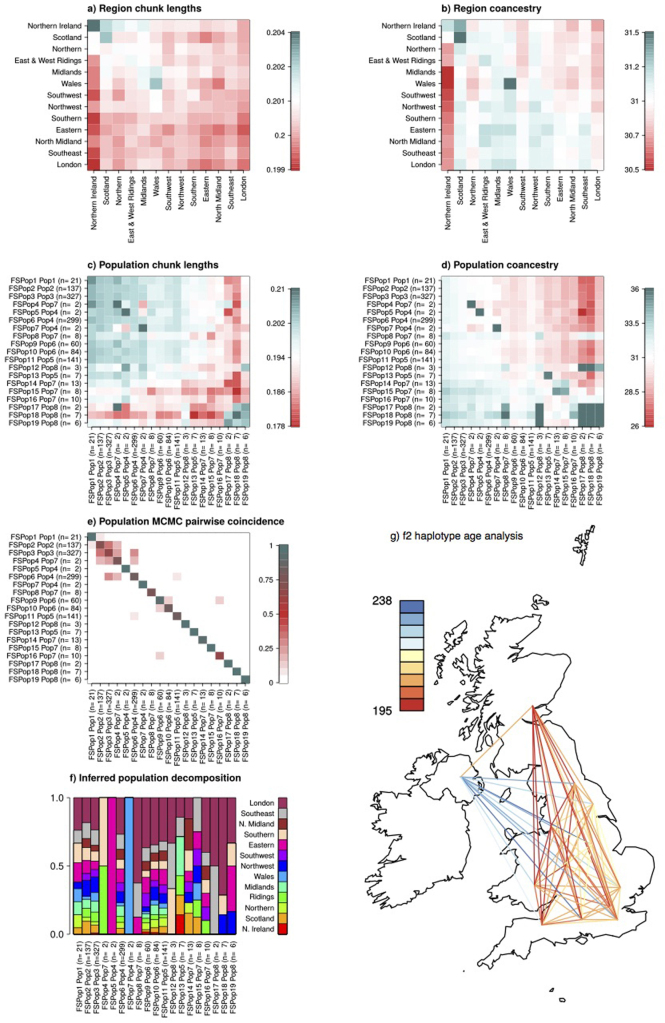
The contribution of rare and low-frequency variants to human traits is largely unexplored. Here we describe insights from sequencing whole genomes (low read depth, 7×) or exomes (high read depth, 80×) of nearly 10,000 individuals from population-based and disease collections. In extensively phenotyped cohorts we characterize over 24 million novel sequence variants, generate a highly accurate imputation reference panel and identify novel alleles associated with levels of triglycerides (APOB), adiponectin (ADIPOQ) and low-density lipoprotein cholesterol (LDLR and RGAG1) from single-marker and rare variant aggregation tests. We describe population structure and functional annotation of rare and low-frequency variants, use the data to estimate the benefits of sequencing for association studies, and summarize lessons from disease-specific collections. Finally, we make available an extensive resource, including individual-level genetic and phenotypic data and web-based tools to facilitate the exploration of association results.


Conflict of interest statement

P.F. is a member of the Scientific Advisory Board of Omicia, Inc.

Figures

Figure 1
Figure 1. The UK10K-cohorts resource for variation discovery.
Number of SNVs identified in the UK10K-cohorts data set in all autosomal regions in different allele frequency (AF) bins, and percentages that were shared with samples of European ancestry from the 1000 Genomes Project (phase I, EUR n = 379) and/or the Genomes of the Netherlands (GoNL, n = 499) study, or unique to the UK10K-cohorts data set. AF bins were calculated using the UK10K data set, for allele count (AC) = 1, AC = 2, and non-overlapping AF bins for higher AC. All numerical values are in Extended Data Fig. 2. PowerPoint slide
Figure 2
Figure 2. Study design for associations tested in the UK10K-cohorts study.
Summary of phenotype–genotype association testing strategies employed in the UK10K-cohorts study. PowerPoint slide
Figure 3
Figure 3. Summary of association results across the UK10K-cohorts study.
Allelic spectrum for single-marker association results for independent variants identified in the single-variant analysis (Supplementary Table 5). A variant’s effect (absolute value of Beta, expressed in standard deviation units) is given as a function of minor allele frequency (MAF, x axis). Error bars are proportional to the standard error of the beta, variants identifying known loci are dark blue and variants identifying novel signals replicated in independent studies are coloured in light blue. The red and orange lines indicate 80% power at experiment-wide significance level (t-test; P value ≤4.62 × 10−10) for the maximum theoretical sample size for the WGS sample and WGS+GWA, respectively. PowerPoint slide
Figure 4
Figure 4. Power for single-variant and region-based tests.
a, Strength of single-variant associations detectable at 80% power as a function of MAF and sample size. Using data from chromosome 20, we calculated the smallest value of the strength of association Beta (measured in standard deviations), that would be detectable under a linear dosage model, given the MAF and r2 of each variant imputable from both the 1000GP and the UK10K+1000GP reference panels, for various sample sizes, n. The averages of these minimum detectable beta values by MAF and sample size are shown. b, Power of region-based tests in the UK10K-cohorts sample. Evaluations assume n = 3,621, α = 6.7 × 10−8 and that the proportion of causal variants in the regions is either 5% or 20%, for maximum association (Max Beta) in a region = 2, 3, 4 s.d. c, Power of region-based tests and the impact of genotype imputation. Ten regions of 30 variants were randomly sampled from each autosome, and then genotype errors were randomly added to the data following observed r2 values between genotypes from data imputed from different sources (WGS, high depth WES, GWAS imputed against 1000GP, GWAS imputed against the combined reference panel of 1000GP and UK10K; Supplementary Table 11), and matching the MAF of each variant using the same parameters as in b, with the proportion of causal variants in the regions set to 20%. PowerPoint slide
Figure 5
Figure 5. Enrichment of single-marker associations by functional annotation in the UK10K-cohorts study.
Distribution of fold enrichment statistics for single-variant associations of low-frequency (MAF 1–5%) and common (MAF ≥ 5%) SNVs in near-genic elements or selected chromatin states and DNase I hotspots (DHS). Boxplots represent distributions of fold enrichment statistics estimated across the five (out of 31 core) traits where at least 10 independent SNVs were associated with the trait at 10−7 P value (permutation test) threshold (HDL, LDL, TC, APOA1 and APOB). Chromatin state and DHS regions were inferred from ENCODE data in a liver cell line, HepG2, which is informative for lipids. Promoter and 5′ UTR are not shown, but corresponding statistics are given in Supplementary Table 12. PowerPoint slide
Extended Data Figure 1
Extended Data Figure 1. UK10K-cohorts, sequence and sample quality and variation metrics.
ae, Sample quality metrics for UK10K-cohorts (n = 3,781) where n = 1–1,927 corresponds to ALSPAC and 1,928 to 3,781 to TwinsUK. This sample includes all individuals passing sample quality control, including related pairs and non-European individuals that were later removed from association tests. A subset of 3,621 individuals was included in association analyses. Samples sequenced at BGI are coloured in blue and samples sequenced at Sanger are coloured in grey. a, Number of singletons (AC = 1) by sample (×103). b, Number of INDELs by sample (×105). c, Read depth (sequence coverage) by sample. d, Ratio of heterozygous and homozygous non-reference (=homozygous alternative) SNV genotypes (mean for females = 1.54, mean for males = 1.47). e, Transition to transversion ratio (Ts/Tv) by sample. fi, Sequence variation metrics for UK10K-cohorts. f, Types of substitution (×106). g, Number of SNVs (×106), INDELs (×105) and large deletions (×103) by non-overlapping non-reference allele frequency (AF) bins. h, Size distribution of INDELs. Negative INDEL lengths represent deletions and positive INDEL lengths represent insertions. i, Large deletion size distribution in unequal bin sizes where the smallest deletions were 200 bp to 1 kb long and the largest deletions 100 kb to 1 Mb. In total 18,739 deletions were called with GenomeSTRiP. The average deletion size was ˜13 kb and the median size was ˜3.7 kb. j, Total number of SNVs and INDELs by AF bin (based on 3,781 samples), multi-allelic variants are treated as separate variants. k, Sequence quality and variation metrics for UK10K-cohorts. For 61 overlapping TwinsUK individuals we compared the variant sites and genotypes of the low-coverage sequences with high-coverage exome data by non-overlapping AF bins (WGS versus Exomes). We considered 74,621 shared sites in non-overlapping AF bins. We calculated the fraction of concordant over total sites, the number of non-reference genotypes and non-reference genotype discordance (NRD, in %) between WGS and Exomes; false discovery rate (FDR = FP/(FP + TP); TP, true positive; FP, false positive), where we consider the exomes as the truth set; number of false positives (FP) and FDR for sites that are or not shared with the 1000 Genomes Project, phase I (1000GP); false negative rate (FNR = FN/(FN + TP); FN, false negative; TP, true positive), where AF bins were defined based on the 61 exomes. Furthermore, we compared 22 monozygotic twin pairs at 880,280 bi-allelic SNV sites on chromosome 20, reporting the percentage of concordant genotypes, non-reference genotypes and NRD. AFs are from the set of 3,621 samples, which contains at most one of the two monozygotic twins from each pair. We note that discrepancies can be caused by errors in either twin, so the expected NRD to the truth would be half the NRD value given.
Extended Data Figure 2
Extended Data Figure 2. UK10K-cohorts, comparison with GoNL and 1000GP-EUR.
Percentage of autosomal SNVs that are either shared between UK10K (n = 3,781), GoNL (n = 499) and 1000GP-EUR (n = 379), or unique to each set, for allele counts (AC) AC = 1, AC = 2, and non-overlapping allele frequency (AF) bins for higher AC. a, Shared and unique variants for GoNL with AF based on GoNL, and b, for 1000GP-EUR. AF bins are not directly comparable owing to the different sample sizes in each call set. The x-axis shows the number of variants in millions. The percentages next to the bars represent the percentage of variants from GoNL (a) and 1000GP-EUR (b) that are shared with at least one of the other data sets. All numerical values used in a can be found in d and for b in e. c, Numerical values for Fig. 1.
Extended Data Figure 3
Extended Data Figure 3. UK10K-cohorts, derived allele frequency spectrum by functional annotation.
Derived allele frequency (DAF) spectrum for UK10K-cohorts chromosome 20 variants divided by functional class. a, Proportion of total variants (standardized across DAF bins) as a function of DAF for different genic elements. b, Standardized proportion of all variants by DAF bin, and divided into conserved (GERP > 2) versus neutral (GERP ≤ 2) sites. c, Ratio of conserved versus neutral variants by DAF bin, and classified by chromatin segmentation domains defined by ENCODE as detailed in the methods.
Extended Data Figure 4
Extended Data Figure 4. UK10K-cohorts, false discovery rate (FDR).
ag, FDR values for reporting associations at different P value cut-offs for all analyses reported in this study and the 31 core traits for single-variant analysis (a); naive exome-wide Meta SKAT (b); naive exome-wide Meta SKAT-O (c); functional exome-wide Meta SKAT (LoF and missense) (d); functional exome-wide Meta SKAT-O (LoF and missense) (e); functional exome-wide Meta SKAT (LoF) (f); functional exome-wide Meta SKAT-O (LoF) (g).
Extended Data Figure 5
Extended Data Figure 5. UK10K-cohorts, QQ plots.
QQ plots for the association tests of the 31 core traits in the WGS data set (n = 3,621 individuals). a, Single-variant analysis (˜14 million variants with MAF ≥ 0.1%); b, naive exome-wide Meta SKAT (1,783,548 variants with MAF < 1% in 50,717 windows); c, functional exome-wide Meta SKAT (LoF and missense; 256,733 variants with MAF < 1% in 14,909 windows); d, loss-of-function functional exome-wide Meta SKAT (LoF; 9,113 variants with MAF < 1% in 3,208 windows); e, genome-wide Meta SKAT (35,858,684 variants with MAF < 1% in 1,845,982 windows).
Extended Data Figure 6
Extended Data Figure 6. UK10K-exomes, sequence variant statistics.
Number of variants (×103) that are found in one or more of the three UK10K-exomes disease data sets, as a function of allele frequency (AF) of the non-reference allele. Variants are split into allele counts (AC) AC = 1, AC = 2 and non-overlapping AF bins for AC > 2. Allele frequency is the frequency of the alternative allele. The distributions of SNVs and INDELs across frequencies and disease collections are similar, except that there is a lower proportion of INDELs with AF > 1% compared to SNVs. a, SNVs. Multiallelic sites are included (1.6%), and non-reference alleles at the same site are treated as separate variants. b, INDELs. Counts are given in c. c, Variants are classed by whether they were found in more than one disease collection or unique to a specific group. d, Comparison of UK10K patient set with European-Americans individuals from the NHLBI Exome Sequencing project (EA ESP). The left panel shows the variants identified in UK10K and the percentage shared with EA ESP. Both the total number of variants and the number within the EA ESP bait regions (intersection of bait sets) are given. The right panel shows the variants identified in EA ESP and the percentage shared with UK10K. Both the total number of variants, and the number within the UK10K baits after removing any that failed UK10K quality control, are given. There is some overlap in the ranges of AC and AF for EA ESP variants because different numbers of individuals were included.
Extended Data Figure 7
Extended Data Figure 7. UK10K-exomes, functional consequences.
ad, Percentage of SNVs in each allele frequency bin that are loss of function (a), functional (b), possibly functional (c) and other (d), when consequences are restricted to given subsets of transcripts, and where the most severe consequence in qualifying transcripts is used. Values are percentages of SNVs that have transcripts of a given type. Protein-coding is transcripts with a biotype of protein coding. High expression is transcripts with FPKM (fragments per kilobase of transcript per million mapped reads) ≥1 in any tissue. Widely expressed is transcripts with FPKM ≥ 1 in 16 tissues. Only low expression is transcripts expressed at FPKM < 1 in all 16 tissues where there were no transcripts with high expression in that variant. Expression was determined from the Illumina Body Map data set. Variants mapping to protein-coding transcripts <300-bp long or with missing or low quality expression data were excluded. Frequency bins are singletons and non-overlapping allele frequency ranges for allele counts above 1. Allele frequency is the frequency of the alternative allele. Multi-allelic sites were included with alternative alleles at the same site treated as separate variants. e, Counts of single nucleotide polymorphisms in each consequence class by allele frequency and transcript subset.
Extended Data Figure 8
Extended Data Figure 8. UK10K-cohorts, genotype and phenotype similarities within and between regions.
a, b, Dot plots show the genetic (a) and phenotypic distribution (b) of the relationships of 1,139 unrelated TwinsUK individuals by their regional place of birth. To determine the genetic relationships we used the mean number of shared alleles between two individuals within and between regions for allele counts (AC) 2 to 7, where AC is calculated from the whole data set of 3,781 samples. To determine phenotypic similarities we calculated the mean difference between the residualized phenotypes. Genetically-related individuals are more closely related within a region than between regions, while the phenotypic distance measure has similar distributions within and between regions. The mean shared alleles increase with increasing allele count, and simultaneously the within and between distributions converge. c, The five lowest P values for AC 2 to 7 obtained from Mantel tests to determine similarities between genotypes and phenotypes by region. P values were not significant after correcting for multiple testing using the FDR method. Full trait names are given in Supplementary Table 1.
Extended Data Figure 9
Extended Data Figure 9. UK10K-cohorts, population fine structure in the TwinsUK sample.
a, Chunk length matrix for all UK10K defined geographic regions, calculated as described in the methods. The bottom 5 regions are merged in Box 1 Figure. b, Coancestry matrix for all UK10K defined geographic regions, calculated as described in the methods. c, Chunk length matrix for all UK10K FineSTRUCTURE inferred populations, calculated as described in the methods. d, Coancestry matrix for all UK10K FineSTRUCTURE inferred populations. Details on calculation of these parameters are described in Methods. e, Pairwise coincidence matrix for the UK10K FineSTRUCTURE MCMC run, showing the fraction of the 1,000 retained iterations from the posterior in which each pair of individuals is in the same population, averaged for each pair of populations. The full posterior is extremely complex, which is indicative of a continuous admixture cline rather than discrete populations. f, Sources distribution for the FineSTRUCTURE inferred populations with the full set of inferred populations and geographic labels. Geographic labels of London, Southeast, North Midland, Southern and Eastern are merged into South and East for Box 1 Figure. FSPop labels are given to populations inferred by FineSTRUCTURE, which are merged into the Pop labels as shown in the main Box 1 Figure. g, The f2 haplotype age analysis estimates the time to the most recent common ancestor (tMRCA) between the two haplotypes underlying a given observed variant of allele count 2 in all of the TwinsUK samples. The observed IBD segment length around each f2 variant estimates the tMRCA, using an explicit model parameterized by the recombination and the mutation rates. Shown is the map of the UK with all regions used in this analysis depicted by their location, and lines colour-coding the observed median tMRCA of f2 haplotypes.

References

    1. Manolio TA. Bringing genome-wide association findings into clinical use. Nature Rev. Genet. 2013;14:549–558. doi: 10.1038/nrg3523. - DOI - PubMed
    1. Voight BF, et al. The metabochip, a custom genotyping array for genetic studies of metabolic, cardiovascular, and anthropometric traits. PLoS Genet. 2012;8:e1002793. doi: 10.1371/journal.pgen.1002793. - DOI - PMC - PubMed
    1. Cortes A, Brown MA. Promise and pitfalls of the Immunochip. Arthritis Res. Ther. 2011;13:101. doi: 10.1186/ar3204. - DOI - PMC - PubMed
    1. Simons YB, Turchin MC, Pritchard JK, Sella G. The deleterious mutation load is insensitive to recent population history. Nature Genet. 2014;46:220–224. doi: 10.1038/ng.2896. - DOI - PMC - PubMed
    1. 1000 Genomes Project Consortium. A map of human genome variation from population-scale sequencing. Nature467, 1061–1073 (2010) - PMC - PubMed

Publication types

MeSH terms

Grants and funding