. 2015 Sep 14;10(9):e0136920.
doi: 10.1371/journal.pone.0136920. eCollection 2015.

Impact-Free Measurement of Microtubule Rotations on Kinesin and Cytoplasmic-Dynein Coated Surfaces

Affiliations

Impact-Free Measurement of Microtubule Rotations on Kinesin and Cytoplasmic-Dynein Coated Surfaces

Aniruddha Mitra et al. PLoS One. .

Abstract

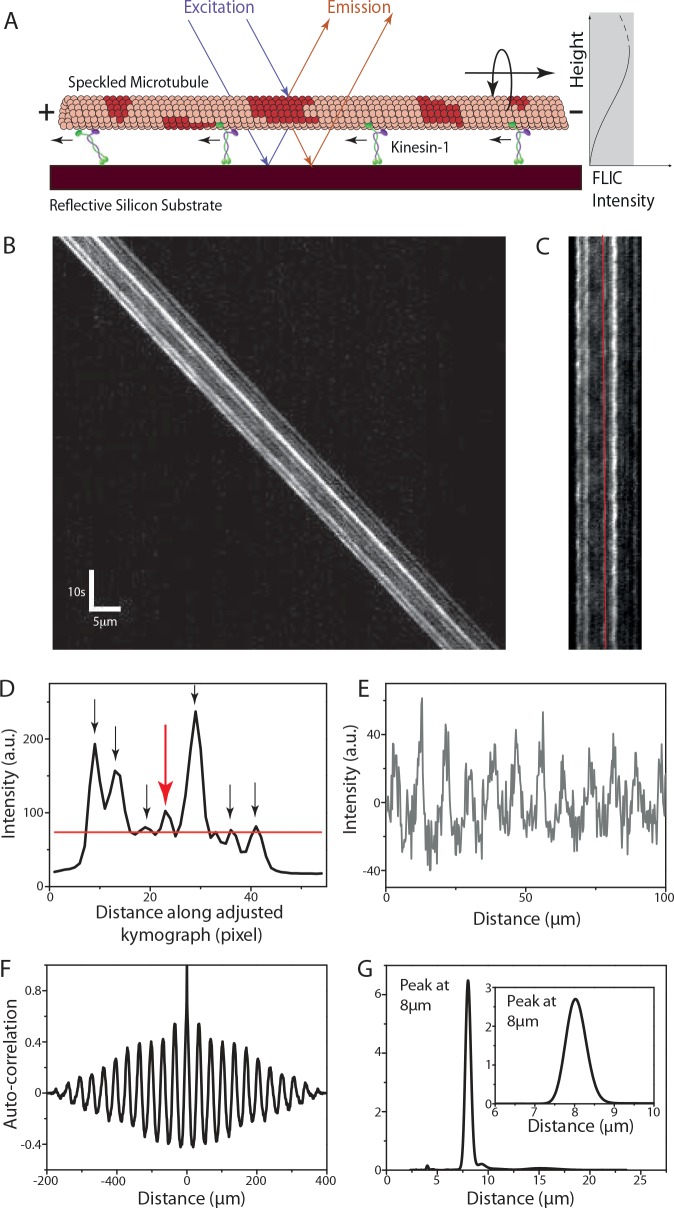
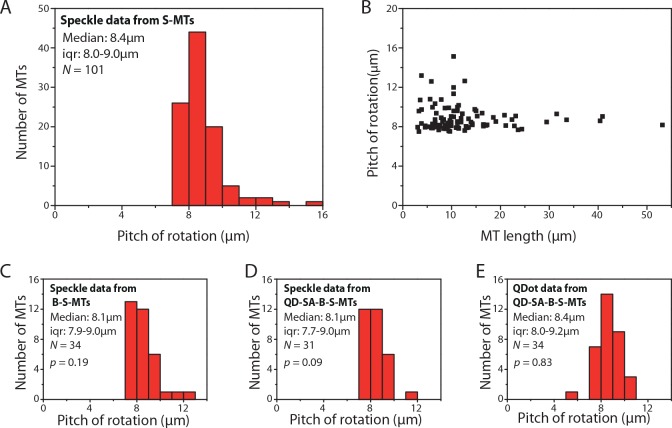
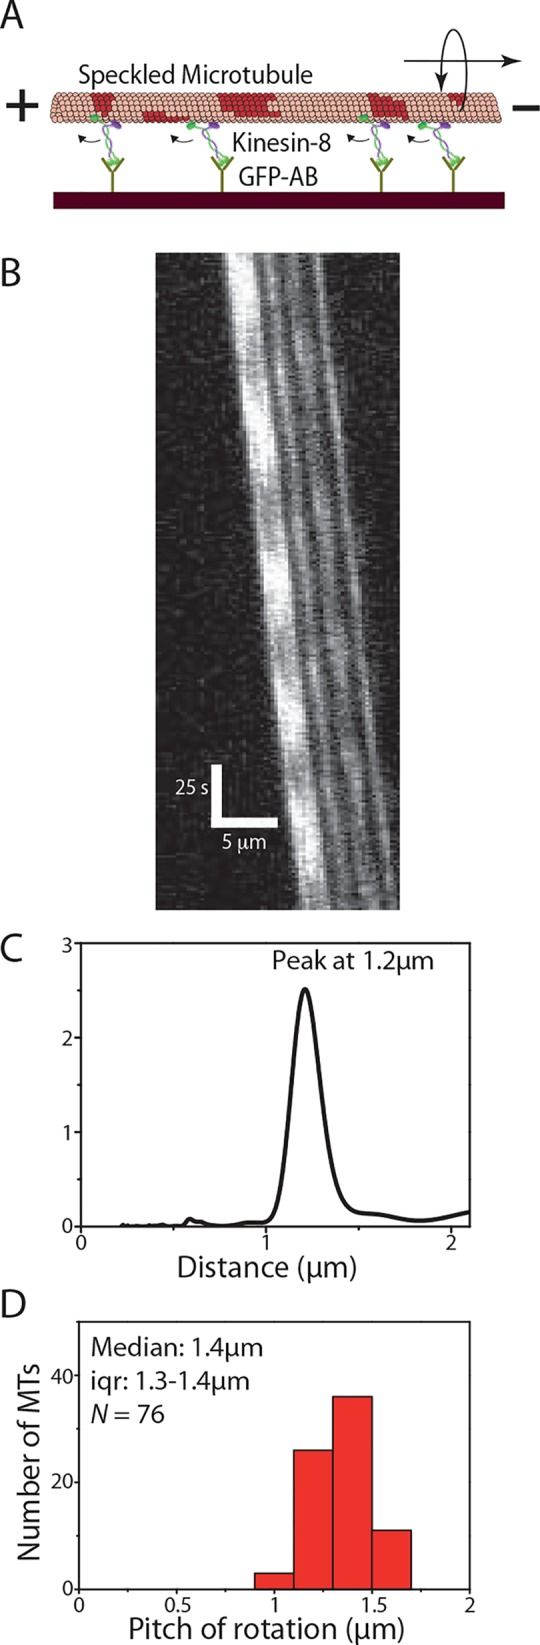
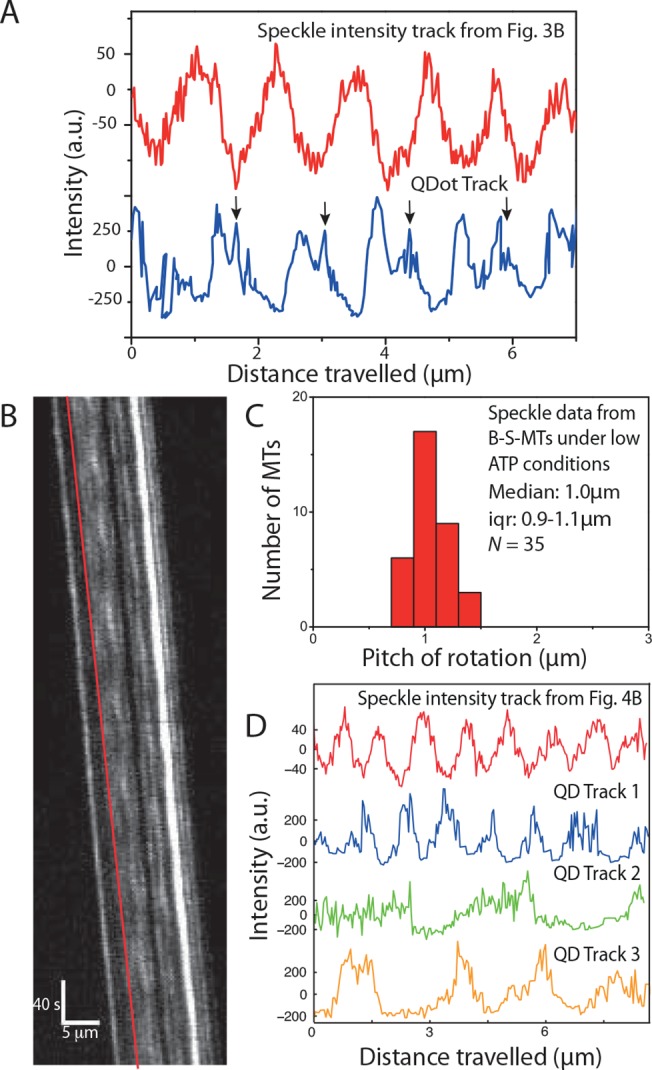
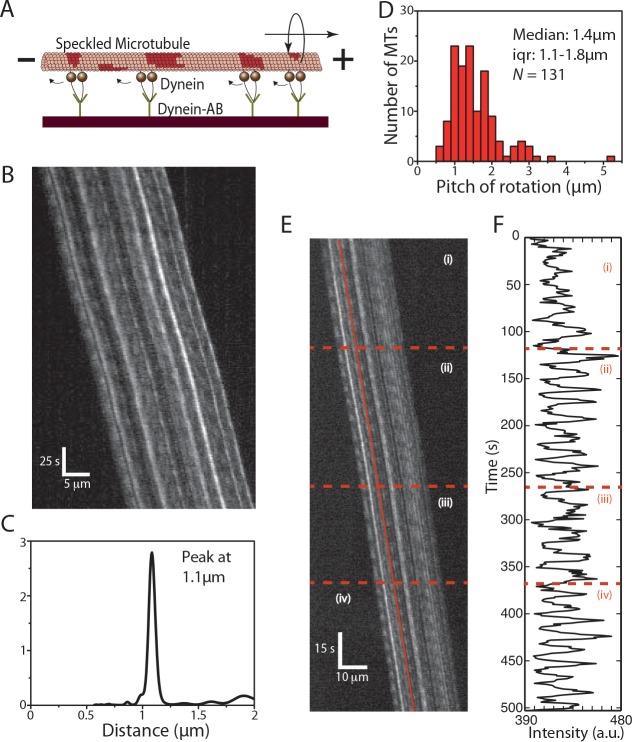
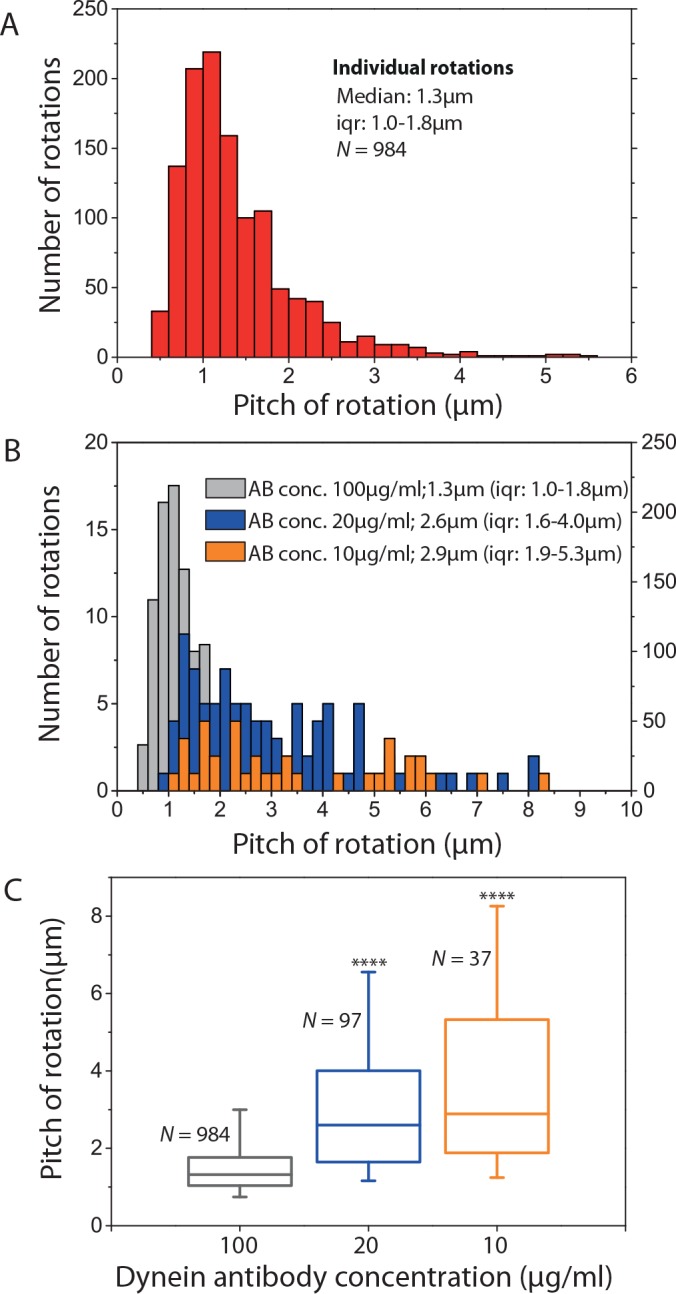
Knowledge about the three-dimensional stepping of motor proteins on the surface of microtubules (MTs) as well as the torsional components in their power strokes can be inferred from longitudinal MT rotations in gliding motility assays. In previous studies, optical detection of these rotations relied on the tracking of rather large optical probes present on the outer MT surface. However, these probes may act as obstacles for motor stepping and may prevent the unhindered rotation of the gliding MTs. To overcome these limitations, we devised a novel, impact-free method to detect MT rotations based on fluorescent speckles within the MT structure in combination with fluorescence-interference contrast microscopy. We (i) confirmed the rotational pitches of MTs gliding on surfaces coated by kinesin-1 and kinesin-8 motors, (ii) demonstrated the superiority of our method over previous approaches on kinesin-8 coated surfaces at low ATP concentration, and (iii) identified MT rotations driven by mammalian cytoplasmic dynein, indicating that during collective motion cytoplasmic dynein side-steps with a bias in one direction. Our novel method is easy to implement on any state-of-the-art fluorescence microscope and allows for high-throughput experiments.


Conflict of interest statement

Competing Interests: The authors have declared that no competing interests exist.

Figures

Fig 1
Fig 1. Analysis of the rotational pitch of a speckled MT (S-MT) gliding on kinesin-1.
(A) S-MTs glide on a reflective silicon substrate coated with kinesin-1 motor proteins. Due to fluorescence interference contrast (FLIC), the recorded intensities of the speckles vary as a function of height above the surface. Torsional motion of gliding S-MTs leads to periodic variations in the intensity of each speckle providing information about the rotational pitch. (B) Typical kymograph (space-time intensity plot) of a gliding S-MT. Each individual speckle shows a periodic intensity variation. (C) After background correction, the kymograph is straightened by shifting every time frame by the distance the S-MT moved. (D) Averaged intensity profile along the straightened kymograph from Fig 1C. The red line shows the mean intensity and only speckles with peaks above this line (indicated by the arrows) are analyzed. (E) Relative intensity profile (centered around zero) over distance for the speckle along the red line in Fig 1C and indicated by the red arrow in Fig 1D. This profile is obtained by translating the intensity profile over time to distance in order to account for velocity variations of the gliding S-MT. (F) Auto-correlation for the intensity plot in Fig 1E. (G) Combined power spectral density (PSD) curve for the seven speckles selected in Fig 1D (see S1 Fig for details on the other speckles), with peak at about 8μm. Inset: Power spectrum of the auto-correlation data in Fig 1F, with peak at about 8μm.
Fig 2
Fig 2. Kinesin-1 driven MT rotations.
(A) Histogram of the rotational pitches of S-MTs. Median pitch of rotation is 8.4μm (iqr 8.0–9.0μm; N = 101, where N is the number of MTs), which is in agreement with the supertwist pitch of GMP-CPP MTs. (B) Variation in rotational pitch with respect to S-MT length. (C) Histogram of rotational pitches of B-S-MTs obtained from the speckle signal of QD-SA-B-S-MTs. Median pitch of rotation is 8.1μm (iqr 7.9–9.0μm; N = 34; p = 0.19 with respect to S-MTs, Mann-Whitney U test). (D) Histogram of rotational pitches obtained from the speckle signal of QD-SA-B-S-MTs. Median pitch of rotation is 8.1μm (iqr 7.7–9.0μm; N = 31; p = 0.09; p’ = 0.56 with respect to B-S-MTs). (E) Histogram of rotational pitches obtained from tracking the QDots attached to QD-SA-B-S-MTs. Median pitch of rotation is 8.4μm (iqr 8.0–9.2μm; N = 34, where N is the number of QDots; p = 0.83).
Fig 3
Fig 3. Kinesin-8 driven MT rotations.
(A) S-MTs glide on a reflective silicon substrate coated with kinesin-8 (Kip3-eGFP) motor proteins specifically attached to the surface via GFP antibodies. (B) Typical kymograph of a gliding S-MT. (C) Combined PSD curve obtained from five speckles, with peak at about 1.2μm (data from B). (D) Histogram of the rotational pitches. Median pitch of rotation is 1.4μm (iqr 1.3–1.4μm; N = 76, where N is the number of MTs).
Fig 4
Fig 4. Influence of QDots coupled to MTs gliding on Kinesin-8.
(A) Comparison of a speckle intensity profile from the S-MT shown in Fig 3B (red) and the intensity profile of a QDot on a QD-SA-B-S-MT (blue). In the speckle intensities of the S-MT, the rotational periods are symmetric and regular, in contrast to the QDot signal, which is asymmetric with regular shoulders (indicated with black arrows), suggesting that the QDot interacts with the glass substrate before it can pass between the MT and the surface. (B) Typical kymograph of a B-S-MT gliding on Kip3-eGFP in low (10μM) ATP conditions. (C) Histogram of the rotational pitches of B-S-MTs gliding on Kip3-eGFP in low ATP conditions. Median pitch of rotation is 1.0μm (iqr 0.9–1.1μm; N = 35, where N is the number of MTs). (D) Intensity profile of the speckle on a B-S-MT indicated by the red line in the kymograph in Fig 4B and three example QDot intensity tracks obtained from QD-SA-B-S-MTs gliding on Kip3-eGFP under low ATP conditions. The FLIC intensity data indicates that the speckle on the uncoupled B-S-MT rotates with a pitch of about 1μm while the QDots rotate differently: Track 1 (blue) ≈ 1.1μm, Track 2 (green) ≈ 3μm, Track 3 (orange) ≈ 2.3μm.
Fig 5
Fig 5. Cytoplasmic dynein driven MT rotations.
(A) S-MTs glide on a reflective silicon substrate coated with cytoplasmic dynein motor proteins specifically attached to the surface via anti-dynein antibodies. (B) Typical kymograph of a gliding S-MT. (C) Combined PSD curve obtained from nine speckles, with peak at about 1.1μm. (D) Histogram of the rotational pitches, median pitch of rotation is 1.4μm (iqr 1.1–1.8μm; N = 131, where N is the number of rotation events from 75 kymographs), which indicates that the gliding MTs rotate with shorter pitches than the supertwist of the employed GMP-CPP MTs. (E) Typical kymograph of a gliding S-MT with varying rotational pitch. The S-MT motion is divided into four sections as can be seen in (F), which shows the FLIC intensity versus time for one of the speckles on the MT lattice (indicated by the red line in E). Initially the MT had a rotational pitch of 1.1μm (i), then the rotational pitch reduced to 0.9μm (ii), followed by a switch to 1.1μm (iii), and finally, a reduction to 0.7μm (iv).
Fig 6
Fig 6. Cytoplasmic dynein driven MT rotations at different motor densities.
(A) Histogram of individual rotations of S-MTs gliding on cytoplasmic dynein (antibody concentration 100μg/ml, analysis of the same kymographs as in Fig 5D except that the individual rotations were picked manually). (B) Histograms of individual rotations of S-MTs gliding on cytoplasmic dynein at different antibody concentrations and thus different motor densities (grey: antibody concentration 100μg/ml, same data as in A, y-axis on the right; blue: antibody concentration 20μg/ml, y-axis on the left; orange: antibody concentration 10μg/ml, y-axis on the left). (C) Box plot of the individual rotations for the three different antibody concentrations (grey: median 1.3μm, iqr 1.0–1.8μm, N = 984; blue: median 2.6μm, iqr 1.6–4.0μm, N = 97, p = 6.6 x 10⁻²⁶ with respect to grey data; orange, median 2.9μm, iqr 1.9–5.3μm, N = 37, p = 1.6 x 10⁻¹³ with respect to grey data). **** corresponds to p < 0.0001.

Similar articles

Cited by

References

    1. Vale RD, Funatsu T, Pierce DW, Romberg L, Harada Y, Yanagida T. Direct observation of single kinesin molecules moving along microtubules. Nature. 1996;380: 451–3. 10.1038/380451a0 - DOI - PMC - PubMed
    1. Yildiz A, Tomishige M, Vale RD, Selvin PR. Kinesin walks hand-over-hand. Science. 2004;303: 676–8. 10.1126/science.1093753 - DOI - PubMed
    1. Gelles J, Schnapp BJ, Sheetz MP. Tracking kinesin-driven movements with nanometre-scale precision. Nature. 1988;331: 450–3. 10.1038/331450a0 - DOI - PubMed
    1. Wang Z, Khan S, Sheetz MP. Single cytoplasmic dynein molecule movements: characterization and comparison with kinesin. Biophys J. 1995;69: 2011–23. 10.1016/S0006-3495(95)80071-8 - DOI - PMC - PubMed
    1. Svoboda K, Schmidt CF, Schnapp BJ, Block SM. Direct observation of kinesin stepping by optical trapping interferometry. Nature. 1993;365: 721–7. 10.1038/365721a0 - DOI - PubMed

Publication types

MeSH terms

LinkOut - more resources