. 2015 Dec;59(12):7335-45.
doi: 10.1128/AAC.01504-15. Epub 2015 Sep 14.

Antibiotic Selection Pressure Determination through Sequence-Based Metagenomics

Affiliations

Antibiotic Selection Pressure Determination through Sequence-Based Metagenomics

Matthias Willmann et al. Antimicrob Agents Chemother. 2015 Dec.

Abstract

The human gut forms a dynamic reservoir of antibiotic resistance genes (ARGs). Treatment with antimicrobial agents has a significant impact on the intestinal resistome and leads to enhanced horizontal transfer and selection of resistance. We have monitored the development of intestinal ARGs over a 6-day course of ciprofloxacin (Cp) treatment in two healthy individuals by using sequenced-based metagenomics and different ARG quantification methods. Fixed- and random-effect models were applied to determine the change in ARG abundance per defined daily dose of Cp as an expression of the respective selection pressure. Among various shifts in the composition of the intestinal resistome, we found in one individual a strong positive selection for class D beta-lactamases which were partly located on a mobile genetic element. Furthermore, a trend to a negative selection has been observed with class A beta-lactamases (-2.66 hits per million sample reads/defined daily dose; P = 0.06). By 4 weeks after the end of treatment, the composition of ARGs returned toward their initial state but to a different degree in both subjects. We present here a novel analysis algorithm for the determination of antibiotic selection pressure which can be applied in clinical settings to compare therapeutic regimens regarding their effect on the intestinal resistome. This information is of critical importance for clinicians to choose antimicrobial agents with a low selective force on their patients' intestinal ARGs, likely resulting in a diminished spread of resistance and a reduced burden of hospital-acquired infections with multidrug-resistant pathogens.


Figures

FIG 1
FIG 1
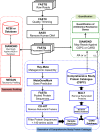
Flowchart of the major analysis steps, including databases and construction of the comprehensive study protein catalogue.
FIG 2
FIG 2
Comparison of real-time PCR with metagenomic quantification methodologies. tetQ (A and B) and cblA (C and D) genes were quantified using real-time PCR and metagenomic methods for both subjects. Gene abundance was normalized to a value of 1 for the highest abundance in all samples (y axis). All methods reveal similar values at each point and an equivalent progression under treatment and over time.
FIG 3
FIG 3
Principal component analysis (PCA) of antibiotic resistance composition based on ω values. (A to C) Graphs encompass all samples of subject 1 (S1) and subject 2 (S2), with colors progressing from darker to lighter shades at later sampling points. Numbers adjacent to each sample indicate the actual sampling day before (Pre Cp), during (Cp), or after treatment with ciprofloxacin (Post Cp). (D) The variance fraction of each principal component is denoted, with the first principle component (PCA 1) comprising 51.2% of the overall variance and the first three components together comprising 83.2%.
FIG 4
FIG 4
Abundance profiles of antibiotic resistance gene groups (ω and ωC). (A to H) Metagenomic quantification values ω (continuous line) and ωC (dotted line) for various groups of antibiotic resistance genes (ARGs) are displayed in hits per million sample reads (hmr) over all sampling time points. Subject 1 (S1) is indicated by blue and subject 2 (S2) by orange. Day 0 is the baseline sample before treatment, followed by samples from days 1, 3, and 6 of Cp treatment. The final two samples were collected 2 and 28 days after treatment. (I) Comparison of the log-transformed normalized selection pressure (Oi) for all groups of ARGs reveals the strongest impact of ciprofloxacin treatment on class D BL (class D beta-lactamases) and glycopeptides. Positive values represent a positive selection, and negative values a negative selection. Values are based on ω.
FIG 5
FIG 5
Alpha species diversity statistics. Two measures of alpha diversity estimation (Shannon and Simpson indexes) were applied for subject 1 (S1) and subject 2 (S2) after rarefying to the same number of reads for all samples. Diversity index values are shown on the y axis, while the x axis reflects sampling time points.
FIG 6
FIG 6
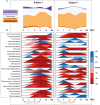
Microbiota community evolution over the course of ciprofloxacin treatment. Computations were performed after normalization to an equal number of reads for all samples. (A) Stream plots show the phylogenetic dynamics of the five most abundant phyla in subjects 1 and 2. The width of the stream is directly proportional to the phylum abundance. Values are smoothed using a square root transformation of the normalized read counts. Stream plots were generated using the streamgraph htmlwidget R package. (B) Horizon plots are displayed for 26 phyla over the time of ciprofloxacin treatment and afterwards. Color changes to red indicate a decreasing abundance compared with the baseline sample (day 0), and changes to blue indicate increasing abundance. Color intensity corresponds to the degree of change. Dark colors reflect a sharp change and light colors a mild change, as also indicated by the bar on the right that shows the magnitude of changes (Δ values; see Materials and Methods for details). Horizon plots were generated using the lattice extra R package.

References

    1. European Centre for Disease Prevention and Control. 2014. Point prevalence survey of healthcare-associated infections and antimicrobial use in European long-term care facilities. April–May 2013. European Centre for Disease Prevention and Control, Stockholm, Sweden.
    1. Magiorakos AP, Suetens C, Monnet DL, Gagliotti C, Heuer OE. 2013. The rise of carbapenem resistance in Europe: just the tip of the iceberg? Antimicrob Resist Infect Control 2:6. doi:10.1186/2047-2994-2-6. - DOI - PMC - PubMed
    1. Forslund K, Sunagawa S, Kultima JR, Mende DR, Arumugam M, Typas A, Bork P. 2013. Country-specific antibiotic use practices impact the human gut resistome. Genome Res 23:1163–1169. doi:10.1101/gr.155465.113. - DOI - PMC - PubMed
    1. Sommer MO, Dantas G, Church GM. 2009. Functional characterization of the antibiotic resistance reservoir in the human microflora. Science 325:1128–1131. doi:10.1126/science.1176950. - DOI - PMC - PubMed
    1. Davies J, Davies D. 2010. Origins and evolution of antibiotic resistance. Microbiol Mol Biol Rev 74:417–433. doi:10.1128/MMBR.00016-10. - DOI - PMC - PubMed

Publication types

MeSH terms