. 2015 Sep 15:6:8314.
doi: 10.1038/ncomms9314.

How Leiomodin and Tropomodulin use a common fold for different actin assembly functions

Affiliations

How Leiomodin and Tropomodulin use a common fold for different actin assembly functions

Malgorzata Boczkowska et al. Nat Commun. .

Abstract

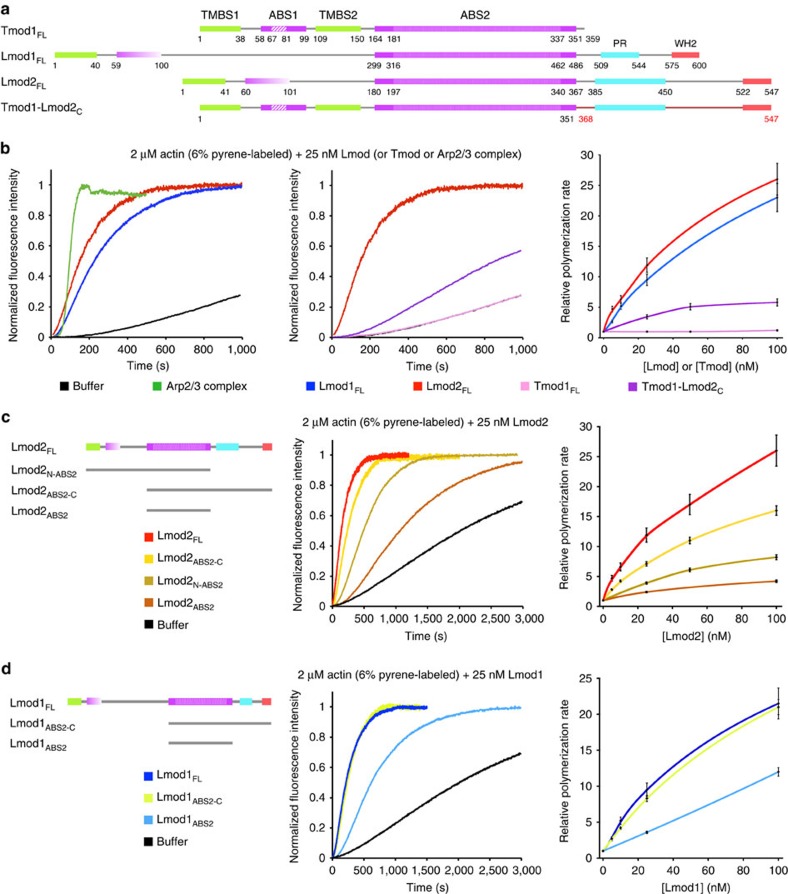
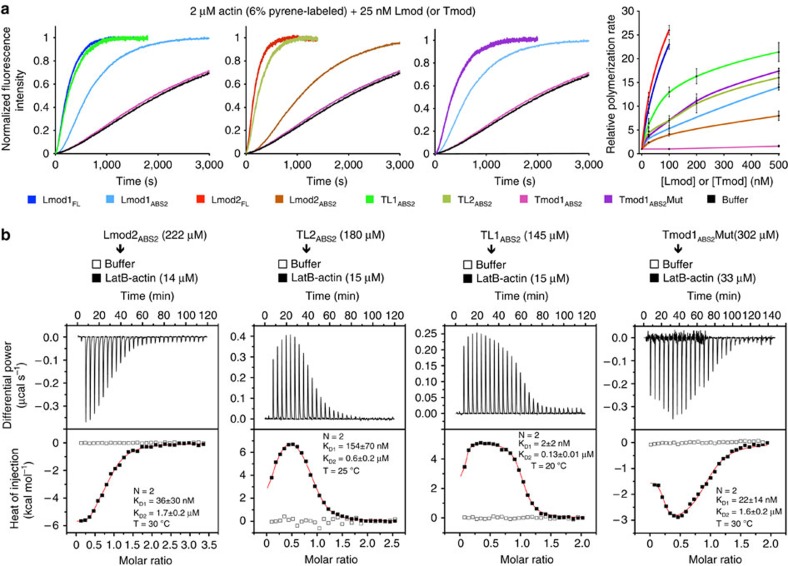
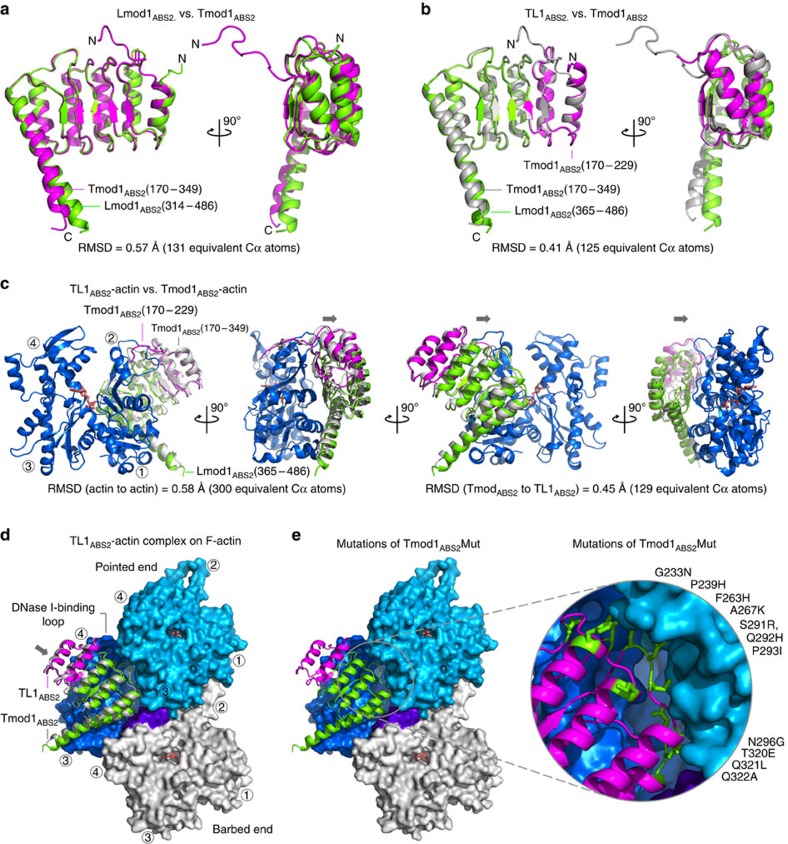
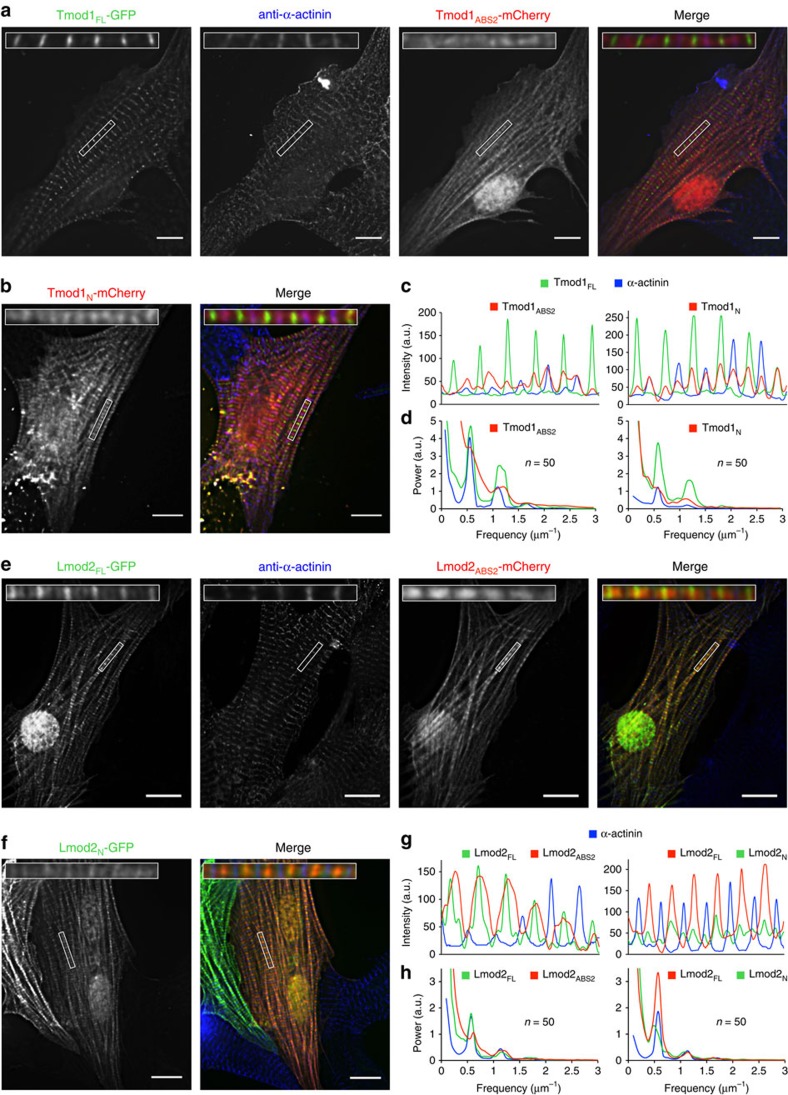
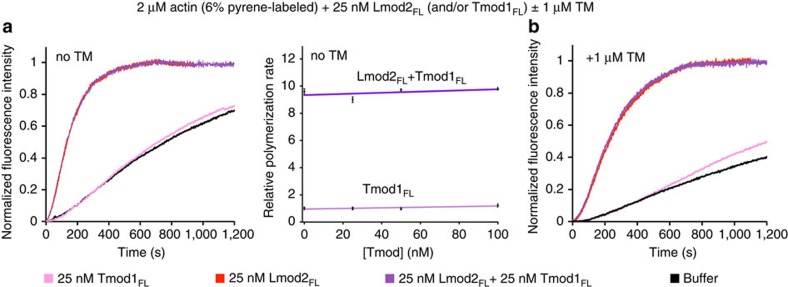
How proteins sharing a common fold have evolved different functions is a fundamental question in biology. Tropomodulins (Tmods) are prototypical actin filament pointed-end-capping proteins, whereas their homologues, Leiomodins (Lmods), are powerful filament nucleators. We show that Tmods and Lmods do not compete biochemically, and display similar but distinct localization in sarcomeres. Changes along the polypeptide chains of Tmods and Lmods exquisitely adapt their functions for capping versus nucleation. Tmods have alternating tropomyosin (TM)- and actin-binding sites (TMBS1, ABS1, TMBS2 and ABS2). Lmods additionally contain a C-terminal extension featuring an actin-binding WH2 domain. Unexpectedly, the different activities of Tmods and Lmods do not arise from the Lmod-specific extension. Instead, nucleation by Lmods depends on two major adaptations-the loss of pointed-end-capping elements present in Tmods and the specialization of the highly conserved ABS2 for recruitment of two or more actin subunits. The WH2 domain plays only an auxiliary role in nucleation.


Figures

Figure 1
Figure 1. Domains of Lmod and Tmod and actin nucleation.
(a) Domain organization of Tmod1 and Lmods, and design of the Tmod1–Lmod2c hybrid construct. Numbers under the diagrams indicate the boundaries of domains. For Tmod1, the helix of ABS1 (aa 67–81) and the LRR portion of ABS2 (aa 181–337) are highlighted. (b) Nucleation activity of full-length Lmod1, Lmod2 and the hybrid construct Tmod1–Lmod2C as compared with Tmod1 and the Arp2/3 complex (25 nM, activated by 100 nM N-WASP WCA). The left two graphs show time courses of polymerization of 2 μM Mg–ATP–actin (6% pyrene labelled) in the presence of 25 nM of the indicated proteins (colour coded) or the buffer control (black). The graph on the right shows the concentration dependence of the polymerization rates, displayed as the mean of three experiments±s.e.m. (c,d) Contribution of the various domains of Lmod1 (c) and Lmod2 (d) to the nucleation activity. The graphs on the left and the right show, respectively, the time course of polymerization of 2 μM Mg–ATP–actin in the presence of 25 nM Lmod fragments (colour coded) or buffer (black) and the concentration dependence of polymerization rates.
Figure 2
Figure 2. The different activities of Tmod and Lmod result from differences in their interactions with actin and TM.
(a) Sequence conservation analysis of Tmod and Lmod (see also Supplementary Fig. 1). Fifty Tmod (purple) and fifty Lmod (orange) sequences were aligned separately or together (blue), and residue conservation scores were calculated with the program Scorecons and plotted on the human Tmod1 sequence (the scores of residues absent in Tmod1 are not shown). The Tmod1 diagram on top indicates the boundaries of the TM- and actin-binding sites. Diagrams on the bottom illustrate ABS1 constructs, and hybrid Tmod1 (magenta)/Lmod (green) ABS2 constructs (TL1ABS2, TL2ABS2 and Tmod1ABS2Mut). The 11 residues of Tmod1ABS2 replaced by their Lmod1 counterparts (highlighted in green across the conservation plots) tend to be conserved among Lmods, but poorly conserved between Lmods and Tmods. (b) Concentration dependence of polymerization rates of Lmod1 and Lmod2 in the absence (solid lines) or the presence (broken lines) of 1 μM TM, displayed as the mean of three experiments±s.e.m. (c) ITC titrations of ABS1 constructs (as indicated) into LatB-actin. The experimental conditions are listed for each experiment, including temperature and the concentrations of ABS1 constructs in the syringe and LatB-actin in the cell. Open symbols correspond to titrations into buffer. Only the titration of Tmod1ABS1 could be fitted to a binding isotherm (red curve, fitting parameters inside graph), whereas Lmod1ABS1 and Lmod2ABS1 did not appear to bind (solid black symbols). Errors correspond to the s.d. of the fits.
Figure 3
Figure 3. Filament nucleation by ABS2.
(a) Time courses of polymerization and concentration dependence of polymerization rates of ABS2 constructs (as indicated) compared with full-length Lmod1 and Lmod2 (colour coded). Experimental conditions listed on top. (b) ITC titrations of ABS2 constructs (as indicated) into LatB-actin. The experimental conditions and fitting parameters are listed with each experiment. All the titrations fitted to a two-binding-site model (see also Supplementary Figs 3 and 4). Open symbols correspond to titrations into buffer. Errors correspond to the s.d. of the fits.
Figure 4
Figure 4. Structures of ABS2 constructs alone and bound to actin.
(a) Superimposition of the structures of Tmod1ABS2 (magenta) and Lmod1ABS2 (green), showing two orientations 90° apart (see Supplementary Movie 1). Note that the structures superimpose well overall, except for the N and C termini (the r.m.s.d. for equivalent Cα is indicated). (b) Superimposition of the structures of Tmod1ABS2 (grey) and TL1ABS2 (magenta and green, according to Fig. 2a) (see Supplementary Movie 2). (c) Superimposition of the structures of complexes of actin (blue) with the hybrid constructs GS1-Tmod1ABS2 (grey) and GS1-TL1ABS2 (magenta and green), showing four orientations 90° apart (see Supplementary Movie 3). GS1 is not shown, and actin is only shown for the complex with GS1-TL1ABS2. Arrows indicate a slight shift of TL1ABS2 on actin compared with Tmod1ABS2. (d) Superimposition of the complexes of actin with TL1ABS2 (magenta and green) and Tmod1ABS2 (grey) onto the second actin subunit at the pointed end of the actin filament. Only three subunits of the filament are shown (marine, blue, and grey–purple). ABS2 contacts all three subunits. The arrow indicates a slight shift of TL1ABS2 compared with Tmod1ABS2 that inserts it deeper into the groove formed at the interface between actin subunits. (e) Same as (d) but showing a close-up view of the location of the 11 residues of Tmod1ABS2 that were mutated to their Lmod1 counterparts in construct Tmod1ABS2Mut.
Figure 5
Figure 5. Localization of Tmod1 and Lmod2 constructs in sarcomeres.
(a,b) Cardiomyocytes co-transfected on day 1 with Tmod1FL-GFP and Tmod1ABS2-mCherry (or Tmod1N-mCherry), fixed 24 h after transfection, and stained with anti-α-actinin antibodies (Z-line marker). Note that Tmod1FL-GFP and α-actinin are shown separately only in part (a) but these markers are also present in part. (b). (c) Line-scans of each marker (colour coded) along a representative myofibril (insets in parts a,b). (d) Average power spectra resulting from one-dimensional (1D) fast Fourier transform (FFT) analysis of 50 line-scans from six cells transfected with Tmod1ABS2 (or Tmod1N). The frequency of the power peak for Tmod1FL and α-actinin is 0.572 μm−1, corresponding to a distance of 1.75 μm between M lines or Z lines, respectively. In contrast, there is no defined power peak in the spectra of Tmod1ABS2 or Tmod1N, reflecting a loss of periodicity in their localization. (e,f) Cardiomyocytes co-transfected with Lmod2FL-GFP and Lmod2ABS2-mCherry (or Lmod2FL-mCherry and Lmod2N-GFP) and stained with anti-α-actinin antibodies. (g) Line-scans of each marker (colour coded) along a representative myofibril (insets in parts e,f). (h) Average power spectra resulting from 1D FFT analysis of 50 line-scans from six cells transfected with Lmod2ABS2 (or Lmod2N). All the spectra show similar periodicity, with power peaks at 0.59 and 0.55 μm−1 for Lmod2ABS2 and Lmod2N, respectively. The Tmod1 and Lmod2 constructs are defined in Methods and in Fig. 1a. Scale bars, 10 μm.
Figure 6
Figure 6. Tmod1 does not compete with Lmod2 during nucleation with or without TM.
(a) Time course of polymerization and concentration dependence of polymerization rates by Lmod2FL in the presence of increasing concentrations of Tmod1FL. Experimental conditions listed on top. The concentration dependence is displayed as the mean of three experiments±s.e.m. (b) Time course of polymerization by Lmod2FL in the presence of Tmod1FL and TM.

References

    1. Yamashiro S., Gokhin D. S., Kimura S., Nowak R. B. & Fowler V. M. Tropomodulins: pointed-end capping proteins that regulate actin filament architecture in diverse cell types. Cytoskeleton (Hoboken) 69, 337–370 (2012). - PMC - PubMed
    1. Bennett V. & Baines A. J. Spectrin and ankyrin-based pathways: metazoan inventions for integrating cells into tissues. Physiol. Rev. 81, 1353–1392 (2001). - PubMed
    1. Greenfield N. J., Kostyukova A. S. & Hitchcock-DeGregori S. E. Structure and tropomyosin binding properties of the N-terminal capping domain of tropomodulin 1. Biophys. J. 88, 372–383 (2005). - PMC - PubMed
    1. Fowler V. M., Greenfield N. J. & Moyer J. Tropomodulin contains two actin filament pointed end-capping domains. J. Biol. Chem. 278, 40000–40009 (2003). - PubMed
    1. Kostyukova A. S., Choy A. & Rapp B. A. Tropomodulin binds two tropomyosins: a novel model for actin filament capping. Biochemistry 45, 12068–12075 (2006). - PMC - PubMed

Publication types