. 2015 Oct 30;290(44):26765-75.
doi: 10.1074/jbc.M115.661819. Epub 2015 Sep 14.

Pore hydration states of KcsA potassium channels in membranes

Affiliations

Pore hydration states of KcsA potassium channels in membranes

Joseph R Blasic et al. J Biol Chem. .

Abstract

Water-filled hydrophobic cavities in channel proteins serve as gateways for transfer of ions across membranes, but their properties are largely unknown. We determined water distributions along the conduction pores in two tetrameric channels embedded in lipid bilayers using neutron diffraction: potassium channel KcsA and the transmembrane domain of M2 protein of influenza A virus. For the KcsA channel in the closed state, the distribution of water is peaked in the middle of the membrane, showing water in the central cavity adjacent to the selectivity filter. This water is displaced by the channel blocker tetrabutyl-ammonium. The amount of water associated with the channel was quantified, using neutron diffraction and solid state NMR. In contrast, the M2 proton channel shows a V-shaped water profile across the membrane, with a narrow constriction at the center, like the hourglass shape of its internal surface. These two types of water distribution are therefore very different in their connectivity to the bulk water. The water and protein profiles determined here provide important evidence concerning conformation and hydration of channels in membranes and the potential role of pore hydration in channel gating.

Keywords: KcsA; M2; influenza virus; ion channels; lipid bilayer; neutron diffraction; nuclear magnetic resonance (NMR); potassium channel.


Figures

FIGURE 1.
FIGURE 1.
Sample morphology for neutron diffraction. a, representation of the protein organization in lamellar lipid samples for diffraction measurements. d is the repeat spacing of the lamellar samples. b, crystal structure of KcsA (4) (Protein Data Bank code 1K4C) showing water molecules coordinating the central ion in the cavity (dark blue spheres) and some peripheral water associated with the protein surface (light blue spheres). In one case, electron density maps show a water molecule forming a hydrogen-bonded bridge between the threonine (T-107) hydroxyl group and the K+ hydration complex (4). Potassium ions occupying the selectivity filter (S.F.) are shown as white spheres.
FIGURE 2.
FIGURE 2.
Functional reconstitution of KcsA in lipid membranes for lamellar diffraction. a, SDS-PAGE gel images of full-length (FL-KcsA) and C-terminal truncated KcsA (CTD-KcsA) after reconstitution in POPC/POPG liposomes. b, the activity of both full-length and C-terminally truncated KcsA were assayed using the potassium-sensitive fluorescent dye PBFI. Potassium trapped in proteoliposomes with KcsA is released at pH 4 (FL, green; CTD, purple) and not at pH 7 (FL, red; CTD, blue). The error bars are standard deviations (1 σ) of fluorescence intensity measurements. c, for control, all trapped potassium was released with Triton-X100 showing presence of K+ in all tested liposomes. d, samples of KcsA in complex with TBA showed significantly inhibited K+ release from proteoliposomes (green), at pH 4, compared with KcsA without TBA (purple) and is comparable with closed channels at pH 7 (orange). e, single-channel recordings of KcsA recovered from dry lamellar samples. Typical traces of transmembrane current recorded at ±40 mV upon addition of KcsA. The recorded currents are reproducible stepwise fluctuations, typical for ion channel activity, with average current amplitudes of 7.1 ± 0.5 and −5.3 ± 0.3 pA for 40 and −40 mV, respectively. f, the total current-voltage relationships for a few recorded single channels, superimposed with the KcsA current-voltage curve obtained by LeMasurier et al. (25) (200 mm KCl current-voltage relationship of KcsA is extracted from Fig. 2b of © LeMasurier et al. (25) and reproduced with permission from the Rockefeller University Press). Measured KcsA was incorporated in planar bilayers either from a solution of proteoliposomes assayed in a or after being recovered by resolubilization of lamellar samples. g, gradual addition of the blocker to the membrane containing multiple conductive units produced a decrease in single-channel activity, seen as reductions of the membrane currents.
FIGURE 3.
FIGURE 3.
Diffraction data from lamellar samples with KcsA. a, raw data from specular θ-2θ diffraction scans for various H2O/2H2O contrast conditions for KcsA/POPC/POPG (C/L = 1/235). b, same as in a, for KcsA/D31POPC/POPG. c, in-plane x-ray scattering data for the same KcsA/POPC/POPG sample shows two small peaks: a 4.7 Å peak caused by close neighbor lipid packing (chain diffraction) and a small broad peak at ∼51 Å caused by minor contribution from stacks being misaligned (e.g. smectic defects of the liquid crystalline sample). d, measurement of the mosaic spread (rocking curve) of a KcsA/POPC/POPG sample (C/L = 1/235), collected by keeping the detection angle at a fixed position (2θ) and rotating sample through angle (θ) to the incident beam. All of the measurements were done at 93% relative humidity and 23 °C. Repeat spacing for both samples (a–c) was 51.4 ± 0.1 Å. The repeat spacing and associated uncertainties were determined by a linear least square fitting of Bragg peak positions Q(h) versus diffraction index, h.
FIGURE 4.
FIGURE 4.
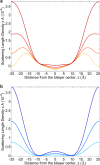
Water distribution in lipid membranes with KcsA. a, SLD distribution of a bilayer incorporating KcsA, in projection on the normal to the membrane. Samples contained C-terminal truncated KcsA, at a molar ratio of 1/235 channel/lipids in an equimolar mixture of POPC and POPG. Measurements were done at 93% relative humidity and 23 °C. The presence of water across the bilayer/channel structure is revealed by increasing the fraction of deuterated water in the H2O/2H2O mixtures: H2O (yellow), 20% 2H2O (orange), 50% 2H2O (light red), and 100% 2H2O (dark red). b, water distribution derived from H2O/2H2O deuterium difference analysis: from light to dark blue shades: 20, 50, and 100% 2H2O. Repeat spacing is 51.4 ± 0.1 Å. The structure factors are in supplemental Table 1.
FIGURE 5.
FIGURE 5.
Density profile of deuterated KcsA in bilayers. Uniformly deuterated KcsA to 65% deuterium was reconstituted in lipid bilayers of POPC/POPG for a target composition of 1/300 channel/lipids (Table 1). Deuterium difference analysis versus an analogous sample containing protonated KcsA singles out the protein topology across the bilayer (red curve). The water distribution shows a peak in the middle, consistent with results for other KcsA samples, of similar compositions (Fig. 4b). The water profiles are for increasing fractions of 2H2O: from light to dark blue: 20, 50, and 100%. Amplitude scale is only approximate, based on the high reproducibility of samples at this composition. Repeat spacing is 51.3 ± 0.1 Å.
FIGURE 6.
FIGURE 6.
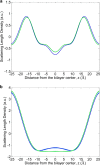
Water distribution in membranes with KcsA with or without TBA. a, SLD distributions of POPC bilayers containing KcsA with (green) and without tetrabutylammonium ions (blue), measured in H2O. b, water profiles of POPC/KcsA samples with (green) and without (blue) TBA. Profiles are for 100% 2H2O, 93% relative humidity, and 23 °C. The structure factors are in supplemental Tables S3 and S4. Lamellar repeats were 52.0 ± 0.2 Å (with TBA) and 52.3 ± 0.1 Å (without TBA).
FIGURE 7.
FIGURE 7.
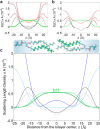
Deuterium analysis for scaling and bilayer structure determination. a, calibrated SLD. bilayer profiles of two homologous lipid samples with KcsA (C/L = 1/235) containing chain-deuterated POPC (D31-POPC/POPG 1/1) (red curves) and protonated POPC (H-POPC/POPG 1/1) (black curves), respectively. The samples were each measured in a series of H2O/2H2O contrast conditions (same color, increasing amplitudes: 100/0, 80/20, 50/50, and 0/100). Lipid chain (D31) profiles at different H2O/2H2O contrasts are overlapping (green). b, same as in a, for neat bilayers (without KcsA). Both D31 (red) and H (black) samples were measured in a series of H2O/2H2O contrasts as above, except for 0/100. c, calibrated SLD profiles for bilayers with KcsA (black) and neat bilayers (gray), in H2O. Also shown are the lipid chain (dark green, with KcsA; light green, without KcsA) and water profiles (dark blue, with KcsA; light blue, without KcsA).
FIGURE 8.
FIGURE 8.
Gaussian models of the water distributions at the membrane surface. a, same experimental water profiles as in Fig. 4b for bilayers with KcsA at increasing 2H2O (from light to dark blue: 20%, 50 and 100% 2H2O), shown on an expanded scale for better visibility of the uncertainty limits of the profiles (light blue bands). The uncertainties were calculated by a Monte Carlo sampling method (44) and include contributions from standard deviations in the structure factors and calibration factors caused by sample composition. The Gaussian model fitting (red) was applied simultaneously for all 2H2O contrasts. b, water profiles in the interbilayer space for samples with KcsA. Minimum set Gaussian distributions that can describe the experimental profiles (yellow) and their envelope (red), shown only for 100% 2H2O, for clarity. c, experimental water profiles for neat bilayers shown on an expanded scale (light blue, 20%; dark blue, 50% 2H2O), with uncertainty limits (light blue bands). d, water profiles in the interbilayer space for neat bilayers and Gaussian model fitting curves (red).
FIGURE 9.
FIGURE 9.
Water content and hydrogen to deuterium exchange determined by NMR. a and b, 1H-MAS NMR spectrum of POPC/POPG (1/1, mol/mol) bilayers (a) and of KcsA/POPC/POPG bilayers (b) hydrated at 93% relative humidity. Water content of samples was determined by spectral deconvolution of the water resonance at 4.8 ppm and lipid resonances. c, 1H-15N cross-polarization MAS NMR spectra of 15N-KcsA hydrated with H2O or 2H2O. Visible are the band of amide resonances centered at 120 ppm and its spinning sidebands at ±5 kHz (±61.7 ppm). d, crystal structure of KcsA (Protein Data Bank code 1K4C) (4). Only two opposing units of the tetramer are shown. The boundaries of the hydrocarbon region (yellow lines) were drawn approximately, based on the center of mass positions of two tryptophan (W) clusters, assumed to line up at the bilayer-water interfaces (45). Amide protons around the cavity within these boundaries (blue spheres) account for ∼25 per unit. Additional exchangeable protons are present on -OH groups of Thr-74, Thr-75, Thr-101, Thr-107 (green), and Ser-102 (purple), on the inner transmembrane helix and base of the selectivity filter. A single hydrophilic threonine residue is present on the outer transmembrane segment (green), at the position of the cavity.
FIGURE 10.
FIGURE 10.
Water distribution in the M2 proton channel. Water distribution determined by neutron diffraction for DLPC lipid bilayers with and without the M2 peptide. The DLPC/M2 peptide molar ratio is ¼. Relative humidity is 86%. Near the bilayer center, the water distribution is flat for DLPC lipid (gray) but distinctly V-shaped with the channel-forming M2 peptides present (red). The d-spacing is 44.50 Å for the DLPC bilayer and 39.25 Å for the DLPC + M2 peptide bilayer.

References

    1. Hilser V. J. (2011) Structural biology: finding the wet spots. Nature 469, 166–167 - PubMed
    1. Ball P. (2008) Water as an active constituent in cell biology. Chem. Rev. 108, 74–108 - PubMed
    1. Doyle D. A., Morais Cabral J., Pfuetzner R. A., Kuo A., Gulbis J. M., Cohen S. L., Chait B. T., and MacKinnon R. (1998) The structure of the potassium channel: molecular basis of K+ conduction and selectivity. Science 280, 69–77 - PubMed
    1. Zhou Y., Morais-Cabral J. H., Kaufman A., and MacKinnon R. (2001) Chemistry of ion coordination and hydration revealed by a K+ channel-Fab complex at 2.0 angstrom resolution. Nature 414, 43–48 - PubMed
    1. Yu F. H., Yarov-Yarovoy V., Gutman G. A., and Catterall W. A. (2005) Overview of molecular relationships in the voltage-gated ion channel superfamily. Pharmacol. Rev. 57, 387–395 - PubMed

Publication types

MeSH terms

Associated data