

Useful Interplay Between Spontaneous ADR Reports and Electronic Healthcare Records in Signal Detection
- PMID: 26370104
- PMCID: PMC4659852
- DOI: 10.1007/s40264-015-0341-5
Useful Interplay Between Spontaneous ADR Reports and Electronic Healthcare Records in Signal Detection
Abstract
Background and objective: Spontaneous reporting systems (SRSs) remain the cornerstone of post-marketing drug safety surveillance despite their well-known limitations. Judicious use of other available data sources is essential to enable better detection, strengthening and validation of signals. In this study, we investigated the potential of electronic healthcare records (EHRs) to be used alongside an SRS as an independent system, with the aim of improving signal detection.
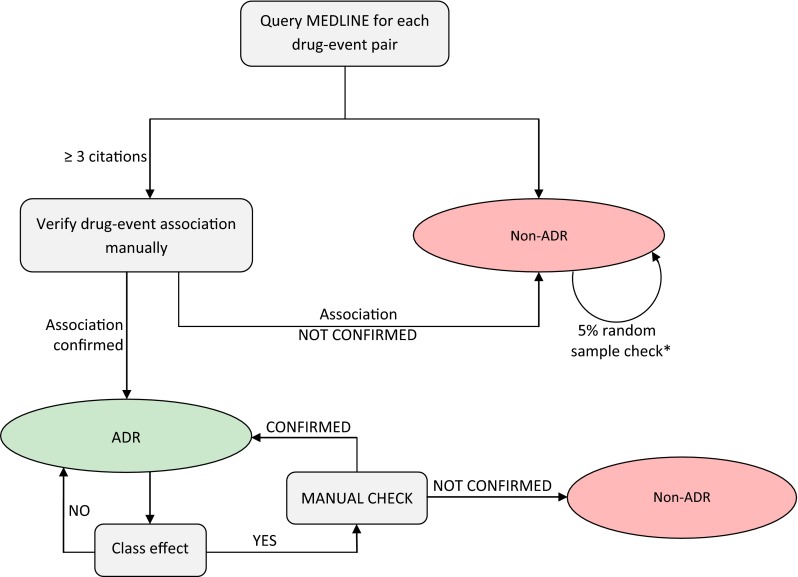
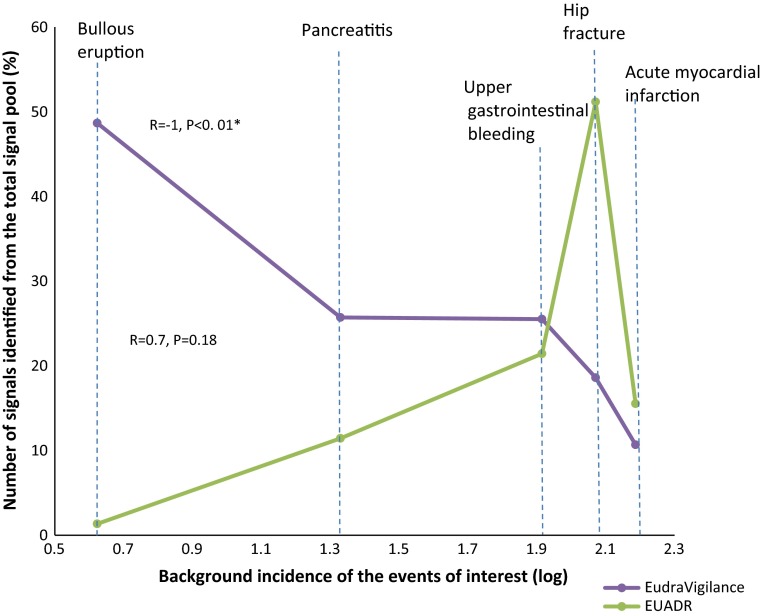
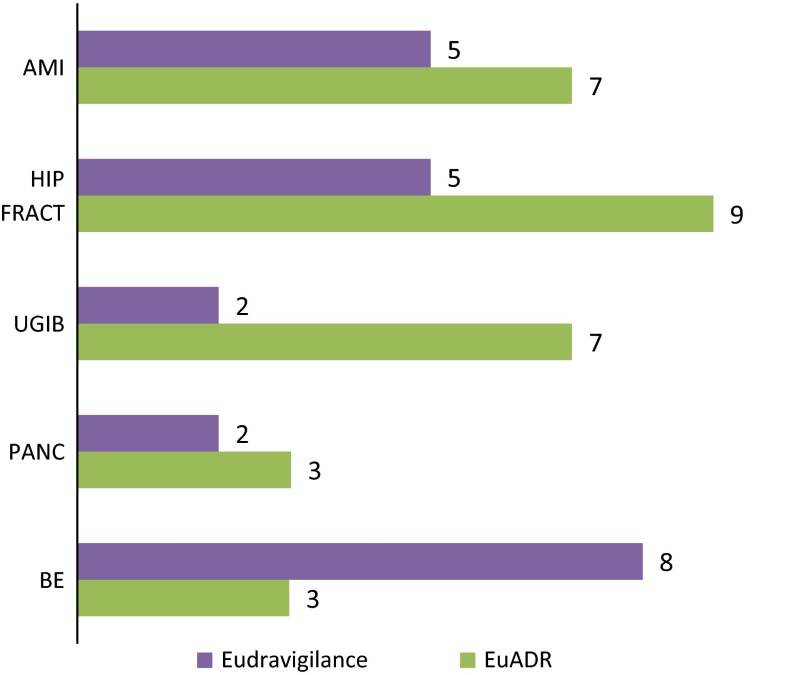
Methods: A signal detection strategy, focused on a limited set of adverse events deemed important in pharmacovigilance, was performed retrospectively in two data sources-(1) the Exploring and Understanding Adverse Drug Reactions (EU-ADR) database network and (2) the EudraVigilance database-using data between 2000 and 2010. Five events were considered for analysis: (1) acute myocardial infarction (AMI); (2) bullous eruption; (3) hip fracture; (4) acute pancreatitis; and (5) upper gastrointestinal bleeding (UGIB). Potential signals identified in each system were verified using the current published literature. The complementarity of the two systems to detect signals was expressed as the percentage of the unilaterally identified signals out of the total number of confirmed signals. As a proxy for the associated costs, the number of signals that needed to be reviewed to detect one true signal (number needed to detect [NND]) was calculated. The relationship between the background frequency of the events and the capability of each system to detect signals was also investigated.
Results: The contribution of each system to signal detection appeared to be correlated with the background incidence of the events, being directly proportional to the incidence in EU-ADR and inversely proportional in EudraVigilance. EudraVigilance was particularly valuable in identifying bullous eruption and acute pancreatitis (71 and 42 % of signals were correctly identified from the total pool of known associations, respectively), while EU-ADR was most useful in identifying hip fractures (60 %). Both systems contributed reasonably well to identification of signals related to UGIB (45 % in EudraVigilance, 40 % in EU-ADR) but only fairly for signals related to AMI (25 % in EU-ADR, 20 % in EudraVigilance). The costs associated with detection of signals were variable across events; however, it was often more costly to detect safety signals in EU-ADR than in EudraVigilance (median NNDs: 7 versus 5).
Conclusion: An EHR-based system may have additional value for signal detection, alongside already established systems, especially in the presence of adverse events with a high background incidence. While the SRS appeared to be more cost effective overall, for some events the costs associated with signal detection in the EHR might be justifiable.
Figures


References
-
- CIOMS Working Group . Practical aspects of signal detection in pharmacovigilance: report of CIOMS Working Group VIII. Geneva: Council for International Organizations of Medical Sciences; 2010.
Publication types
MeSH terms
LinkOut - more resources
Full Text Sources
Other Literature Sources
Research Materials
