

Paradoxical effects of partial leptin deficiency on bone in growing female mice
- PMID: 26370912
- PMCID: PMC4651779
- DOI: 10.1002/ar.23267
Paradoxical effects of partial leptin deficiency on bone in growing female mice
Abstract
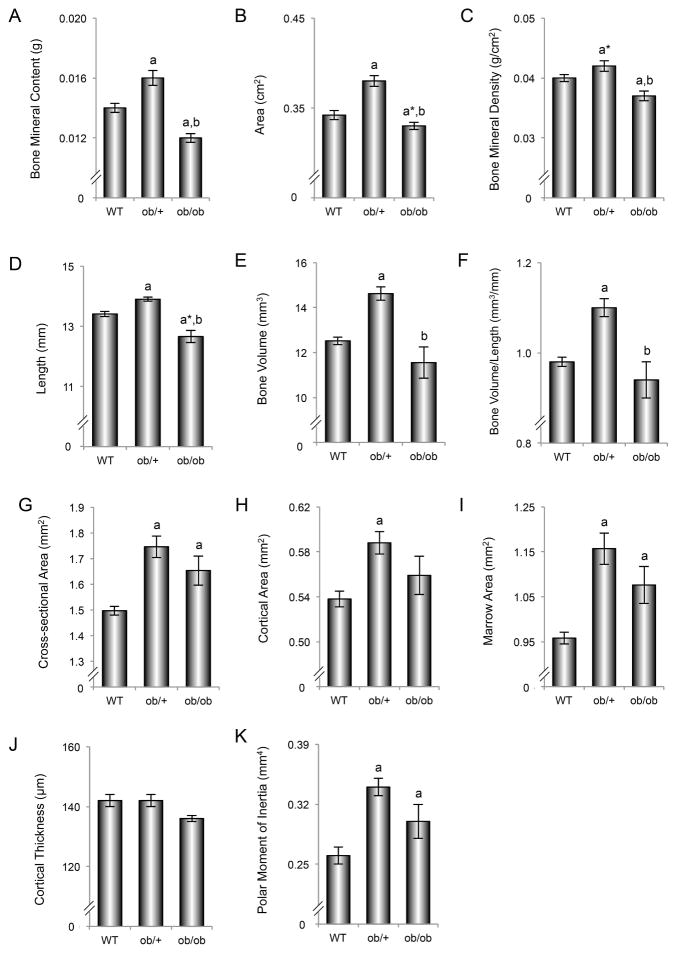
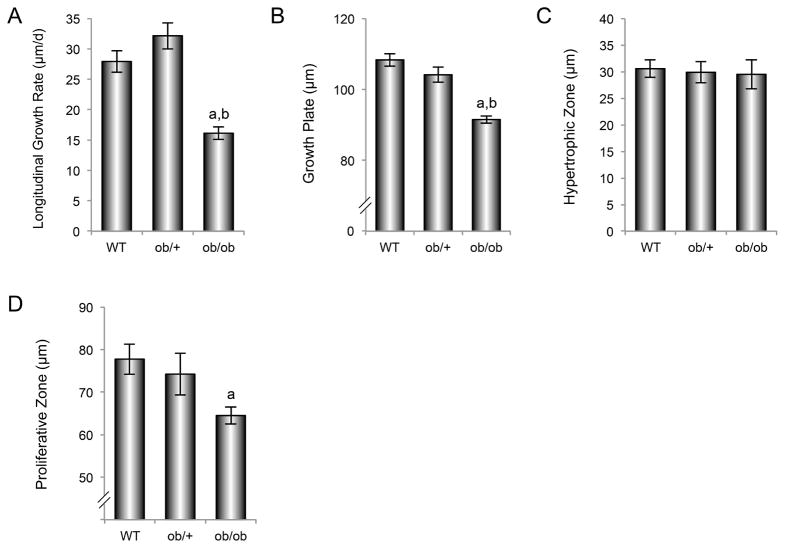
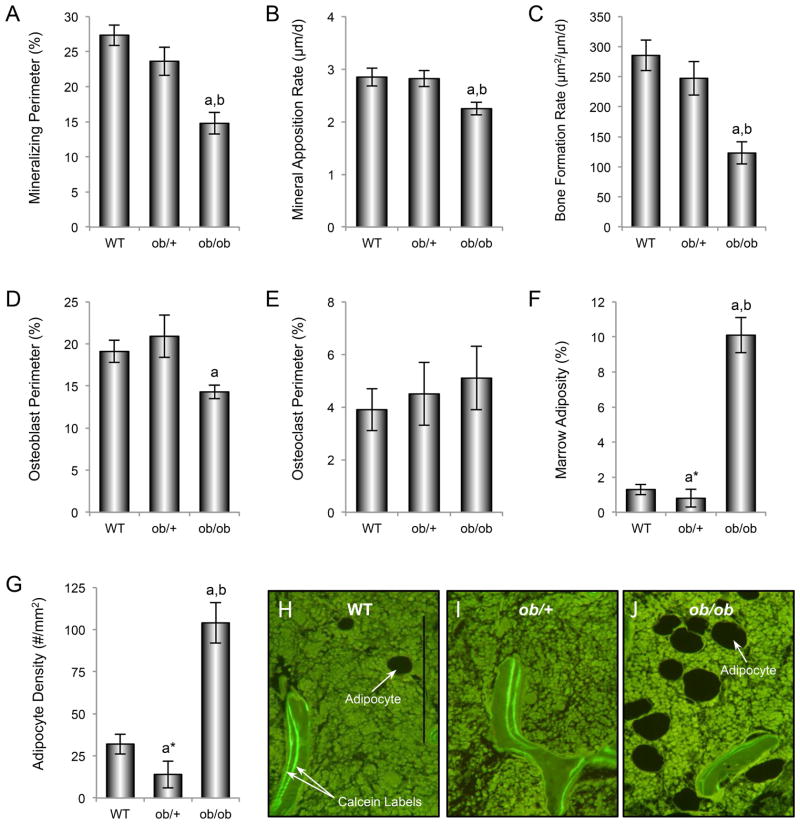
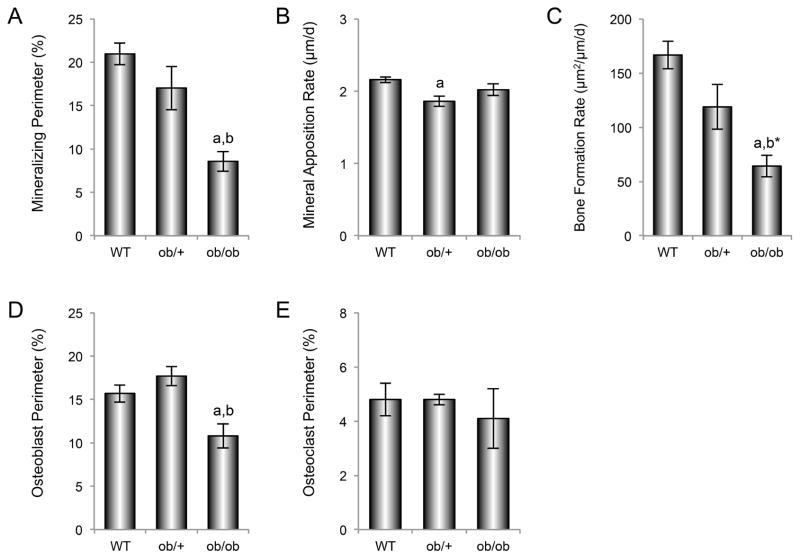
Morbidly obese, leptin-deficient ob/ob mice display low bone mass, mild osteoclast-rich osteopetrosis, and increased bone marrow adiposity. While partial leptin deficiency results in increased weight, the skeletal manifestations of partial leptin deficiency are less well defined. We therefore analyzed femora and lumbar vertebrae in growing (7-week-old) female C57BL/6 wildtype (WT) mice, partial leptin-deficient ob/+ mice, and leptin-deficient ob/ob mice. The bones were evaluated by dual energy absorptiometry, microcomputed tomography and histomorphometry. As expected, ob/+ mice were heavier, had more white adipose tissue, and lower serum leptin than WT mice, but were lighter and had less white adipose tissue than ob/ob mice. With a few exceptions, cancellous bone architecture, cell (osteoblast, osteoclast, and adipocyte), and dynamic measurements did not differ between WT and ob/+ mice. In contrast, compared to WT and ob/+ mice, ob/ob mice had lower cancellous bone volume fraction, and higher bone marrow adiposity in the femur metaphysis, and higher cancellous bone volume fraction in lumbar vertebra. Paradoxically, ob/+ mice had greater femoral bone volume than either WT or ob/ob mice. There was a positive correlation between body weight and femur volume in all three genotypes. However, the positive effect of weight on bone occurred with lower body weight in leptin-producing mice. The paradoxical differences in bone size among WT, ob/+, and ob/ob mice may be explained if leptin, in addition to stimulating bone growth and cancellous bone turnover, acts to lower the set-point at which increased body weight leads to a commensurate increase in bone size.
Keywords: histomorphometry; microcomputed tomography; ob/+ mice; ob/ob mice; obesity.
© 2015 Wiley Periodicals, Inc.
Figures


Similar articles
-
Morbid obesity attenuates the skeletal abnormalities associated with leptin deficiency in mice.J Endocrinol. 2014 Oct;223(1):M1-15. doi: 10.1530/JOE-14-0224. Epub 2014 Jul 2. J Endocrinol. 2014. PMID: 24990938 Free PMC article.
-
Leptin deficiency produces contrasting phenotypes in bones of the limb and spine.Bone. 2004 Mar;34(3):376-83. doi: 10.1016/j.bone.2003.11.020. Bone. 2004. PMID: 15003785
-
Body mass influences cortical bone mass independent of leptin signaling.Bone. 2009 Mar;44(3):404-12. doi: 10.1016/j.bone.2008.10.058. Epub 2008 Nov 27. Bone. 2009. PMID: 19095090 Free PMC article.
-
Leptin and bone: does the brain control bone biology?Nutr Rev. 2000 Jul;58(7):209-11. doi: 10.1111/j.1753-4887.2000.tb01864.x. Nutr Rev. 2000. PMID: 10941257 Review.
-
Effects of Leptin on the Skeleton.Endocr Rev. 2018 Dec 1;39(6):938-959. doi: 10.1210/er.2017-00226. Endocr Rev. 2018. PMID: 30184053 Review.
Cited by
-
Analysis of gut microbiome composition, function, and phenotype in patients with osteoarthritis.Front Microbiol. 2022 Nov 25;13:980591. doi: 10.3389/fmicb.2022.980591. eCollection 2022. Front Microbiol. 2022. PMID: 36504782 Free PMC article.
-
RIP140 in monocytes/macrophages regulates osteoclast differentiation and bone homeostasis.JCI Insight. 2017 Apr 6;2(7):e90517. doi: 10.1172/jci.insight.90517. JCI Insight. 2017. PMID: 28405613 Free PMC article.
-
Influence of body weight on bone mass, architecture and turnover.J Endocrinol. 2016 Sep;230(3):R115-30. doi: 10.1530/JOE-16-0089. Epub 2016 Jun 27. J Endocrinol. 2016. PMID: 27352896 Free PMC article. Review.
-
Effect of Leptin Deficiency on the Skeletal Response to Hindlimb Unloading in Adult Male Mice.Sci Rep. 2019 Jun 27;9(1):9336. doi: 10.1038/s41598-019-45587-0. Sci Rep. 2019. PMID: 31249331 Free PMC article.
-
Hypothalamic Leptin Gene Therapy Reduces Bone Marrow Adiposity in ob/ob Mice Fed Regular and High-Fat Diets.Front Endocrinol (Lausanne). 2016 Aug 16;7:110. doi: 10.3389/fendo.2016.00110. eCollection 2016. Front Endocrinol (Lausanne). 2016. PMID: 27579023 Free PMC article.
References
-
- Abelenda M, Puerta M. Leptin release is decreased in white adipocytes isolated from progesterone-treated rats. Endocrine research. 2004;30:335–342. - PubMed
-
- Ahima RS, Flier JS. Leptin. Annual review of physiology. 2000;62:413–437. - PubMed
-
- Baek K, Bloomfield SA. Beta-adrenergic blockade and leptin replacement effectively mitigate disuse bone loss. Journal of bone and mineral research. 2009;24:792–799. - PubMed
-
- Barr VA, Malide D, Zarnowski MJ, Taylor SI, Cushman SW. Insulin stimulates both leptin secretion and production by rat white adipose tissue. Endocrinology. 1997;138:4463–4472. - PubMed
-
- Bartell SM, Rayalam S, Ambati S, Gaddam DR, Hartzell DL, Hamrick M, She JX, Della-Fera MA, Baile CA. Central (ICV) leptin injection increases bone formation, bone mineral density, muscle mass, serum IGF-1, and the expression of osteogenic genes in leptin-deficient ob/ob mice. Journal of bone and mineral research. 2011;26:1710–1720. - PubMed
Publication types
MeSH terms
Substances
Grants and funding
LinkOut - more resources
Full Text Sources
Other Literature Sources
Molecular Biology Databases
Research Materials
Miscellaneous
