. 2015 Sep 7;16(9):21153-76.
doi: 10.3390/ijms160921153.

Different Roles of GRP78 on Cell Proliferation and Apoptosis in Cartilage Development

Affiliations

Different Roles of GRP78 on Cell Proliferation and Apoptosis in Cartilage Development

Zhangyuan Xiong et al. Int J Mol Sci. .

Abstract

Eukaryotic cells possess several mechanisms to adapt to endoplasmic reticulum (ER) stress and thereby survive. ER stress activates a set of signaling pathways collectively termed as the unfolded protein response (UPR). We previously reported that Bone morphogenetic protein 2 (BMP2) mediates mild ER stress and activates UPR signal molecules in chondrogenesis. The mammalian UPR protects the cell against the stress of misfolded proteins in the endoplasmic reticulum. Failure to adapt to ER stress causes the UPR to trigger apoptosis. Glucose regulated protein 78 (GRP78), as an important molecular chaperone in UPR signaling pathways, is responsible for binding to misfolded or unfolded protein during ER stress. However the influence on GRP78 in BMP2-induced chondrocyte differentiation has not yet been elucidated and the molecular mechanism underlyng these processes remain unexplored. Herein we demonstrate that overexpression of GRP78 enhanced cell proliferation in chondrocyte development with G1 phase advance, S phase increasing and G2-M phase transition. Furthermore, overexpression of GRP78 inhibited ER stress-mediated apoptosis and then reduced apoptosis in chondrogenesis induced by BMP2, as assayed by cleaved caspase3, caspase12, C/EBP homologous protein (CHOP/DDIT3/GADD153), p-JNK (phosphorylated c-Jun N-terminal kinase) expression during the course of chondrocyte differentiation by Western blot. In addition, flow cytometry (FCM) assay, terminal deoxynucleotidyl transferase-mediated deoxyuridine triphosphate-biotin nick end-labeling (TUNEL) assay and immune-histochemistry analysis also proved this result in vitro and in vivo. It was demonstrated that GRP78 knockdown via siRNA activated the ER stress-specific caspase cascade in developing chondrocyte tissue. Collectively, these findings reveal a novel critical role of GRP78 in regulating ER stress-mediated apoptosis in cartilage development and the molecular mechanisms involved.

Keywords: ER stress; GRP78; apoptosis; cartilage development; unfolded protein response.


Figures

Figure 1
Figure 1
Expression of GRP78 in C3H10T1/2 cells after infected with Ad-GRP78 or Ad-siGRP78. (A). Analysis of GRP78 mRNA level with RT-PCR. Lane 1: NC; lane 2: Ad-GFP control; lane 3: Ad-GRP78. C3H10T1/2 cells infected with Ad-GRP78 and control Ad-GFP, NC group were cultured for 48 h and GRP78 mRNA expression was determined by real-time PCR; (B). Quantification of relative levels of GRP78 in C3H10T1/2 cells. The normalized values were then calibrated against the control value, data were expressed as means ± S.D. (n = 3). The left bar indicates a relative level of GRP78 mRNA of 1; * p < 0.05; (C) Analysis of GRP78 mRNA level with RT-PCR. Lane 1: NC; lane 2: Ad-siRFP control; lane 3: Ad-siGRP78. C3H10T1/2 cells infected with Ad-siGRP78 and control Ad-siRFP, NC group were cultured for 48 h and GRP78 mRNA expression was determined by RT-PCR; (D) Quantification of relative levels of GRP78 in C3H10T1/2 cells. The normalized values were then calibrated against the control values, data were expressed as means ± S.D. (n = 3). The left bar indicates a relative level of GRP78 mRNA of 1; * p < 0.05; (E) Determination of GRP78 protein expression level after infected with Ad-GRP78. Lane 1: NC; lane 2: Ad-GFP control group; lane 3: Ad-GRP78 group. Proteins were separated by 10% SDS-PAGE and analyzed with anti-GRP78 antibody. Tubulin was used as internal control in Western blot. The levels of GRP78 proteins were obviously increased after infected with Ad-GRP78 compared with the control groups; (F) Semiquantification of relative levels of GRP78 in C3H10T1/2 cells. Levels were normalized against those of Tubulin by MJ Opticon Monitor Analysis Software (Bio-Rad, Hercules, CA, USA), data were expressed as means ± S.D. (n = 3). Every treatment group was compared with control groups respectively, * p < 0.05. Error bars, S.D.; (G) Determination of GRP78 protein expression level after infected with Ad-siGRP78. Lane 1: NC; lane 2: adenovirus si-GRP78 control group Ad-RFP; lane 3: Ad-siGRP78 group. Proteins were separated by 10% SDS-PAGE and analyzed with anti-GRP78 antibody. Tubulin was used as internal control in Western blot. The levels of GRP78 proteins were obviously reduced after infected with Ad-siGRP78 compared with the control groups; (H) Semi-quantification of relative levels of GRP78 in C3H10T1/2 cells. Levels were normalized against those of Tubulin by MJ Opticon Monitor Analysis Software (Bio-Rad), data were expressed as means ± S.D. (n = 3). Every treatment group was compared with control groups respectively, * p < 0.05. Error bars, S.D.
Figure 2
Figure 2
Expression of GRP78 during chondrogenesis both in vitro and in vivo. (A) and (B). Expressions of GRP78 was examined in the course of chondrogenesis of a micromass culture of C3H10T1/2 cells (A) and ATDC5 cells; (B) Micromass cultures of C3H10T1/2 cells were stimulated by BMP2 protein at various time points, as indicated, and the mRNA levels of GRP78 were assayed using real-time PCR. Units are arbitrary; the normalized values were calibrated against the d0 time point, here given the value of 1; (C) Immunohistochemistry of GRP78 in tibial growth plates of postcoital day 15.5 mouse embryo (E15.5; a), postcoital day 17.5 mouse embryo (E17.5; b), and newborn (c) is shown. Microphotographs are shown of sections stained with anti-GRP78 antibody (brown) and counterstained with hematoxylin (blue). Immunostaining reveals positive nuclear staining in the entire chondrogenic developmental stages in both proliferating and hypertrophic zones. Bar = 100 μm.
Figure 3
Figure 3
GRP78 decreases the expression of the XBP1S in BMP2-induced chondrogenesis. (A) Western blotting assay of the expression of ER stress associated molecules in C3H10T1/2 cells induced by BMP2 (300 ng/mL) for different times (1, 3, 5 days). Cell lysates prepared from micromass culture of C3H10T1/2 cells induced by BMP2, as indicated, were subjected to SDS-PAGE and detected with anti-BiP, anti-XBP1S, anti-IRE1α and anti-tubulin (serving as an internal control), respectively. Protein levels of IRE1α, XBP1S, ATF3 and tubulin (internal control) are shown; (B) Ad-GRP78 reduces, while siGRP78 increases, the level of XBP1S mRNA. C3H10T1/2 cells infected with Ad-GRP78 and control Ad-GFP, siGRP78 and control siRFP, were cultured for 48 h and endogenous XBP1S gene expression was determined by real-time PCR. The normalized values were then calibrated against the control value. The units are arbitrary, and the left bar indicates a relative level of XBP1S mRNA of 1; * p < 0.05; (C) Ad-GRP78 reduces, while siGRP78 increases, the level of XBP1S protein level in C3H10T1/2 cells induced by BMP2. C3H10T1/2 cells infected with Ad-GRP78 and control Ad-GFP, siGRP78 and control siRFP, were cultured for 48 h, respectively, and the endogenous XBP1S protein level was determined by Western blotting. siGRP78, an siRNA adenovirus targeting GRP78. Tubulin protein served as an internal control; (D) Semi-quantification of relative levels of XBP1S in micromass culture of C3H10T1/2 cells induced by BMP2. Levels were normalized against those of tubulin by MJ Opticon Monitor Analysis Software (Bio-Rad), data were expressed as means ± S.D. (n = 3). Every treatment group was compared with control groups respectively, * p < 0.05; (E) Ad-GRP78 decreases the level of XBP1S protein spliced by IRE1α in chondrocytes induced by BMP2. Micromass cultures of C3H10T1/2 cells were treated with 300 ng/mL BMP2, then C3H10T1/2 cells were infected with either Ad-GFP (serving as a control), siRFP (serving as a control), or Ad-IRE1α, siIRE1α, or Ad-IRE1α + Ad-GRP78, as indicated. Five or six days later, the cell lysates were used to detect the protein level of XBP1S by Western blotting. siIRE1α, an siRNA adenoviruse targeting IRE1α. Tubulin protein served as an internal control; (F) Semi-quantification of relative levels of XBP1S in micromass culture of C3H10T1/2 cells induced by BMP2. Levels were normalized against those of Tubulin by MJ Opticon Monitor Analysis Software (Bio-Rad), data were expressed as means ± S.D. (n = 3). Every treatment group was compared with control groups respectively, * p < 0.05. Error bars, S.D.
Figure 4
Figure 4
Cellular proliferation analysis by FCM. (A) Flow cytometry images with propidium iodide staining and analysis on cell cycle distribution. Micromass culture of ATDC5 cells and C3H10T1/2 were treated with BMP2 (300 ng/mL)/BMP2 + Ad-GFP/BMP2 + Ad-siRFP / BMP2 + Ad-GRP78 / BMP2 + Ad-siGRP78. Flow cytometry analysis showed that the percentage of the BMP2 + Ad-GRP78 ATDC5 cells in S phase were increased significantly compared to those in BMP2 controls, whereas the percentage of the BMP2 + Ad-siGRP78 ATDC5 cells in S phase were dramatically decreased compared with BMP2 control. The result of C3H10T1/2 is the same. Experiments were repeated three times, and samples were analyzed by Student’s t-test and statistical significance with p < 0.05. Representative images were shown; (B) Flow cytometry assay on the percentages of the ATDC5 and C3H10T1/2 cells in G2/M phase after treatment with BMP2 (300 ng/mL)/BMP2 + Ad-GFP / BMP2 + Ad-siRFP / BMP2 + Ad-GRP78 / BMP2 + Ad-siGRP78. * p < 0.05 compared with control; (C) Flow cytometry analysis showed that the percentages of the ATDC5 and C3H10T1/2 Ad-GRP78 cells in S phase were increased significantly, whereas the percentages of the ATDC5 and C3H10T1/2 Ad-siGRP78 cells in S phase were decreased compared with those in their controls. * p < 0.05 compared with control.
Figure 5
Figure 5
Cellular apoptosis assay with FCM. (A) Flow cytometry analysis with Annexin V-PI staining was performed to evaluate the percentage of apoptotic cells in BMP2 (300 ng/mL)-induced ATDC5 and C3H10T1/2 cells for three days. The percentage of apoptotic cells in the ATDC5 and C3H10T1/2 Ad-GRP78 cells groups were significantly decreased compared with that of controls. While the percentage of apoptotic cells in the ATDC5 and C3H10T1/2 Ad-siGRP78 cells groups were significantly increased compared with that of controls; (B) Analysis on cell apoptosis results of ATDC5 cells. Data are mean ± SD for relative apoptosis normalized to control cells for three independent experiments. Columns mean of four separate experiments; bars represent SD. * p < 0.05 as determined by Student’s t-test, versus BMP2 + Ad-siRFP and BMP2 + Ad-siGRP78 group, BMP2 + Ad-GFP and BMP2 + Ad-GRP78 group. Representative images from flow cytometry analysis are shown; (C) Analysis on cell apoptosis results of C3H10T1/2 cells. Data are mean ± SD for relative apoptosis normalized to control cells for three independent experiments. Columns mean of four separate experiments; bars represent SD. * p < 0.05 as determined by Student’s t-test, versus BMP2 + Ad-siRFP and BMP2 + Ad-siGRP78 group, BMP2 + Ad-GFP and BMP2 + Ad-GRP78 group. Representative images from flow cytometry analysis are shown.
Figure 6
Figure 6
The effects of GRP78 on the expression of ER stress-associated molecules in BMP2-induced C3H10T1/2 cells for three and five days. (AC) Expression of cleaved caspase3, CHOP, caspase12, tubulin, JNK and p-JNK in the course of chondrogenesis in a micromass culture of BMP2-induced C3H10T1/2 cells for three and five days. Whole cell lysates were prepared from C3H10T1/2 cells were treated with 300 ng/mL BMP2 for three and five days. The lysates were resolved by SDS-PAGE and then immunoblotted with antibodies against cleaved caspase3, caspase12, CHOP, JNK, p-JNK and Tubulin; (D) Semi-quantification of relative levels of cleaved caspase3, caspase12, CHOP and p-JNK. Levels were normalized against those of tubulin by MJ Opticon Monitor Analysis Software (Bio-Rad), data were expressed as means ± S.D. (n = 3). * p < 0.05 as determined by Student’s t-test, versus BMP2 + Ad-siRFP and BMP2 + Ad-siGRP78 group, BMP2 + Ad-GFP and BMP2 + Ad-GRP78 group.
Figure 7
Figure 7
Ad-GRP78 inhibits, while siGRP78 increases, ER stress-mediated apoptosis in micromass culture of ATDC5 cells and C3H10T1/2 cells induced by BMP2. (A) After treatment with 300 ng/mL BMP2, BMP2 + Ad-GFP, BMP2 + Ad-GRP78, BMP2 + siRFP or BMP2 + siGRP78 in micromass culture of C3H10T1/2 cells (ae) and ATDC5 cells (fk), then were analyzed for apoptosis using the TUNEL staining assay. Representative photographs of TUNEL staining in cells. The FITC-labeled TUNEL-positive cells were imaged under a fluorescent microscope (Bar = 200μm). The cells with green fluorescence were recognized as apoptotic cells, and the scale bars represent 200 μm; (B) Analysis on cell apoptosis results. Data are mean ± SD for relative apoptosis normalized to control cells for three independent experiments. Columns mean of three separate experiments; bars represent SD. * p < 0.05 as determined by Student’s t-test, versus BMP2 + siRFP and BMP2 + siGRP78 group; BMP2 + Ad-GFP and BMP2 + Ad-GRP78 group. Representative images from TUNEL analysis are shown.
Figure 8
Figure 8
TUNEL staining in the growth plate chondrocytes in vivo. (A) Metatarsals were explanted from 15-day-old mouse embryos and cultured in the presence of conditioned medium of BMP2 (300 ng/mL) (a); BMP2 + Ad-GFP (b); BMP2 + siRFP (c); BMP2 + siGRP78 (d); BMP2 + Ad-GRP78 (e) for five days and then were analyzed for apoptosis using the TUNEL-staining assay. Representative photographs of TUNEL staining in cells. The FITC-labeled TUNEL positive cells were imaged under a fluorescent microscope (Bar = 100 μm). The cells with green fluorescence were recognized as apoptotic cells, and the scale bars represent 100 μm; (B) Analysis on cell apoptosis results. Data are mean ± SD for relative apoptosis normalized to control cells for three independent experiments. Columns mean of three separate experiments; bars represent SD. * p < 0.05 as determined by Student’s t-test, versus BMP2 + siRFP and BMP2 + siGRP78 group; BMP2 + Ad-GFP and BMP2 + Ad-GRP78 group. Representative images from TUNEL analysis are shown.
Figure 9
Figure 9
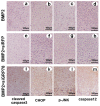
Expression of cleaved caspase3, CHOP, caspase12 and p-JNK in the growth plate chondrocytes in vivo. Metatarsals were explanted from 17-day-old mouse embryos and cultured in the presence of conditioned medium of BMP2 (300 ng/mL), BMP2 + siRFP, BMP2 + siGRP78 for 5 days. (a), (e) and (i) Immunohistochemistry staining was observed in low-power microphotograph of a section stained with anti-active caspase3 monoclonal antibody (brown) and counterstained with Mayer’s hematoxylin (blue); (b), (f) and (k) Immunohistochemistry staining was observed in a low-power microphotograph of a section stained with anti-CHOP monoclonal antibody (brown) and counterstained with Mayer’s hematoxylin (blue); (c), (g) and (l) Immunohistochemistry staining was observed in low-power microphotograph of a section stained with anti-p-JNK monoclonal antibody (brown) and counterstained with Mayer’s hematoxylin (blue); (d), (h) and (m) Immunohistochemistry staining was observed in low-power microphotograph of a section stained with anti-caspase12 monoclonal antibody (brown) and counterstained with Mayer’s hematoxylin (blue) and the scale bars represent 100 μm.

Similar articles

Cited by

References

    1. Goldring M.B., Tsuchimochi K., Ijiri K. The control of chondrogenesis. J. Cell. Biochem. 2006;97:33–44. doi: 10.1002/jcb.20652. - DOI - PubMed
    1. Colnot C. Cellular and molecular interactions regulating skeletogenesis. J Cell. Biochem. 2005;95:688–697. doi: 10.1002/jcb.20449. - DOI - PubMed
    1. Lui J.C., Andrade A.C., Forcinito P., Hegde A., Chen W., Baron J., Nilsson O. Spatial and temporal regulation of gene expression in the mammalian growth plate. Bone. 2010;46:1380–1390. doi: 10.1016/j.bone.2010.01.373. - DOI - PMC - PubMed
    1. Chen D., Zhao M., Mundy G.R. Bone morphogenetic proteins. Growth Factors. 2004;22:233–241. doi: 10.1080/08977190412331279890. - DOI - PubMed
    1. Lai C.F., Cheng S.L. Signal transductions induced by bone morphogenetic protein-2 and transforming growth factor-b in normal human osteoblastic cells. J. Biol. Chem. 2002;277:15514–15522. doi: 10.1074/jbc.M200794200. - DOI - PubMed

Publication types

MeSH terms

LinkOut - more resources