Review
. 2015 Sep 8;16(9):21626-42.
doi: 10.3390/ijms160921626.

Genetically Encoded Voltage Indicators in Circulation Research

Affiliations
Review

Genetically Encoded Voltage Indicators in Circulation Research

Lars Kaestner et al. Int J Mol Sci. .

Abstract

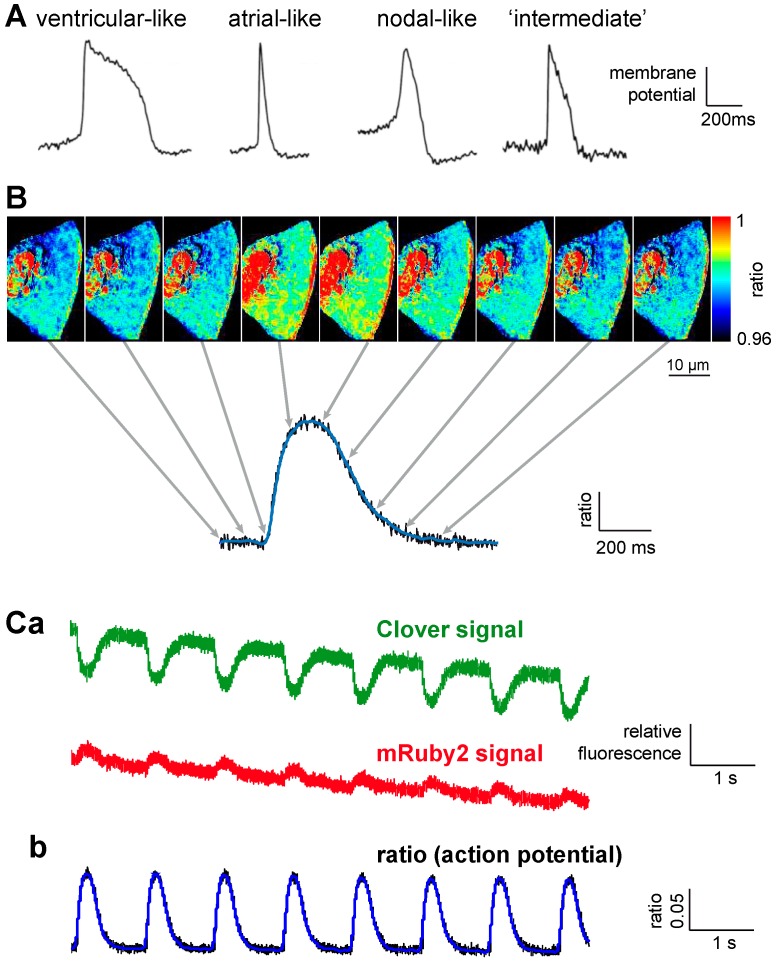
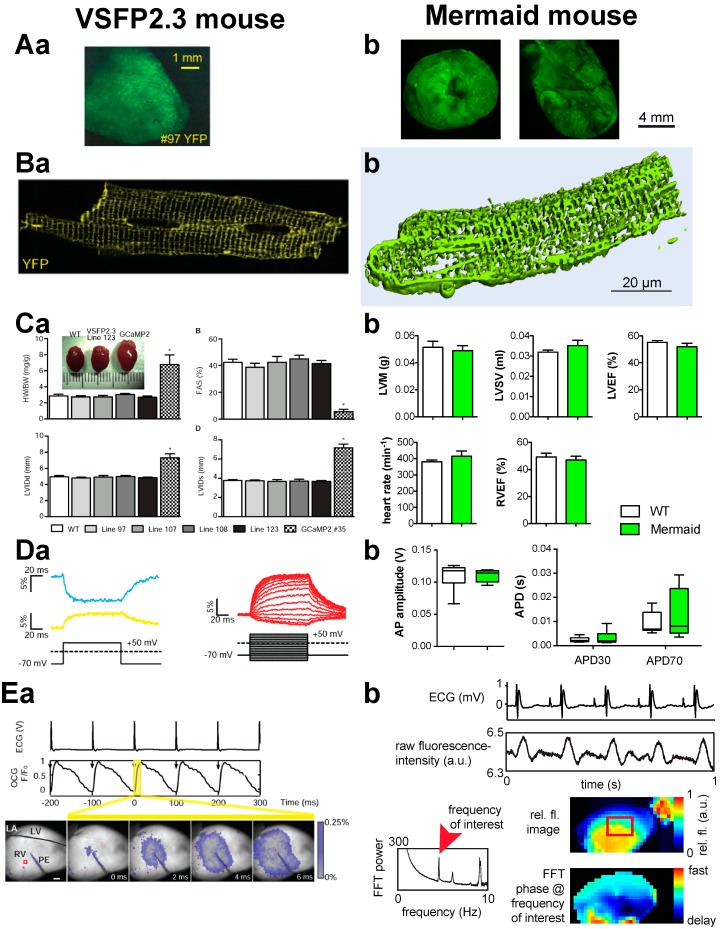
Membrane potentials display the cellular status of non-excitable cells and mediate communication between excitable cells via action potentials. The use of genetically encoded biosensors employing fluorescent proteins allows a non-invasive biocompatible way to read out the membrane potential in cardiac myocytes and other cells of the circulation system. Although the approaches to design such biosensors date back to the time when the first fluorescent-protein based Förster Resonance Energy Transfer (FRET) sensors were constructed, it took 15 years before reliable sensors became readily available. Here, we review different developments of genetically encoded membrane potential sensors. Furthermore, it is shown how such sensors can be used in pharmacological screening applications as well as in circulation related basic biomedical research. Potentials and limitations will be discussed and perspectives of possible future developments will be provided.

Keywords: Genetically Encoded Voltage Indicators (GEVI); action potential; cardiomyocyte; membrane potential.


Figures

Figure 1
Figure 1
Voltage-Sensitive Fluorescent Protein Clover-mRuby2 (VSFP-CR) for phenotyping stem cell derived cardiomyocytes. (A) Overview of optically recorded (Di-8-ANEPPS) reference action potential phenotypes from induced pluripotent stem cell derived cardiomyocytes. This panel is reproduced from [28], with permission from John Wiley & Sons; (B) Recorded image series of a human stem cell derived cardiomyocyte expressing VSFP-CR (Lentiviral gene transfer). The images are snapshots every 100 ms of a time series recorded at 500 frames per second using a scientific Complementary Metal-Oxide-Semiconductor (sCMOS) camera and point to the time course of the recorded action potential. Considering the temporal response of the GEVI (Genetically Encoded Voltage Indicators), the example shows most alikeness with an “intermediate” action potential with a tendency to the ventricular phenotype. Overlay of the raw ratio trace (black) and a smoothed trace (blue); (C) Original and processed traces of a train of recorded action potentials of an electrically paced (1 Hz) stem cell derived cardiomyocyte. (a) Raw traces of the spectral channels for Clover and mRuby2; (b) Overlay of the raw ratio trace (black) and a smoothed trace (blue).
Figure 2
Figure 2
Transgenic mice expressing a Genetically Encoded Voltage Indicator (GEVI) for optical mapping of the heart. Comparison of mice expressing VSFP2.3 (left, all panels (a)) and Mermaid (right, all panels (b)). Although slightly different parameters are presented, both mice show consistent data. (A) Cardiac appearance of the GEVI expression. (a) View of the excised heart; (b) Cut open heart: left, short axis; right, long axis; (B) Isolated cells expressing the GEVI on the plasmalemma, including T-tubules. (a) Confocal section; (b) 3D reconstruction based on confocal recordings; (C) GEVIs neither alter morphologic nor functional cardiac parameters. (a) Echocardiographic based parameters of different VSFP2.3 mouse lines compared to WT and GCaMP2 mice [73]: top left, heart weight to body weight ratio (HW/BW); top right, fractional area shortening (FAS); bottom left, diastolic left ventricular inner diameter (LVIDd); bottom right, systolic left ventricular inner diameter (LVIDs). None of the mice lines showed any significant differences except for the comparison with GCaMP2 mice (n = 8 mice per genotype); (b) Magnetic resonance imaging based parameters of Mermaid mice compared to WT: top left, left ventricular mass (LVM); top middle, left ventricular stroke volume (LVSV); top right, left ventricular ejection fraction (LVEF); bottom left, heart rate; bottom middle, right ventricular ejection fraction (RVEF). None of the parameters showed significant differences between Mermaid and WT mice (n = 6 mice per genotype); (D) Patch-clamp related measurements in mice expressing GEVI. (a) Left: representative traces of CFP and YFP in response to a voltage step from −70 to +50 mV in cardiomyocytes expressing VSFP2.3. Right: YFP/CFP ratios in response to a voltage protocol as depicted in cardiomyocytes expressing VSFP2.3, the optical signals show a pronounced delay compared to the command voltage as was also shown for Mermaid in cardiomyocytes [33]; (b) Action potential (AP) properties of Mermaid mice compared to WT at a stimulation frequency of 5 Hz: left, AP amplitude; right, AP duration (APD) for 30% and 70% repolarization. None of the parameters showed significant differences between Mermaid and WT mice (n = 10 cells per genotype); (E) Proof-of-principle for Langendorff-perfused heart recordings of mice expressing GEVI. (a) Synchronous electrical cardiograms (ECG) and optical cardiograms (OCG) supplemented with representative images during 10 Hz electrical pacing via a point electrode; (b) Synchronous ECG and raw fluorescence traces (based on the region of interest as indicated by the red rectangle in the relative fluorescence (rel. fl.) image) of an autonomous beating heart (top traces) were subjected to a Fast Fourier Transformation (FFT, left graph). The FFT phase at the frequency of interest (beating frequency of the heart) was visualized for each pixel (bottom right) to map the temporal AP distribution over the heart. Items in the left column (all panels (a)) are reproduced from [31], with permission from Wolters Kluwer.

References

    1. Matteucci C. Sur un phenomene physiologique produit par les muscles en contraction. Ann. Chim. Phys. 1842;6:339–341. (In French)
    1. Du Bois-Reymond E. Untersuchungen über Thierische Elektricitat. Verlag von G. Reimer; Berlin, Germany: 1848. (In German)
    1. Von Helmholtz H. Handbuch der physiologischen Optik. Leopold Voss; Leipzig, Germany: 1867. (In German)
    1. Cole K.S. Mostly membranes. Annu. Rev. Physiol. 1979;41:1–24. doi: 10.1146/annurev.ph.41.030179.000245. - DOI - PubMed
    1. Hamill O.P., Marty A., Neher E., Sakmann B., Sigworth F.J. Improved patch-clamp techniques for high-resolution current recording from cells and cell-free membrane patches. Pflügers Arch. 1981;391:85–100. doi: 10.1007/BF00656997. - DOI - PubMed

Publication types

Substances

LinkOut - more resources