. 2015 Oct 15;195(8):3725-36.
doi: 10.4049/jimmunol.1500397. Epub 2015 Sep 14.

A Distinctive Cytoplasmic Tail Contributes to Low Surface Expression and Intracellular Retention of the Patr-AL MHC Class I Molecule

Affiliations

A Distinctive Cytoplasmic Tail Contributes to Low Surface Expression and Intracellular Retention of the Patr-AL MHC Class I Molecule

Ana Goyos et al. J Immunol. .

Abstract

Chimpanzees have orthologs of the six fixed, functional human MHC class I genes. But, in addition, the chimpanzee has a seventh functional gene, Patr-AL, which is not polymorphic but contributes substantially to population diversity by its presence on only 50% of MHC haplotypes. The ancestral AL gene emerged long before the separation of human and chimpanzee ancestors and then subsequently and specifically lost function during human evolution, but was maintained in chimpanzees. Patr-AL is an alloantigen that participates in negative and positive selection of the T cell repertoire. The three-dimensional structure and the peptide-binding repertoire of Patr-AL and HLA-A*02 are surprisingly similar. In contrast, the expression of these two molecules is very different, as shown using specific mAbs and polyclonal Abs made against Patr-AL. Peripheral blood cells and B cell lines express low levels of Patr-AL at the cell surface. Higher levels are seen for 221-cell transfectants expressing Patr-AL, but in these cells a large majority of Patr-AL molecules are retained in the early compartments of the secretory pathway: mainly the endoplasmic reticulum, but also cis-Golgi. Replacing the cytoplasmic tail of Patr-AL with that of HLA-A*02 increased the cell-surface expression of Patr-AL substantially. Four substitutions distinguish the Patr-AL and HLA-A*02 cytoplasmic tails. Systematic mutagenesis showed that each substitution contributes changes in cell-surface expression. The combination of residues present in Patr-AL appears unique, but each individual residue is present in other primate MHC class I molecules, notably MHC-E, the most ancient of the functional human MHC class I molecules.


Figures

Figure 1
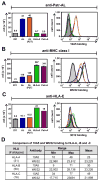
Figure 1. Cell-surface expression of Patr-AL is very low compared to HLA-A and Patr-A
Panels A–C) Surface staining, with anti-Patr-AL monoclonal antibody 10A5 (A), anti-MHC class I monoclonal antibody W6/32 (B) or anti-HLA-E monoclonal antibody 3D12 (C), of 221 cells (221, shaded gray), and 221 cells transfected with Patr-AL expressing its native Leader peptide (AL, orange), Patr-AL expressing a mutated Leader that abrogates expression of HLA-E (AL [P2T], blue), HLA-A*02:07 (HLA-A, green) and Patr-A*04:02 (Patr-A, purple). The bar graph on the left shows the median fluorescence intensity (mfi) values obtained for the histograms shown on the right. Error bars indicate standard deviation between two replicates within an experiment. Histograms show staining intensity for intact, live cells. One representative experiment is shown from the three total performed. Not shown are data for 221 transfectants expressing other human (HLA-A*01:01, -A*02:01, -A*02:07, and -A*03:01) and chimpanzee (Patr-A*04:02, -A*05:01, -A*06:01, -A*10:01, -A*11:01, -A*13:01, -A*16:01, and -A*20:01) MHC-A allotypes which have expression levels comparable to the HLA-A*02:07 and Patr-A*24:02 transfectants. Panel D) Summary of the binding reactions of 10A5 and W6/32 antibodies to microbeads, individually coated with one of 31 HLA-A, 50 HLA-B and 16 HLA-C allotypes. Antibody 10A5 bound to none of the HLA class I allotypes, whereas W6/32 bound to all of them and to similar extent (<15% variation between the beads). Data from at least 100 beads were obtained for each HLA class I allotype.
Figure 2
Figure 2. Patr-AL is not expressed constitutively on cell surfaces
Upper panels) Cell-surface staining and flow cytometric analysis of ten B lymphoblastoid cell lines (BLCL) derived from chimpanzee peripheral blood B cells. The cells were stained with Patr-AL specific antibody 10A5 (panel A) and pan MHC class I specific antibody W6/32 (panel B). For 10A5 staining (panel A) the bars show the frequency of antibody-binding intact, live cells. For W6/32 staining (panel B) the bars show mean fluorescent intensity (mfi) staining of the intact, live cells. Light gray shaded bars denote BLCL derived from chimpanzees that lack the Patr-AL gene, dark gray shaded bars denote BLCL derived from chimpanzees that carry the Patr-AL gene. Lower panels) Shown are analyses comparable to those depicted in the upper panels but performed on samples of peripheral blood mononuclear cells (PBMC) obtained from 24 chimpanzees. Panel C shows the frequency of cells staining for Patr-AL with the 10A5 antibody. Panel D shows the mean frequency intensity (mfi) of staining for MHC class I as detected with the W6/32 antibody. Panels E–F) Multi-color immunofluorescence staining and confocal microscopy of chimpanzee BLCL derived from a Patr-AL+ individual, Miss Eve (left panel) and a Patr-AL individual, Faye (right panel) fixed with 70% methanol 30% acetone and stained with various antibodies. Patr-AL was stained with ALpoly, (polyclonal Patr-AL-specific rabbit antibodies, in green). The specificity of ALpoly was confirmed by the negative staining of 221 cells (data not shown) and BLCL derived from a Patr-AL donor. Invariant chain was stained with the PIN.1 monoclonal antibody, which identifies the ER and early ER-derived vesicles of the endolysosomal system (in red). TOTO-3 (in blue) is used as a nuclear counterstain.
Figure 3
Figure 3. Transfected cells make comparable amounts of Patr-AL and HLA-A*02 but Patr-AL mainly stays inside the cell whereas HLA-A*02 goes to the surface
Flow cytometric analysis of 221 cells (221), 221 transfectants expressing Patr-AL (AL) and 221 transfectants expressing HLA-A*02:07 (A*02) after staining with anti-Patr-AL (10A5) and anti-HLA-A*02 (BB7.2) monoclonal antibodies. The upper panels show cell-surface staining for Patr-AL (panel A) and HLA-A*02 (panel B). The bars give the median fluorescence intensity (mfi) values of positively-staining intact, live cells. Error bars represent standard deviation between mfi shown for the data from three replicate experiments. The lower panels compare the amounts of Patr-AL (panel C) and HLA-A*02 (panel D) that are at intracellular and cell-surface locations. Because of the different physico-chemical properties of the 10A5 and BB7.2 antibodies, different protocols were used in order to detect their epitopes. For 10A5 staining (panel C) cells were fixed with 70% methanol 30% acetone, after which one aliquot of cells was permeabilized with cold acetone and the other was not. The cells were then stained with 10A5 and analyzed by flow cytometry. For BB7.2 staining (panel D), transfectants were fixed with 4% paraformaldehyde, after which one aliquot of cells was permeabilized with 0.04% saponin in FACS Buffer and the other was not. The cells were then stained with the BB7.2 antibody and analyzed by flow cytometry. In panels C and D, gray bars give the staining of non-permeabilized cells and black bars show the staining of the permeabilized cells. Error bars show the standard deviation in mfi for data from three replicate experiments.
Figure 4
Figure 4. Patr-AL concentrates in the endoplasmic reticulum and the cis-Golgi
Panels A–D) Multi-color immunofluorescence staining and confocal microscopy of 221-Patr-AL transfectants (left panels) fixed with 70% methanol 30% acetone and stained with various antibodies. Patr-AL was stained with ALpoly, (polyclonal Patr-AL-specific rabbit antibodies). The specificity of ALpoly was confirmed by the negative staining of 221 cells (data not shown). HLA-DR is stained with the L243 monoclonal antibody, which recognizes mature class II molecules that lack the invariant chain. Invariant chain is stained with the PIN.1 monoclonal antibody. Golgi matrix protein of 130 kD is stained with the GM130 monoclonal antibody. In the panels at the right are scattergrams showing the quantitative co-localization analysis of pairs of markers. Numbers in the scattergram are Pearson’s correlation coefficient values for the indicated channels (1 = perfect colocalization, 0 = no colocalization, −1 = negative colocalization) as averaged from analysis of 50 cells. Scale bar = 5μm. For all figures, blue = DNA. Panel E) Patr-AL was immunoprecipitated from Patr-AL transfected 221 cells (221-AL) using the 10A5 antibody and the Dynabeads® Co-Immunoprecipitation Kit (Invitrogen). 221 cells served as the negative control. Immunoprecipitates were treated with Endoglycosidase H (1000U) (+), or not (−), and analyzed by SDS-PAGE on a 4–15% gradient gel. Western blotting was performed using ALpoly to detect Patr-AL (shown on the left). For comparison, total lysates of 221 and 221-AL cells were similarly analyzed by SDS-PAGE and Western blotting (shown on the right). Panel F) Multi-color immunofluorescence staining and confocal microscopy of 221 cells transfected with Patr-AL. Cells were fixed (as described above) simultaneously stained with ALpoly (green), anti-lysosomal and anti-late endosomal marker, Lamp-1 (red) and HLA-DR (blue). The Lamp-1+ and HLA-DR+ compartments within each cell were analyzed by quantitative colocalization analysis of pairwise comparisons for each of the three channels imaged. Pink color shows overlap of red and blue staining. Panel G) From the data illustrated in panel F, mean values for Pearson’s correlation coefficient were calculated from pairwise comparisons of fluorescence intensity measurements, of 20 cells, from each of the 3 channels imaged. Error bars represent standard deviation between average Pearson’s correlation coefficient values for the 20 cells sampled.
Figure 5
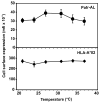
Figure 5. Cell surface expression of Patr-AL, but not HLA-A*02, is temperature sensitive
221 cells transfected with Patr-AL (upper panel) and HLA-A*02 (lower panel) were cultured in complete RPMI medium and incubated for 16 hours at various temperatures from 21–37°C. Cell surface expression of Patr-AL (10A5) and HLA-A*02:07 (BB7.2) were subsequently assayed by antibody staining and flow cytometry. The average mfi values for positively-staining, live cells are plotted. Error bars represent standard deviation between mfi shown for the data from 3 replicate experiments.
Figure 6
Figure 6. Unique features in the cytoplasmic tail contribute to the intracellular retention of Patr-AL
Panel A) Amino-acid sequence alignment of the cytoplasmic tails from Patr-AL and other human and chimpanzee MHC class I molecules. Shaded gray are positions 321, 326, 329 and 333 where Patr-AL has a unique combination of amino-acid residues. Panel B) 221 cells transfected with either Patr-AL (AL) or a mutant of Patr-AL (ALcytA2) having the cytoplasmic tail of HLA-A*02 were stained with anti-Patr-AL antibody (10A5) and analyzed by flow cytometry. Panel C) 221 cells transfected with HLA-A*02 (A*02) or a mutant of HLA-A*02 (A*02cytAL) having the cytoplasmic tail of Patr-AL were stained with anti-HLA-A*02 antibody (BB7.2) and analyzed by flow cytometry. For 10A5 binding (panel B) and BB7.2 binding (panel C) the average mfi value of cells is plotted. Error bars represent the standard deviation between mfi for the data from three replicate experiments. *** = p ≤ 0.0005.
Figure 7
Figure 7. The four residues that distinguish the cytoplasmic tail of Patr-AL all contribute to the intracellular retention of Patr-AL
Patr-AL, HLA-A*02:07 and mutants of them that represent all 16 combinations of the natural polymorphisms at positions 321, 326, 329 and 333 were transiently transfected into HeLa cells. Each wild-type and mutant contained 3xFLAG epitopes at the amino-terminus which enabled their surface expression to be compared using the anti-3xFLAG antibody and flow cytometric analysis. Within each panel a subgroup of the mutants are compared to the Patr-AL full tail mutant (left panels) and wild-type HLA-A*02:07 (right panels). Shown on the far left are the sequence motifs at positions 321, 326, 329 and 333 shared by the Patr-AL and HLA-A*02 paired in each row. Orange boxes denote residues naturally occurring in Patr-AL; blue boxes denote residues naturally occurring in HLA-A*02. Panel A mutants have one residue shared with Patr-AL and three with HLA-A*02. Panel B mutants have two residues shared with Patr-AL and two with HLA-A*02. Panel C mutants have three residues shared with Patr-AL and one with HLA-A*02. In each panel the horizontal bars give the levels of cell-surface expression as mfi. At least 3 replicates were analyzed for each mutant. Values that are statistically different from the HLA-A*02 cytoplasmic tail are: **** = p < 0.0001, *** = p < 0.0005, ** = p < 0.005, * = p < 0.05. These values were calculated by one-way ANOVA for each pairwise comparison.
Figure 8
Figure 8. Natural variation at position 295 of the transmembrane region affects expression of HLA-A*02 but not Patr-AL
Patr-AL and HLA-A*02:07 differ at position 295 in the transmembrane region as well as at four positions in the cytoplasmic domain. For both Patr-AL and HLA-A*02, mutants were made to give all combinations of the transmembrane region and cytoplasmic domain. Mutant construction, analysis of cell-surface expression and calculation of significance values were as described in the legend to Figure 7. At least 3 replicates were analyzed for each mutant.
Figure 9
Figure 9. The cytoplasmic tails of MHC class I molecules contain sorting motifs contributing to their patterns of intracellular trafficking
The cytoplasmic tail sequence and motif contents are compared among Patr-AL and human MHC class I molecules. Cytoplasmic tails of MHC class I molecules differ in length and in their contents of intracellular sorting motifs. All sorting motifs are shaded gray, with the exception of the Patr-AL-specific motif, which is shaded light orange. Functionally important residues within each motif are colored red. One motif is highlighted per tail sequence. Numbers on the scale represent the position within the cytoplasmic tail of Patr-AL. References for each motif described are also noted. (, , –42)

References

    1. Parham P. MHC class I molecules and KIRs in human history, health and survival. Nat Rev Immunol. 2005;5:201–214. - PubMed
    1. Lee N, Llano M, Carretero M, Ishitani A, Navarro F, Lopez-Botet M, Geraghty DE. HLA-E is a major ligand for the natural killer inhibitory receptor CD94/NKG2A. Proc Natl Acad Sci U S A. 1998;95:5199–5204. - PMC - PubMed
    1. Goodridge JP, Burian A, Lee N, Geraghty DE. HLA-F complex without peptide binds to MHC class I protein in the open conformer form. J Immunol. 2010;184:6199–6208. - PMC - PubMed
    1. Kovats S, Main EK, Librach C, Stubblebine M, Fisher SJ, DeMars R. A class I antigen, HLA-G, expressed in human trophoblasts. Science. 1990;248:220–223. - PubMed
    1. Yang Y, Chu W, Geraghty DE, Hunt JS. Expression of HLA-G in human mononuclear phagocytes and selective induction by IFN-gamma. J Immunol. 1996;156:4224–4231. - PubMed

Publication types