. 2015 Sep 29;112(39):11999-2004.
doi: 10.1073/pnas.1507743112. Epub 2015 Sep 14.

Integration of high-content screening and untargeted metabolomics for comprehensive functional annotation of natural product libraries

Affiliations

Integration of high-content screening and untargeted metabolomics for comprehensive functional annotation of natural product libraries

Kenji L Kurita et al. Proc Natl Acad Sci U S A. .

Abstract

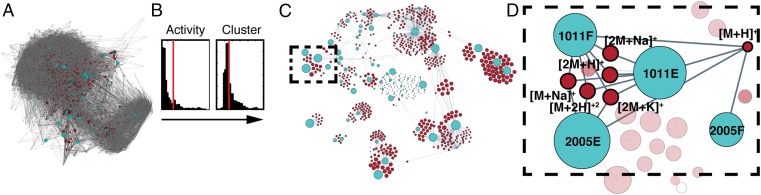
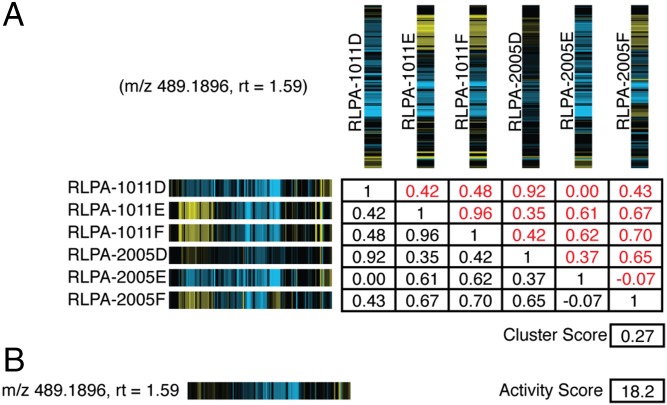
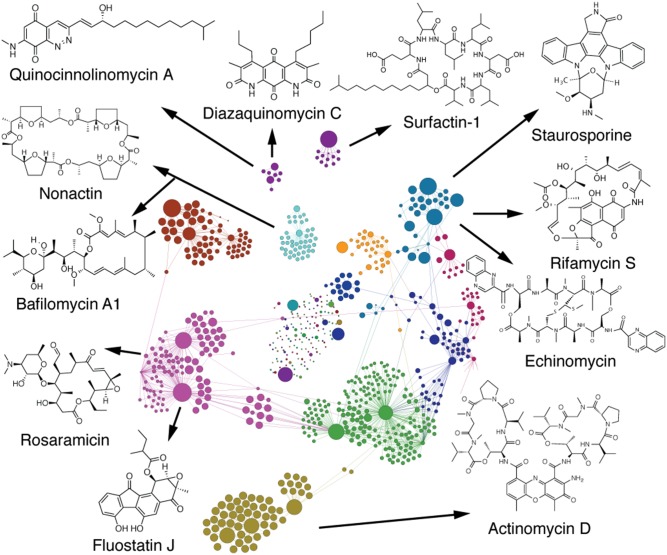
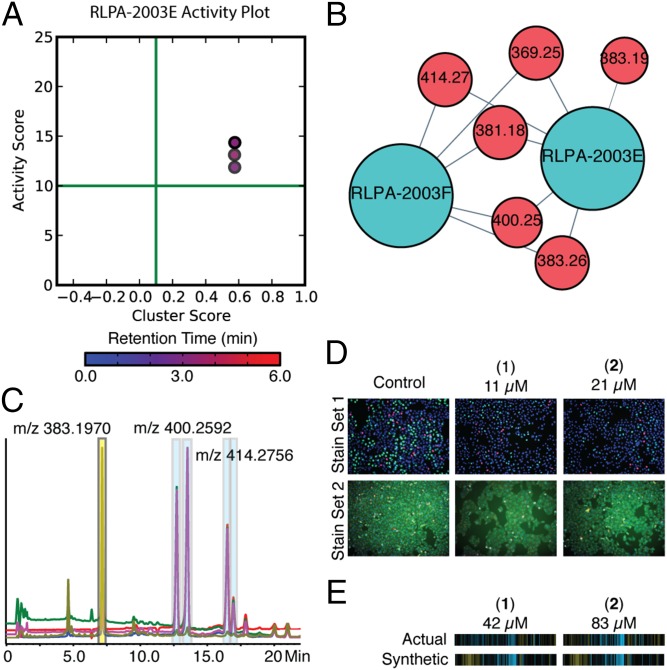
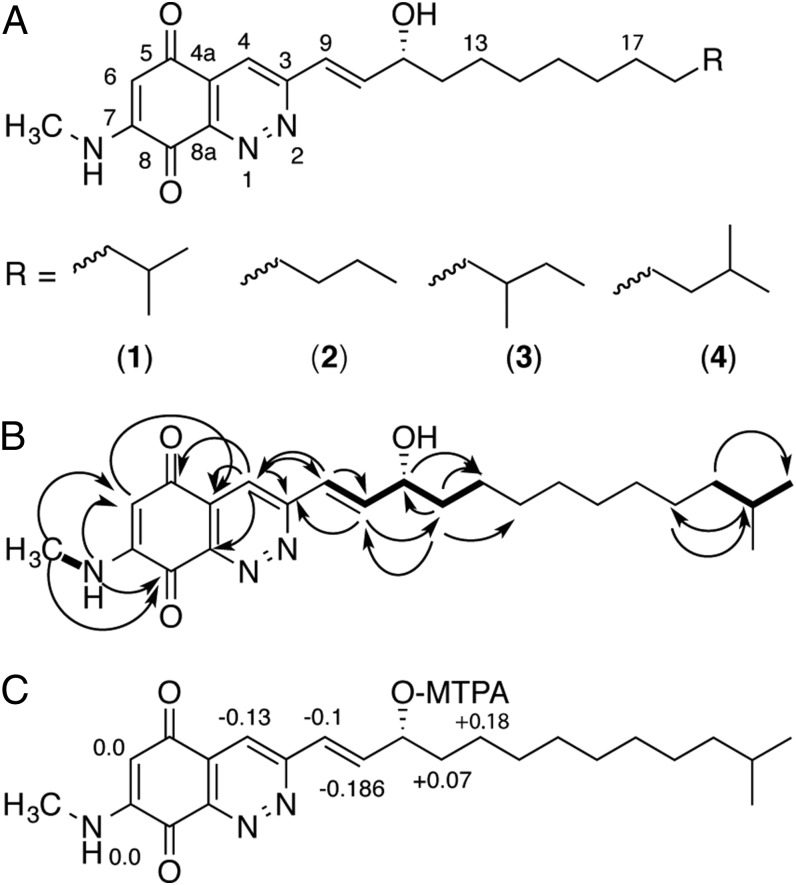
Traditional natural products discovery using a combination of live/dead screening followed by iterative bioassay-guided fractionation affords no information about compound structure or mode of action until late in the discovery process. This leads to high rates of rediscovery and low probabilities of finding compounds with unique biological and/or chemical properties. By integrating image-based phenotypic screening in HeLa cells with high-resolution untargeted metabolomics analysis, we have developed a new platform, termed Compound Activity Mapping, that is capable of directly predicting the identities and modes of action of bioactive constituents for any complex natural product extract library. This new tool can be used to rapidly identify novel bioactive constituents and provide predictions of compound modes of action directly from primary screening data. This approach inverts the natural products discovery process from the existing "grind and find" model to a targeted, hypothesis-driven discovery model where the chemical features and biological function of bioactive metabolites are known early in the screening workflow, and lead compounds can be rationally selected based on biological and/or chemical novelty. We demonstrate the utility of the Compound Activity Mapping platform by combining 10,977 mass spectral features and 58,032 biological measurements from a library of 234 natural products extracts and integrating these two datasets to identify 13 clusters of fractions containing 11 known compound families and four new compounds. Using Compound Activity Mapping we discovered the quinocinnolinomycins, a new family of natural products with a unique carbon skeleton that cause endoplasmic reticulum stress.

Keywords: bioactive small molecules; image-based screening; informatics; metabolomics; natural products.


Conflict of interest statement

The authors declare no conflict of interest.

Figures

Fig. 1.
Fig. 1.
Overview of Compound Activity Mapping. (A) Representation of the chemical space in the tested extract library. The network displays extracts (light blue) connected by edges to all m/z features (red) observed from the metabolomics analysis, illustrating the chemical complexity of even small natural product libraries. (B) Histograms of activity and cluster scores for all m/z features with cutoffs indicated as red lines (for full-size histograms see SI Appendix, Fig. S5). (C) Compound Activity Map, with the network displaying only the m/z features predicted to be associated with consistent bioactivity, and their connectivity to extracts within the library. (D) Expansion of the staurosporine cluster (dotted box in C) with extract numbers and relevant m/z features labeled.
Fig. 2.
Fig. 2.
Determination of synthetic fingerprints and cluster and activity scores. (A) Table of Pearson correlations for the cytological profiles between all extracts containing a specific m/z feature (m/z of 489.1896, rt of 1.59). In each cytological profile, yellow stripes correspond to positive perturbations in the observed cytological attribute and blue stripes correspond to negatively perturbed attributes. The cluster score is determined by calculating the average of the Pearson correlation scores for all relevant extracts. (B) Calculated synthetic fingerprint and activity score for feature (m/z of 489.1896, rt of 1.59). Synthetic fingerprints are calculated as the averages of the values for each cytological attribute to give a predicted cytological profile for each bioactive m/z feature in the screening set.
Fig. 3.
Fig. 3.
Annotated Compound Activity Map. An expanded view of the Compound Activity Map from Fig. 1C, with the extracts and m/z features separated into subclusters and colored coded using the Gephi modularity function. Each bioactive subcluster is composed of extracts containing a family of compounds with a defined biological activity. The Compound Activity Map is annotated with a representative molecule from each of the families of compounds that have been independently confirmed by purification and chemical analysis.
Fig. 4.
Fig. 4.
The prioritization, isolation, and confirmation of the quinocinnolinomycins A–D (14). (A) Bioactive m/z features plotted on a graph of activity score vs. cluster score. The color of the dot corresponds to the retention time of the m/z feature with the color bar and scale below in minutes. (B) Isolated cluster from Fig. 1C and Fig. 3 containing both the relevant extracts (blue) and bioactive m/z features (red). (C) HPLC trace of extract RLPA-2003E and the isolation of quinocinnolinomycins A–D (highlighted with blue boxes on HPLC trace). (D) Cell images of pure compounds screened as a twofold dilution series for quinocinnolinomycins A and B in both stain sets compared with images of vehicle (DMSO) wells. (E) Comparison of the synthetic and actual cytological fingerprints of the pure compounds is presented below the relevant images, demonstrating the relationship between experimental and calculated cytological profiles for these two metabolites.
Fig. 5.
Fig. 5.
Structure elucidation of quinocinnolinomycins A–D (14). (A) Structures of quinocinnolinomycins A–D. (B) Key NMR correlations used in the structure elucidation of quinocinnolinomycin A. COSY correlations are indicated by bold lines. Heteronuclear multiple-bond correlations are indicated by curved arrows. (C) ∆δSR values for the Mosher’s α-methoxy-α-trifluoromethylphenylacetic acid (MTPA) ester analysis of the secondary alcohol in quinocinnolinomycin A (1) to assign the absolute configuration at position C11.

References

    1. Newman DJ, Cragg GM. Natural products as sources of new drugs over the 30 years from 1981 to 2010. J Nat Prod. 2012;75(3):311–335. - PMC - PubMed
    1. Koehn FE, Carter GT. The evolving role of natural products in drug discovery. Nat Rev Drug Discov. 2005;4(3):206–220. - PubMed
    1. Nielsen KF, Månsson M, Rank C, Frisvad JC, Larsen TO. Dereplication of microbial natural products by LC-DAD-TOFMS. J Nat Prod. 2011;74(11):2338–2348. - PubMed
    1. Yang JY, et al. Molecular networking as a dereplication strategy. J Nat Prod. 2013;76(9):1686–1699. - PMC - PubMed
    1. Månsson M, et al. Explorative solid-phase extraction (E-SPE) for accelerated microbial natural product discovery, dereplication, and purification. J Nat Prod. 2010;73(6):1126–1132. - PubMed

Publication types

Substances