. 2015 Sep 29;112(39):12169-74.
doi: 10.1073/pnas.1509158112. Epub 2015 Sep 14.

Amelioration of inflammation and tissue damage in sickle cell model mice by Nrf2 activation

Affiliations

Amelioration of inflammation and tissue damage in sickle cell model mice by Nrf2 activation

Nadine Keleku-Lukwete et al. Proc Natl Acad Sci U S A. .

Abstract

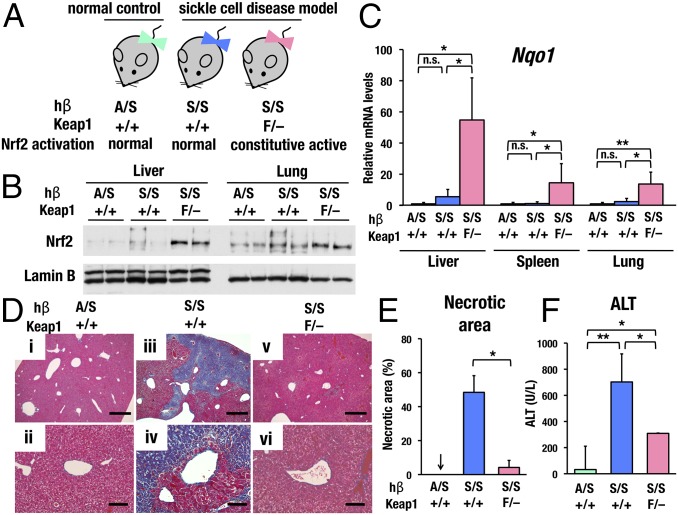
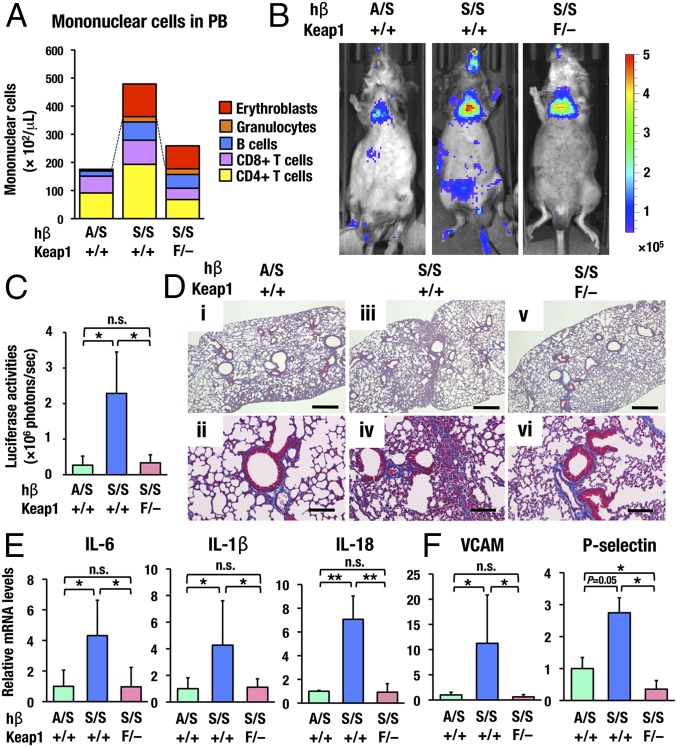
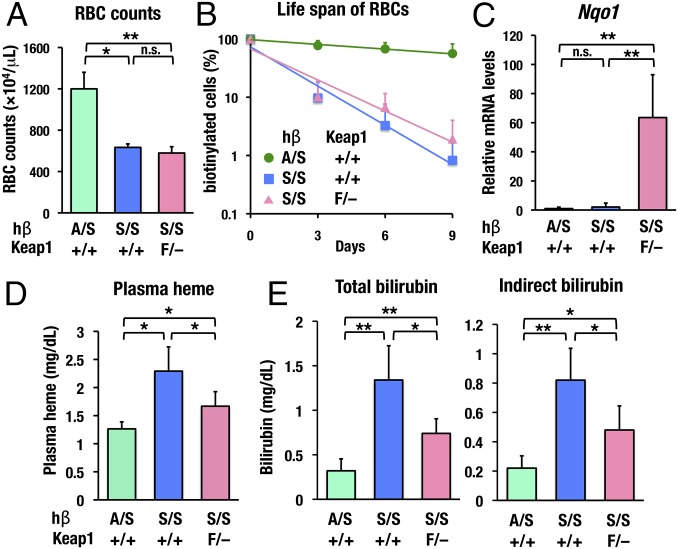
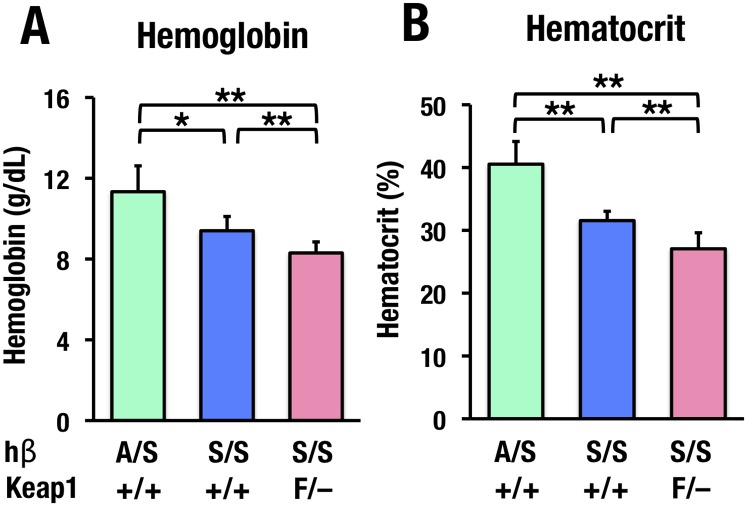
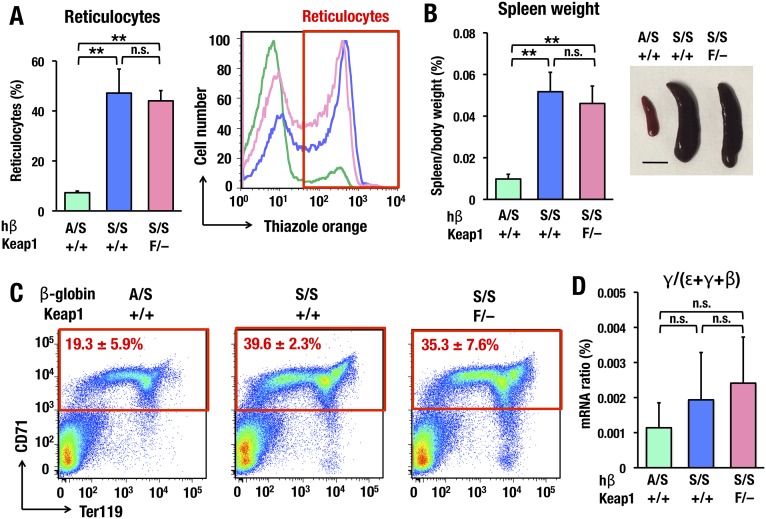
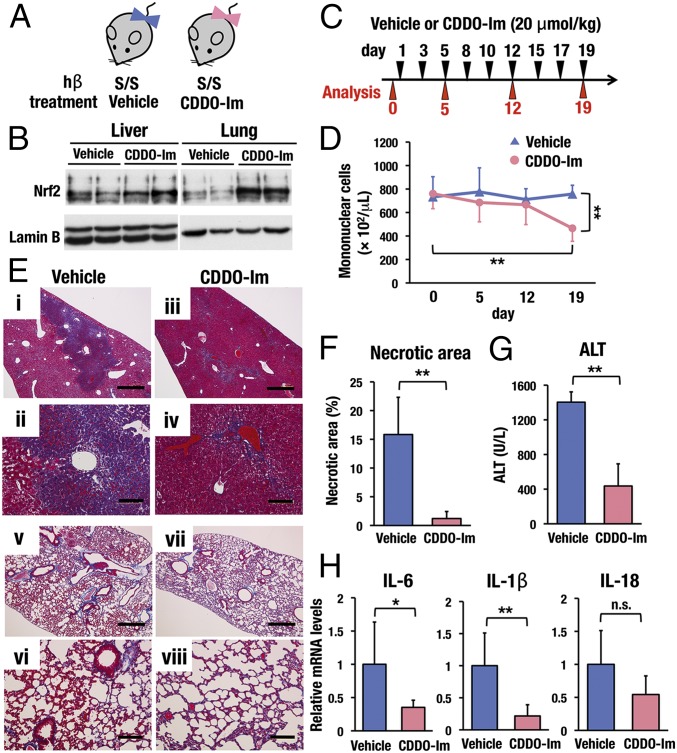
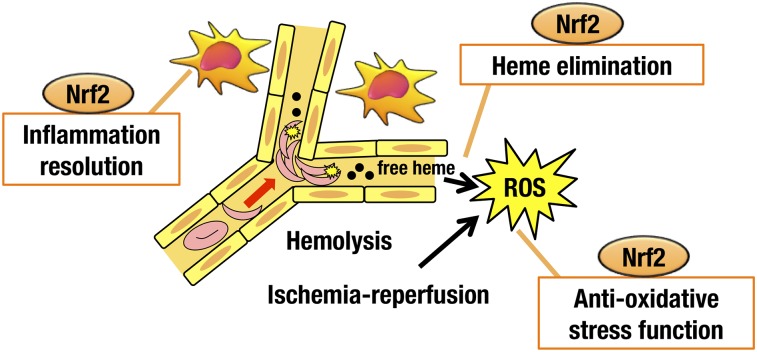
Sickle cell disease (SCD) is an inherited disorder caused by a point mutation in the β-globin gene, leading to the production of abnormally shaped red blood cells. Sickle cells are prone to hemolysis and thereby release free heme into plasma, causing oxidative stress and inflammation that in turn result in damage to multiple organs. The transcription factor Nrf2 (nuclear factor erythroid 2-related factor 2) is a master regulator of the antioxidant cell-defense system. Here we show that constitutive Nrf2 activation by ablation of its negative regulator Keap1 (kelch-like ECH-associated protein 1) significantly improves symptoms in SCD model mice. SCD mice exhibit severe liver damage and lung inflammation associated with high expression levels of proinflammatory cytokines and adhesion molecules compared with normal mice. Importantly, these symptoms subsided after Nrf2 activation. Although hemolysis and stress erythropoiesis did not change substantially in the Nrf2-activated SCD mice, Nrf2 promoted the elimination of plasma heme released by sickle cells' hemolysis and thereby reduced oxidative stress and inflammation, demonstrating that Nrf2 activation reduces organ damage and segregates inflammation from prevention of hemolysis in SCD mice. Furthermore, administration of the Nrf2 inducer CDDO-Im (2-cyano-3, 12 dioxooleana-1, 9 diene-28-imidazolide) also relieved inflammation and organ failure in SCD mice. These results support the contention that Nrf2 induction may be an important means to protect organs from the pathophysiology of sickle cell-induced damage.

Keywords: Keap1; Nrf2; sickle cell disease.


Conflict of interest statement

The authors declare no conflict of interest.

Figures

Fig. 1.
Fig. 1.
Genetic activation of Nrf2 relieves liver damage in SCD mutant mice. (A) The SCD model mice and Keap1-knockdown mice used in this study. We used hβS/S mice and hβA/S mice that represent SCD and control mice, respectively. Colors of ribbons that the hβA/S::Keap1+/+, hβS/S::Keap1+/+and hβS/S::Keap1F/− mice wear in this figure (green, blue, and pink, respectively) are used in the graphs in this figure and in Figs. 2 and 3. (B) Nrf2 accumulation in the nucleus. Immunoblot analyses using liver and lung nuclear fractions were used to determine Nrf2 protein level. Lamin B was used as a loading control. (C) Quantification of Nqo1 mRNA abundance in the liver, spleen, and lung of hβA/S::Keap1+/+ (n = 5), hβS/S::Keap1+/+ (n = 5), and hβS/S::Keap1F/− (n = 5) mice. The abundance of each mRNA was normalized to ribosomal RNA (rRNA). Average values for hβA/S::Keap1+/+ mice were set to 1. (D) Liver pathology of hβA/S::Keap1+/+, hβS/S::Keap1+/+, and hβS/S::Keap1F/− mice. Masson trichrome staining of representative liver sections of hβA/S::Keap1+/+ (i and ii), hβS/S::Keap1+/+ (iii and iv), and hβS/S::Keap1F/− mice (v and vi) are shown. (Scale bars, 500 μm in i, iii, and v; 100 μm in ii, iv, and vi.) (E) Quantitative analysis of necrotic area in the liver. Necrotic areas were sized for each mouse using BZ Analyzer software (KEYENCE) and expressed as percent of total area. Necrosis was not detected in the hβA/S::Keap1+/+ liver (arrow). (F) Liver ALT levels in the plasma of hβA/S::Keap1+/+ (n = 5), hβS/S::Keap1+/+ (n = 5), and hβS/S::Keap1F/− (n = 5) mice. Bar graph data represent the mean ± SD; *P < 0.05, **P < 0.01; n.s., not significant.
Fig. 2.
Fig. 2.
Nrf2 activation relieves inflammation in SCD mice. (A) The proportions of various lineages of mononuclear cells in the peripheral blood (PB) of hβA/S::Keap1+/+ (n = 3), hβS/S::Keap1+/+ (n = 3), and hβS/S::Keap1F/− (n = 3) mice. Dotted lines show the level of white blood cells excluding erythroblasts. (B) Representative bioluminescence imaging of SCD and human IL-6 reporter compound (WIM-6) mice. The relative light intensity emitted from the mouse was quantified by imaging analysis software according to the color scale (photons per second) shown on the right. (C) Quantification of luciferase activity from the whole body by in vivo imaging. Each bar represents the mean signal intensity for hβA/S::Keap1+/+ (n = 4), hβS/S::Keap1+/+ (n = 3), and hβS/S::Keap1F/− (n = 4) mutants, respectively. (D) Masson trichrome staining of the lungs of hβA/S::Keap1+/+ (i and ii), hβS/S::Keap1+/+ (iii and iv), and hβS/S::Keap1F/− (v and vi) mice. (Scale bars, 500 μm in i, iii, and v; 100 μm in ii, iv, and vi.) (E) Quantification of mRNA levels of proinflammatory cytokines in the lungs of hβA/S::Keap1+/+ (n = 5), hβS/S::Keap1+/+ (n = 4), and hβS/S::Keap1F/− (n = 5) mice. The mRNA levels of IL-6, IL-1β, and IL-18 were significantly lower in the lungs of hβS/S::Keap1F/− mice than in the lungs of hβS/S::Keap1+/+ mice. (F) Quantification of adhesion molecule mRNAs in the aorta. Note that the VCAM and P-selectin mRNA levels are significantly lower in hβS/S::Keap1F/− mice and are comparable to those in hβA/S::Keap1+/+ mice. Bar graph data are presented as mean ± SD; *P < 0.05, **P < 0.01; n.s., not significant.
Fig. 3.
Fig. 3.
Nrf2 activation in SCD mice promotes heme degradation. (A) RBC counts of hβA/S::Keap1+/+ (n = 4), hβS/S::Keap1+/+ (n = 5), and hβS/S::Keap1F/− (n = 5) mice. (B) Life span of RBCs of the SCD mice. The life span of RBCs in hβA/S::Keap1+/+ (n = 4), hβS/S::Keap1+/+ (n = 3), and hβS/S::Keap1F/− (n = 4) mice was evaluated by the percentage of biotin-labeled RBCs remaining in the bloodstream on the indicated days after biotin injection. (C) Quantification of Nqo1 mRNA abundance in erythroblasts in the spleen of hβA/S::Keap1+/+ (n = 4), hβS/S::Keap1+/+ (n = 5), and hβS/S::Keap1F/− (n = 5) mice. The abundance of mRNA in each sample was normalized to rRNA abundance. Average values for hβA/S::Keap1+/+ mice were set to 1. (D) Plasma heme levels of hβA/S::Keap1+/+ (n = 4), hβS/S::Keap1+/+ (n = 4), and hβS/S::Keap1F/− (n = 5) mice. (E) Total (Left) and indirect (Right) bilirubin levels in the plasma of hβA/S::Keap1+/+ (n = 5), hβS/S::Keap1+/+ (n = 5), and hβS/S::Keap1F/− (n = 5) mice. Bar graph data represent the mean ± SD; *P < 0.05, **P < 0.01; n.s., not significant.
Fig. S1.
Fig. S1.
Nrf2 activation acts independently of the prevention of hemolysis. Erythroid parameters in the peripheral blood were quantified. Hemoglobin content (A) and hematocrit (B) in hβA/S::Keap1+/+ (n = 4), hβS/S::Keap1+/+ (n = 5), and hβS/S::Keap1F/− (n = 5) mice are shown. Bar graph data are represented as mean ± SD; *P < 0.05, **P < 0.01; n.s., not significant.
Fig. S2.
Fig. S2.
Stress erythropoiesis is activated in SCD mice independently of Nrf2 activation. (A, Left) Reticulocyte counts of hβA/S::Keap1+/+ (n = 4), hβS/S::Keap1+/+ (n = 5), and hβS/S::Keap1F/− (n = 5). (Right) Representative flow cytometric pattern of thiazole orange of hβA/S::Keap1+/+ (green trace), hβS/S::Keap1+/+ (blue trace), and hβS/S::Keap1F/− (pink trace) mice. (B, Left) Average spleen weights from hβA/S::Keap1+/+ (n = 5), hβS/S::Keap1+/+ (n = 5), and hβS/S::Keap1F/− (n = 5) mice. Data are shown as mean of the spleen weight relative to the total body weight of each mouse. (Right) A representative spleen from each group. (Scale bar, 1 cm.) (C) Flow cytometric analysis of erythroblasts in the spleen. Representative flow cytometric patterns are shown. Values show the ratio of CD71+ erythroblasts (red boxes). (D) Fetal γ-globin gene expression as a percentage of all β-type globin genes (ε, γ, and β) in the spleen of hβA/S::Keap1+/+ (n = 4), hβS/S::Keap1+/+ (n = 4), and hβS/S::Keap1F/− (n = 4) mice. Bar graph data are represented as mean ± SD; *P < 0.05, **P < 0.01; n.s., not significant.
Fig. 4.
Fig. 4.
Administration of an Nrf2 inducer CDDO-Im improves inflammation and liver damage in SCD mice. (A) The SCD model mice used in the CDDO-Im administration experiment. We administered vehicle or CDDO-Im orally to hβS/S mice. The colors of ribbons that the vehicle-treated and CDDO-Im–treated hβS/S mice wear (blue and pink, respectively) are used in the graphs in this figure. (B) Nrf2 accumulation in the nucleus. Immunoblot analyses using liver and lung nuclear fractions were used to determine Nrf2 protein level. Lamin B was used as a loading control. (C) Protocol for vehicle or CDDO-Im administration (black arrowheads) and analysis (red arrowheads). (D) Mononuclear cell counts in the peripheral blood of vehicle-treated hβS/S (n = 7) or CDDO-Im–treated hβS/S (n = 6) mice. (E) Masson trichrome staining of representative liver (iiv) and lung (vviii) sections of vehicle-treated hβS/S (i and ii and v and vi) or CDDO-Im–treated hβS/S (iii, iv, vii, and viii) mice on day 19. (Scale bars, 500 μm in i, iii, v, and vii; 100 μm in ii, iv, vi, and viii.) (F) Quantitative analysis of the necrotic area in the liver of vehicle-treated hβS/S (n = 4) or CDDO-Im–treated hβS/S (n = 5) mice. (G) Liver ALT levels in the plasma of vehicle-treated hβS/S (n = 3) or CDDO-Im–treated hβS/S (n = 5) mice. (H) Quantification of mRNA levels of proinflammatory cytokines in the lungs of vehicle-treated hβS/S (n = 6) or CDDO-Im–treated hβS/S (n = 4) mice. The expression level of each mRNA was normalized to rRNA abundance. Average values for vehicle-treated mice were set to 1. Bar graph data represent the mean ± SD; *P < 0.05, **P < 0.01; n.s., not significant.
Fig. S3.
Fig. S3.
A model for the contribution of Nrf2 activation to SCD. Under low oxygen pressure, RBCs form sickled RBCs, which cluster together to block blood flow in the microvasculature. This situation leads to vaso-occlusion with ischemia–reperfusion injury, hemolysis of RBC with release of free heme that promotes and maintains ROS production, and activation of inflammatory cells. Nrf2 activation in SCD mice protects tissues from oxidative stress through the induction of antioxidant genes, promotion of free heme elimination, and resolution of inflammation.

Similar articles

Cited by

References

    1. Ingram VM. Gene mutations in human haemoglobin: The chemical difference between normal and sickle cell haemoglobin. Nature. 1957;180(4581):326–328. - PubMed
    1. Li C, Wright MM, Jackson RM. Reactive species mediated injury of human lung epithelial cells after hypoxia-reoxygenation. Exp Lung Res. 2002;28(5):373–389. - PubMed
    1. Repka T, Hebbel RP. Hydroxyl radical formation by sickle erythrocyte membranes: Role of pathologic iron deposits and cytoplasmic reducing agents. Blood. 1991;78(10):2753–2758. - PubMed
    1. Belcher JD, et al. Heme triggers TLR4 signaling leading to endothelial cell activation and vaso-occlusion in murine sickle cell disease. Blood. 2014;123(3):377–390. - PMC - PubMed
    1. Akohoue SA, et al. Energy expenditure, inflammation, and oxidative stress in steady-state adolescents with sickle cell anemia. Pediatr Res. 2007;61(2):233–238. - PubMed

Publication types

MeSH terms