. 2015 Sep 15:4:e10514.
doi: 10.7554/eLife.10514.

The primary σ factor in Escherichia coli can access the transcription elongation complex from solution in vivo

Affiliations

The primary σ factor in Escherichia coli can access the transcription elongation complex from solution in vivo

Seth R Goldman et al. Elife. .

Abstract

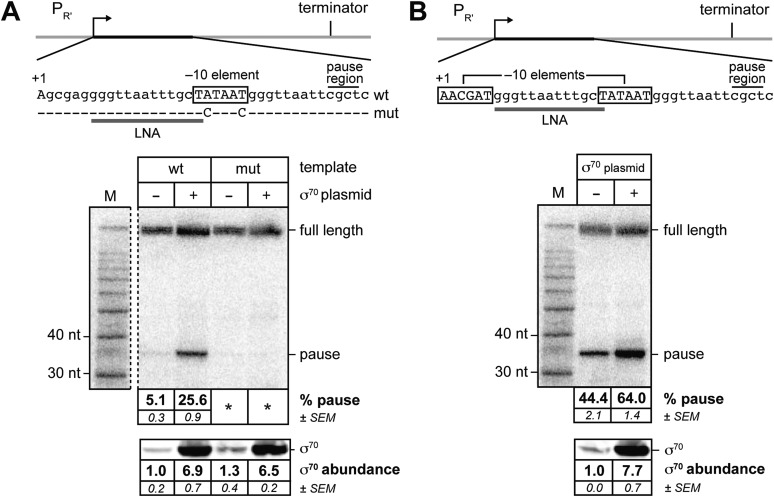
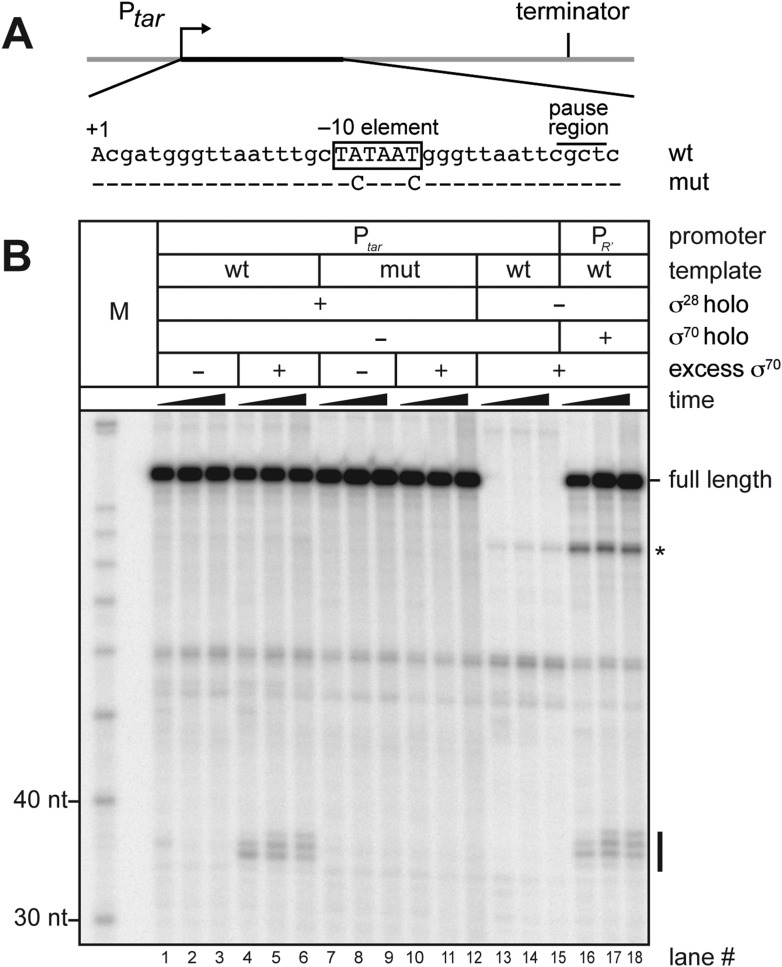
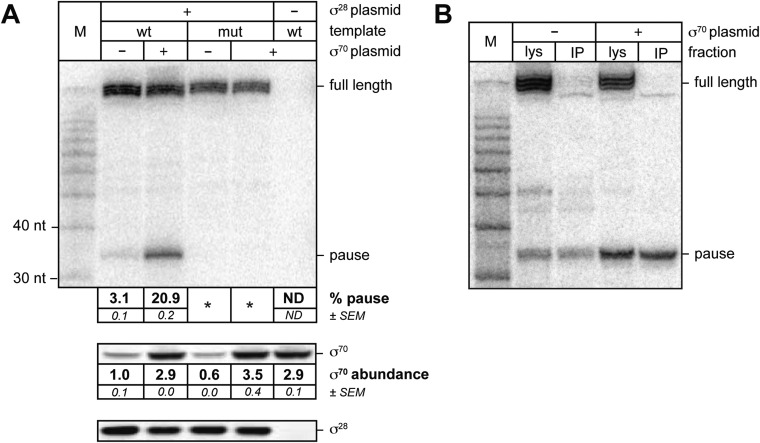
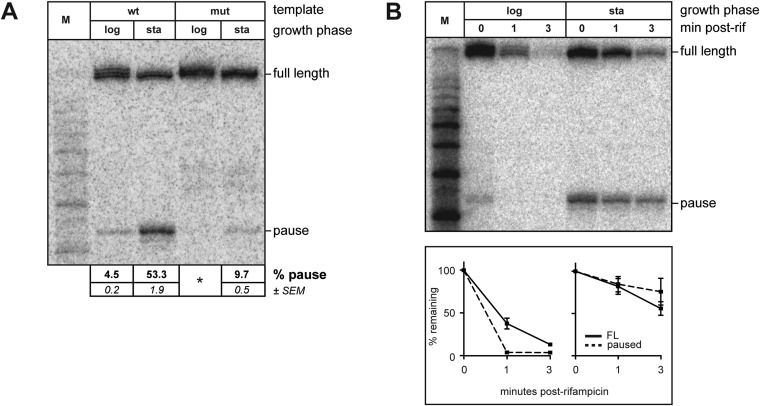
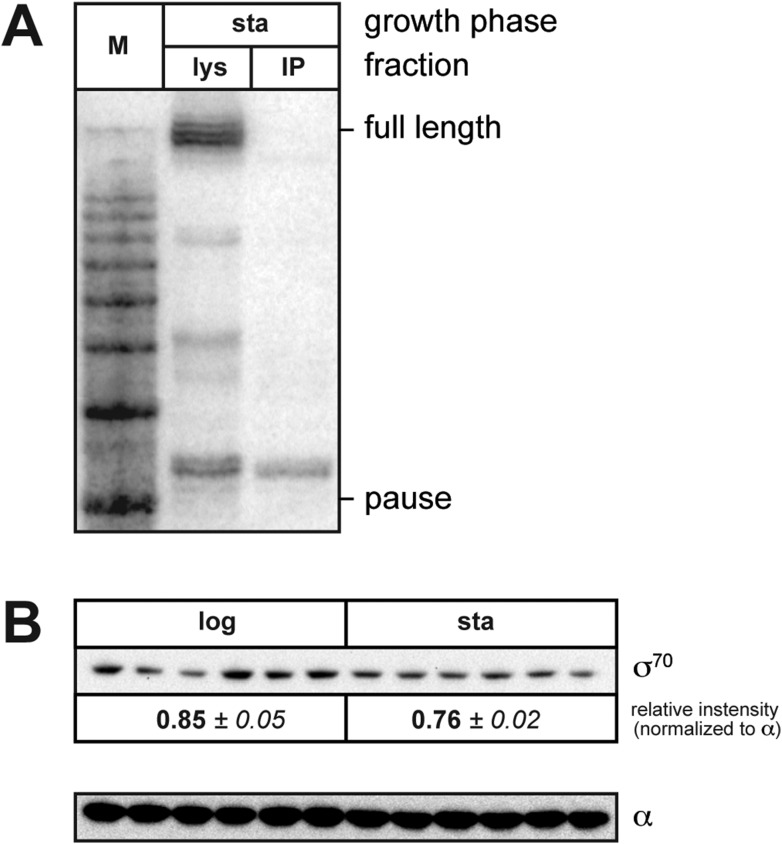
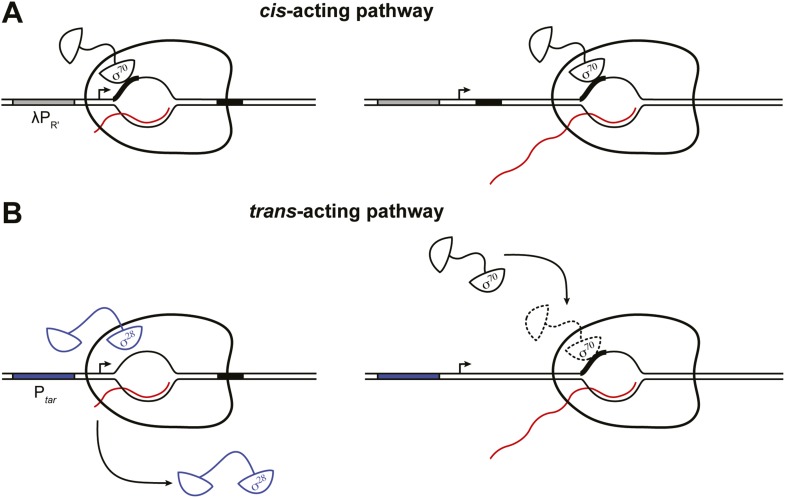
The σ subunit of bacterial RNA polymerase (RNAP) confers on the enzyme the ability to initiate promoter-specific transcription. Although σ factors are generally classified as initiation factors, σ can also remain associated with, and modulate the behavior of, RNAP during elongation. Here we establish that the primary σ factor in Escherichia coli, σ(70), can function as an elongation factor in vivo by loading directly onto the transcription elongation complex (TEC) in trans. We demonstrate that σ(70) can bind in trans to TECs that emanate from either a σ(70)-dependent promoter or a promoter that is controlled by an alternative σ factor. We further demonstrate that binding of σ(70) to the TEC in trans can have a particularly large impact on the dynamics of transcription elongation during stationary phase. Our findings establish a mechanism whereby the primary σ factor can exert direct effects on the composition of the entire transcriptome, not just that portion that is produced under the control of σ(70)-dependent promoters.

Keywords: E. coli; RNA polymerase; bacterial transcription; chromosomes; elongation factor; genes; infectious disease; microbiology; sigma factor; transcription pausing.


Conflict of interest statement

The authors declare that no competing interests exist.

Figures

Figure 1.
Figure 1.. σ70 trans loading on a σ70-dependent transcription unit in vivo (MG1655).
(A) Top: schematic of DNA template carrying λPR', transcribed-region consensus extended –10 element (wild-type or mutant) and terminator (see ‘Materials and methods’ for the λPR′ promoter sequence). Transcribed-region sequences that are complementary to the LNA probe are underlined (grey bar) and the positions corresponding to pause sites are indicated. middle Analysis of RNA transcripts in vivo by LNA probe-hybridization. RNA was isolated from MG1655 cells harvested at an OD600 of 0.8–1.0 (see ‘Materials and methods’). Pausing is quantified by dividing the signal in the ∼35-nt pause RNA band by the sum of this signal and the signal in the terminated (full-length) band; this ratio is expressed as a percentage (relative abundance). Mean and SEM of six independent measurements are shown. Asterisks (*) designate values that were too low (<approximately threefold above background) for accurate quantification. M, 10-nt RNA ladder. bottom Analysis of σ70 levels by Western blot. Amount of soluble σ70 is normalized to the amount in cells carrying the experimental template (wt) and a vector that does not direct σ70 over-production. Mean and SEM of three independent measurements are shown. (B) Top: schematic of DNA template carrying λPR′, initial-transcribed-region σ70-dependent pause element, transcribed-region consensus −10 element and terminator. middle Analysis of RNA transcripts in vivo by locked-nucleic-acid (LNA) probe-hybridization, as in panel A. bottom Analysis of σ70 levels by Western blot. DOI: http://dx.doi.org/10.7554/eLife.10514.003
Figure 2.
Figure 2.. σ70 trans loading on a σ28-dependent transcription unit in vitro.
(A). Schematic of DNA template carrying Ptar, transcribed-region consensus −10 element (wild-type or mutant) and terminator. Template positions corresponding to pause sites are indicated. Note that the pause sites and terminated transcripts emanating from the Ptar promoter are located one base closer to the transcription start site (+1) than on the λPR′ template (Figure 1A). (See ‘Materials and methods’ for the Ptar promoter sequence.) (B). Analysis of RNA transcripts in vitro. Single-round in vitro transcription reactions were performed with reconstituted RNA polymerase (RNAP) holoenzyme containing σ28 (lanes 1–12), RNAP core enzyme (lanes 13–15) or reconstituted RNAP holoenzyme containing σ70 (lanes 16–18) and three different templates: Ptar with a wild-type (wt) transcribed-region −10 element (lanes 1–6 & 13–15) or a mutated (mut) transcribed-region −10 element (lanes 7–12) and λPR′ with a wild-type transcribed-region −10 element (lanes 16–18). The reactions were performed as a time course with samples taken at 1, 6 and 18 min after transcription was initiated; these reactions were performed in the absence of transcript cleavage factors GreA and GreB, resulting in a characteristic pattern of long-lived pause species (Deighan et al., 2011). Where indicated, excess σ70 (1 μM) was added with the ‘start mix’ after open complex formation. RNAs associated with paused transcription elongation complexes (TECs) (pause) and terminated transcripts (full length) are labeled. The asterisk (*) indicates a shorter terminated transcript that is the result of transcription initiating under the control of the transcribed-region −10 element when the σ70-containing holoenzyme is present in the reaction. DOI: http://dx.doi.org/10.7554/eLife.10514.004
Figure 3.
Figure 3.. σ70 trans loading on a σ28-dependent transcription unit in vivo.
(A). top Detection of RNA transcripts in vivo from the templates shown in Figure 2A by LNA probe-hybridization. Transcribed-region sequences that are complementary to the LNA probe are as in Figure 1A. RNA was isolated from MG1655 cells harvested at an OD600 of 0.8–1.0. Pausing is quantified by dividing the signal in the ∼35-nt pause RNA band by the sum of this signal and the signal in the terminated (full-length) band. Mean and SEM of three independent measurements are shown. Asterisks (*) designate values that were too low for accurate quantification. M, 10-nt RNA ladder. middle Analysis of σ70 levels by Western blot. Amount of soluble σ70 is normalized to the amount in cells carrying the experimental template (wt) and a vector that does not direct σ70 over-production. Mean and SEM of three independent measurements are shown. bottom Analysis of σ28 levels by Western blot. (B). Analysis of RNAP-associated transcripts produced from the wild-type Ptar template. RNA was isolated from the lysate fraction (lys) or the immunoprecipitated fraction (IP) of SG110 cells (OD600 ∼0.5) and analyzed by LNA probe-hybridization. The cells contained a vector directing the synthesis of σ28, as well as a vector that did or did not direct σ70 overproduction. DOI: http://dx.doi.org/10.7554/eLife.10514.005
Figure 4.
Figure 4.. Growth phase dependent σ70 trans loading on a σ28-dependent transcription unit in vivo.
(A). Detection of RNA transcripts in vivo from the templates shown in Figure 2A by LNA probe-hybridization. Transcribed-region sequences that are complementary to the LNA probe are as in Figure 1A. RNA was isolated from SG110 cells harvested at an OD600 of ∼0.5 (log) or ∼2.5 (sta). Pausing is quantified by dividing the signal in the ∼35-nt pause RNA band by the sum of this signal and the signal in the terminated (full-length) band. Mean and SEM of six independent measurements are shown. Asterisks (*) designate values that were too low for accurate quantification. M, 10-nt RNA ladder. (B). top Detection of RNA transcripts derived from the wt template in vivo after treatment with rifampicin. bottom Percent of transcript remaining relative to T = 0 at indicated time points after addition of rifampicin. Mean and SEM of ten (log, 1 m), eight (sta, 1 m), or six (log and sta, 3 m) independent measurements are shown. DOI: http://dx.doi.org/10.7554/eLife.10514.006
Figure 4—figure supplement 1.
Figure 4—figure supplement 1.. (A). Analysis of RNAP-associated transcripts produced from the wild-type Ptar template.
RNA was isolated from the lysate fraction (lys) or the immunoprecipitated fraction (IP) of SG110 cells (OD600 ∼2.5) and analyzed by LNA probe-hybridization. The cells contained a vector directing the synthesis of σ28. (B). Analysis of σ70 levels by Western blot. Relative quantification of σ70 (top) is normalized to the abundance of rpoA (α) in each sample (bottom). Mean and SEM of six independent measurements are shown. DOI: http://dx.doi.org/10.7554/eLife.10514.007
Figure 5.
Figure 5.. Dual pathways for σ70 to associate with the TEC in vivo.
(A). Cis-acting pathway (Deighan et al., 2011). The retention in the TEC of the σ70 that was used during initiation enables pausing at transcribed-region −10-like elements on transcription units that are expressed under the control of σ70-dependent promoters. Presence of an initial-transcribed-region σ70-dependent −10-like element increases the σ70 content of downstream TECs and increases the efficiency of pausing at a second σ70-dependent pause element further downstream. Promoter, grey rectangle; σ70-dependent pause elements, black rectangles; RNA, wavy red line. (B). Trans-acting pathway. Binding of σ70 to TECs that have lost the σ factor used during initiation (here, σ28) increases the efficiency of pausing at a transcribed-region σ70-dependent pause element. Promoter, blue rectangle; σ70-dependent pause element, black rectangle; RNA, wavy red line. DOI: http://dx.doi.org/10.7554/eLife.10514.008

References

    1. Bar-Nahum G, Nudler E. Isolation and characterization of sigma(70)-retaining transcription elongation complexes from Escherichia coli. Cell. 2001;106:443–451. doi: 10.1016/S0092-8674(01)00461-5. - DOI - PubMed
    1. Belogurov GA, Artsimovitch I. Regulation of transcript elongation. Annual Review of Microbiology. 2015 doi: 10.1146/annurev-micro-091014-104047. - DOI - PMC - PubMed
    1. Brodolin K, Zenkin N, Mustaev A, Mamaeva D, Heumann H. The sigma 70 subunit of RNA polymerase induces lacUV5 promoter-proximal pausing of transcription. Nature Structural & Molecular Biology. 2004;11:551–557. doi: 10.1038/nsmb768. - DOI - PubMed
    1. Buckstein MH, He J, Rubin H. Characterization of nucleotide pools as a function of physiological state in Escherichia coli. Journal of Bacteriology. 2008;190:718–726. doi: 10.1128/JB.01020-07. - DOI - PMC - PubMed
    1. Chilcott GS, Hughes KT. Coupling of flagellar gene expression to flagellar assembly in Salmonella enterica serovar typhimurium and Escherichia coli. Microbiology and Molecular Biology Reviews. 2000;64:694–708. doi: 10.1128/MMBR.64.4.694-708.2000. - DOI - PMC - PubMed

Publication types

MeSH terms