

XBP1-Independent UPR Pathways Suppress C/EBP-β Mediated Chondrocyte Differentiation in ER-Stress Related Skeletal Disease
- PMID: 26372225
- PMCID: PMC4651170
- DOI: 10.1371/journal.pgen.1005505
XBP1-Independent UPR Pathways Suppress C/EBP-β Mediated Chondrocyte Differentiation in ER-Stress Related Skeletal Disease
Abstract
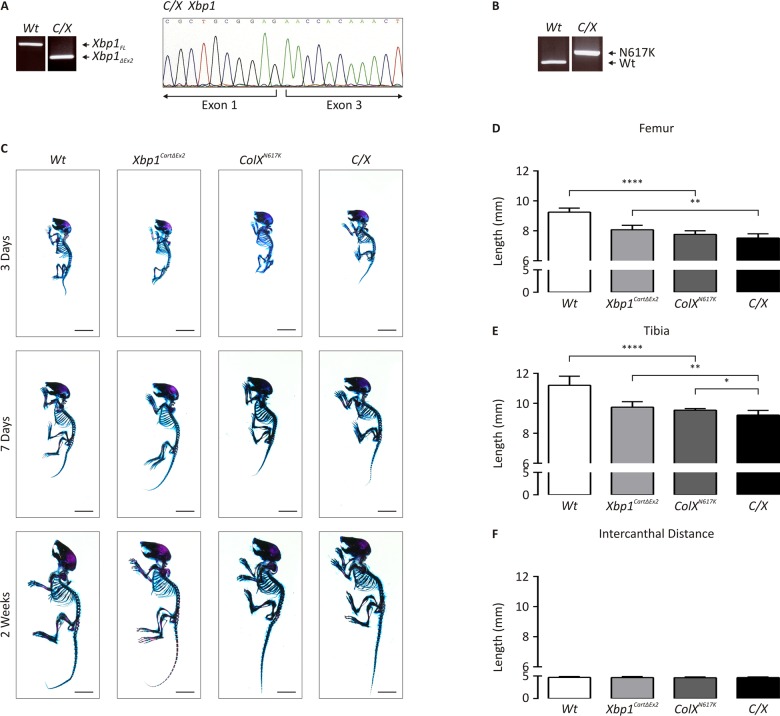
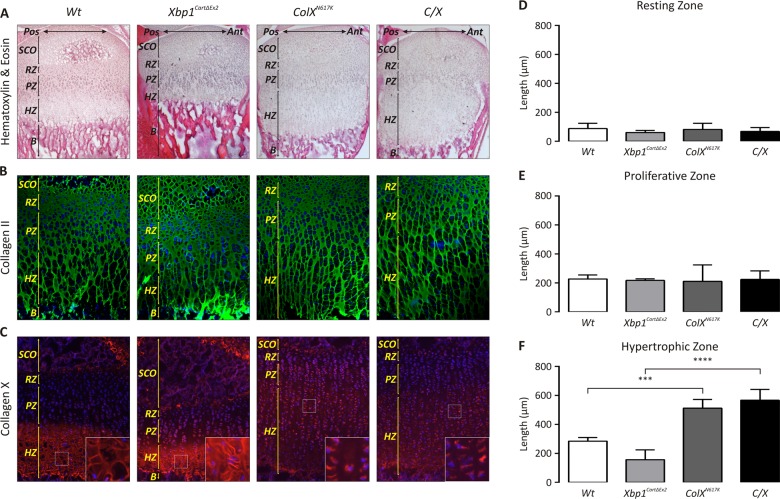
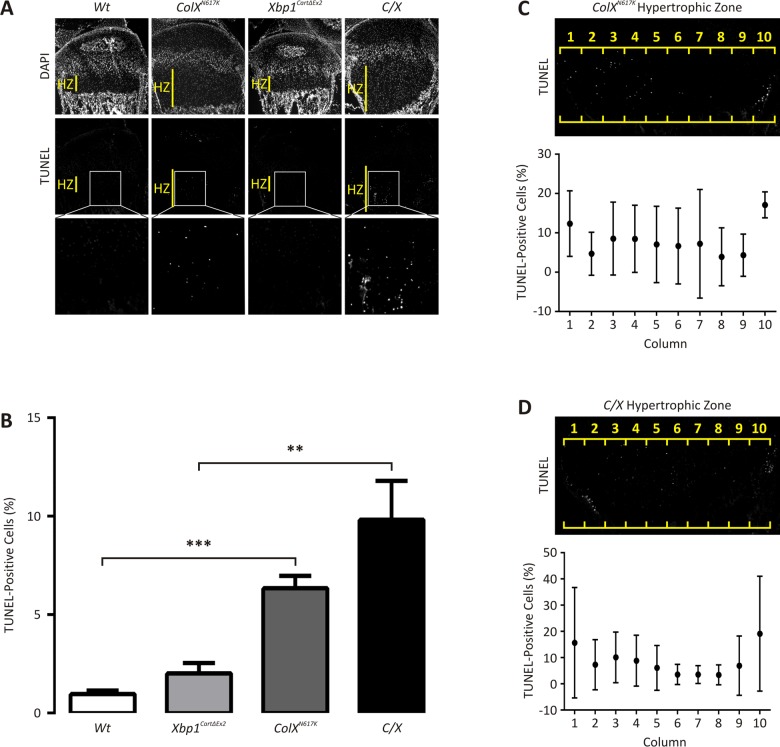
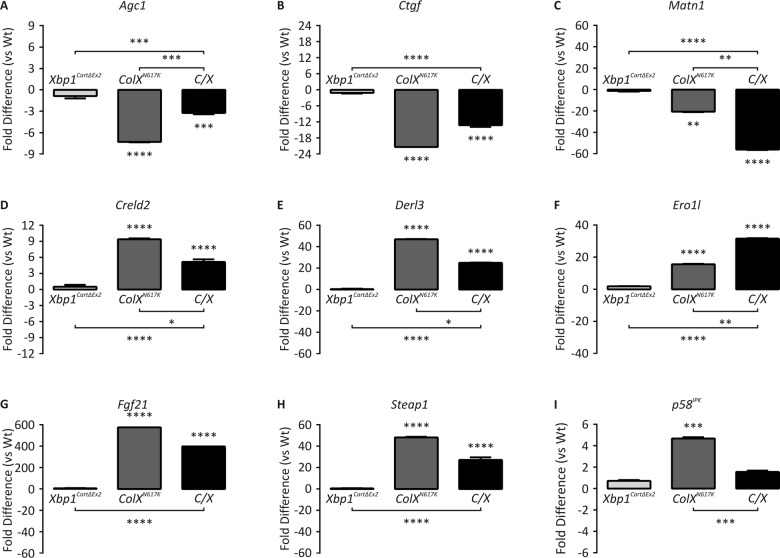
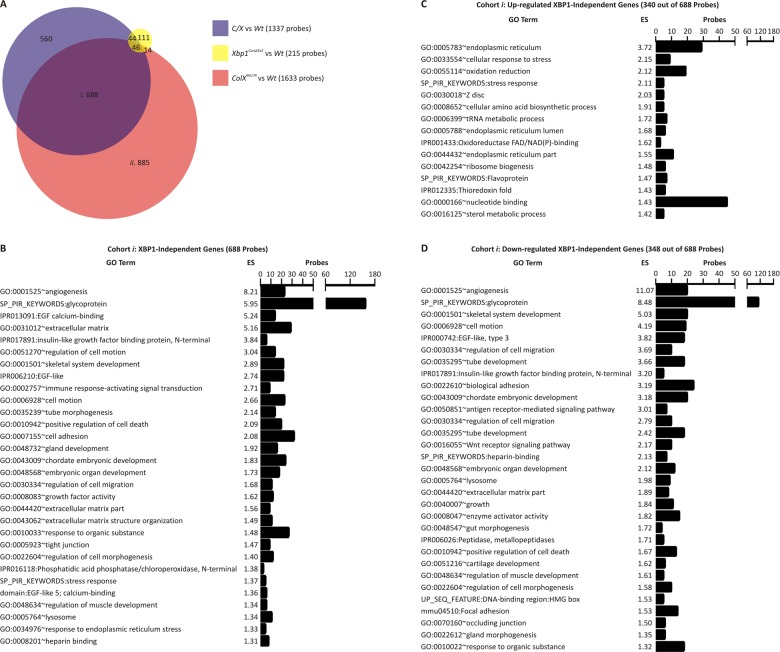
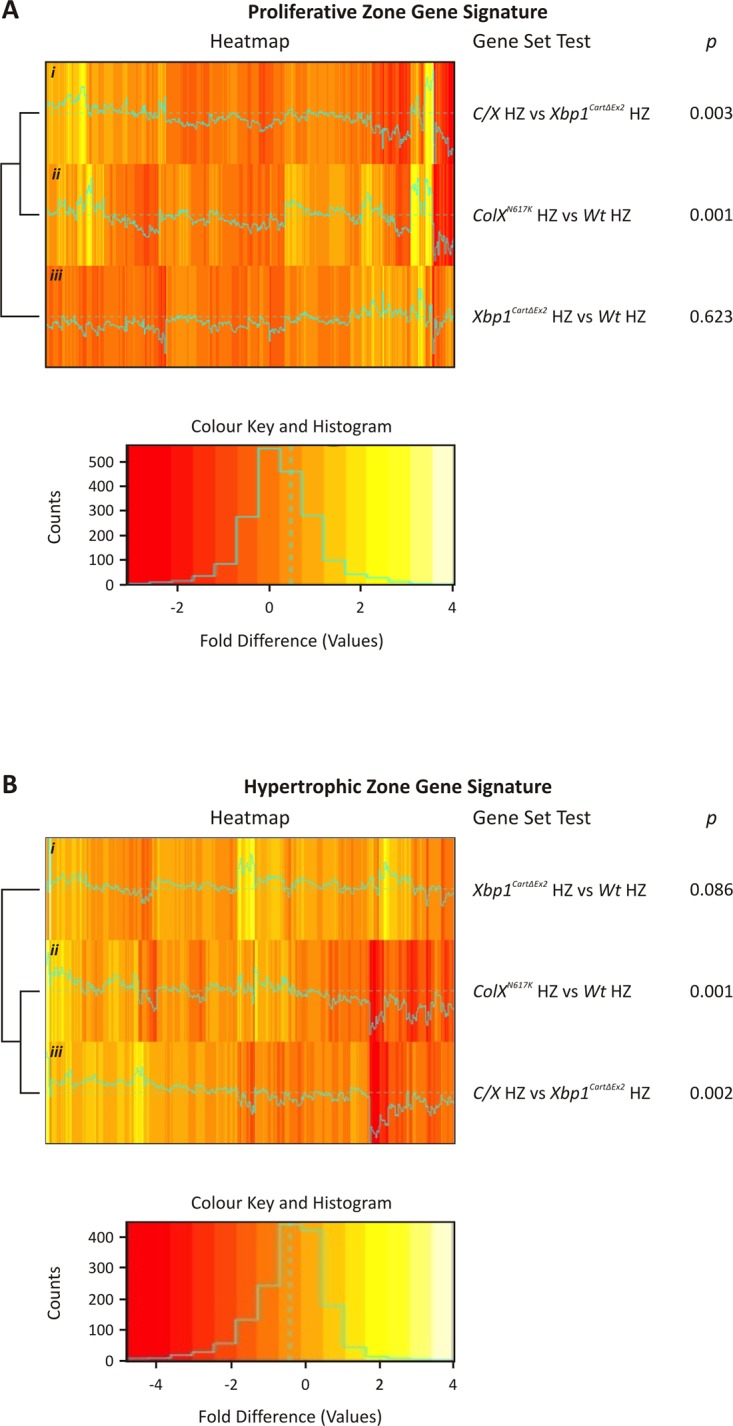
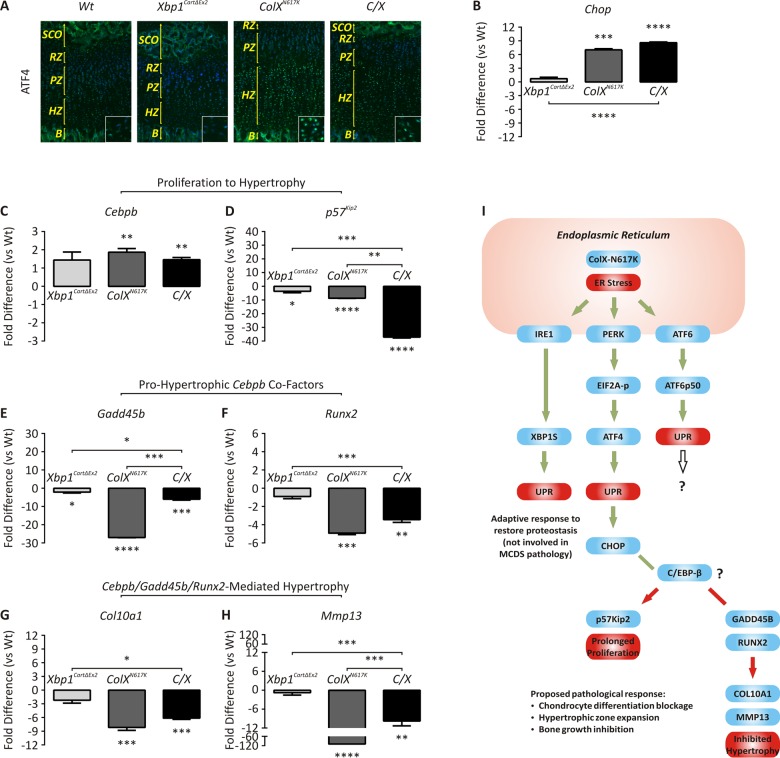
Schmid metaphyseal chondrodysplasia (MCDS) involves dwarfism and growth plate cartilage hypertrophic zone expansion resulting from dominant mutations in the hypertrophic zone collagen, Col10a1. Mouse models phenocopying MCDS through the expression of an exogenous misfolding protein in the endoplasmic reticulum (ER) in hypertrophic chondrocytes have demonstrated the central importance of ER stress in the pathology of MCDS. The resultant unfolded protein response (UPR) in affected chondrocytes involved activation of canonical ER stress sensors, IRE1, ATF6, and PERK with the downstream effect of disrupted chondrocyte differentiation. Here, we investigated the role of the highly conserved IRE1/XBP1 pathway in the pathology of MCDS. Mice with a MCDS collagen X p.N617K knock-in mutation (ColXN617K) were crossed with mice in which Xbp1 was inactivated specifically in cartilage (Xbp1CartΔEx2), generating the compound mutant, C/X. The severity of dwarfism and hypertrophic zone expansion in C/X did not differ significantly from ColXN617K, revealing surprising redundancy for the IRE1/XBP1 UPR pathway in the pathology of MCDS. Transcriptomic analyses of hypertrophic zone cartilage identified differentially expressed gene cohorts in MCDS that are pathologically relevant (XBP1-independent) or pathologically redundant (XBP1-dependent). XBP1-independent gene expression changes included large-scale transcriptional attenuation of genes encoding secreted proteins and disrupted differentiation from proliferative to hypertrophic chondrocytes. Moreover, these changes were consistent with disruption of C/EBP-β, a master regulator of chondrocyte differentiation, by CHOP, a transcription factor downstream of PERK that inhibits C/EBP proteins, and down-regulation of C/EBP-β transcriptional co-factors, GADD45-β and RUNX2. Thus we propose that the pathology of MCDS is underpinned by XBP1 independent UPR-induced dysregulation of C/EBP-β-mediated chondrocyte differentiation. Our data suggest that modulation of C/EBP-β activity in MCDS chondrocytes may offer therapeutic opportunities.
Conflict of interest statement
The authors have declared that no competing interests exist.
Figures
Similar articles
-
Cartilage-specific ablation of XBP1 signaling in mouse results in a chondrodysplasia characterized by reduced chondrocyte proliferation and delayed cartilage maturation and mineralization.Osteoarthritis Cartilage. 2015 Apr;23(4):661-70. doi: 10.1016/j.joca.2015.01.001. Epub 2015 Jan 17. Osteoarthritis Cartilage. 2015. PMID: 25600960
-
Transcriptional profiling of chondrodysplasia growth plate cartilage reveals adaptive ER-stress networks that allow survival but disrupt hypertrophy.PLoS One. 2011;6(9):e24600. doi: 10.1371/journal.pone.0024600. Epub 2011 Sep 15. PLoS One. 2011. PMID: 21935428 Free PMC article.
-
Targeted induction of endoplasmic reticulum stress induces cartilage pathology.PLoS Genet. 2009 Oct;5(10):e1000691. doi: 10.1371/journal.pgen.1000691. Epub 2009 Oct 16. PLoS Genet. 2009. PMID: 19834559 Free PMC article.
-
The Roles of Endoplasmic Reticulum Stress in the Pathophysiological Development of Cartilage and Chondrocytes.Curr Pharm Des. 2017;23(11):1693-1704. doi: 10.2174/1381612822666161025152423. Curr Pharm Des. 2017. PMID: 27784237 Review.
-
IRE1 signaling regulates chondrocyte apoptosis and death fate in the osteoarthritis.J Cell Physiol. 2022 Jan;237(1):118-127. doi: 10.1002/jcp.30537. Epub 2021 Jul 23. J Cell Physiol. 2022. PMID: 34297411 Free PMC article. Review.
Cited by
-
Genetic Disorders of the Extracellular Matrix.Anat Rec (Hoboken). 2020 Jun;303(6):1527-1542. doi: 10.1002/ar.24086. Epub 2019 Mar 6. Anat Rec (Hoboken). 2020. PMID: 30768852 Free PMC article. Review.
-
ER-phagy restrains inflammatory responses through its receptor UBAC2.EMBO J. 2024 Nov;43(21):5057-5084. doi: 10.1038/s44318-024-00232-z. Epub 2024 Sep 16. EMBO J. 2024. PMID: 39284914 Free PMC article.
-
Identification of key genes associated with Schmid-type metaphyseal chondrodysplasia based on microarray data.Int J Mol Med. 2017 Jun;39(6):1428-1436. doi: 10.3892/ijmm.2017.2954. Epub 2017 Apr 19. Int J Mol Med. 2017. PMID: 28440393 Free PMC article.
-
Suppressing UPR-dependent overactivation of FGFR3 signaling ameliorates SLC26A2-deficient chondrodysplasias.EBioMedicine. 2019 Feb;40:695-709. doi: 10.1016/j.ebiom.2019.01.010. Epub 2019 Jan 23. EBioMedicine. 2019. PMID: 30685387 Free PMC article.
-
The circUbqln1, regulated by XBP1s, interplays with 14-3-3ζ to inhibit collagen synthesis and promote osteoarthritis by controlling PRODH activity and proline metabolism.J Adv Res. 2024 Dec;66:267-284. doi: 10.1016/j.jare.2024.01.007. Epub 2024 Jan 12. J Adv Res. 2024. PMID: 38219870 Free PMC article.
References
-
- Mackie EJ, Ahmed YA, Tatarczuch L, Chen KS, Mirams M (2008) Endochondral ossification: how cartilage is converted into bone in the developing skeleton. Int J Biochem Cell Biol 40: 46–62. - PubMed
-
- Ron D, Walter P (2007) Signal integration in the endoplasmic reticulum unfolded protein response. Nat Rev Mol Cell Biol 8: 519–529. - PubMed
-
- Schroder M, Kaufman RJ (2005) The mammalian unfolded protein response. Annu Rev Biochem 74: 739–789. - PubMed
Publication types
MeSH terms
Substances
Grants and funding
LinkOut - more resources
Full Text Sources
Other Literature Sources
Medical
Molecular Biology Databases
Research Materials
