. 2015 Sep 15:6:8244.
doi: 10.1038/ncomms9244.

dNP2 is a blood-brain barrier-permeable peptide enabling ctCTLA-4 protein delivery to ameliorate experimental autoimmune encephalomyelitis

Affiliations

dNP2 is a blood-brain barrier-permeable peptide enabling ctCTLA-4 protein delivery to ameliorate experimental autoimmune encephalomyelitis

Sangho Lim et al. Nat Commun. .

Abstract

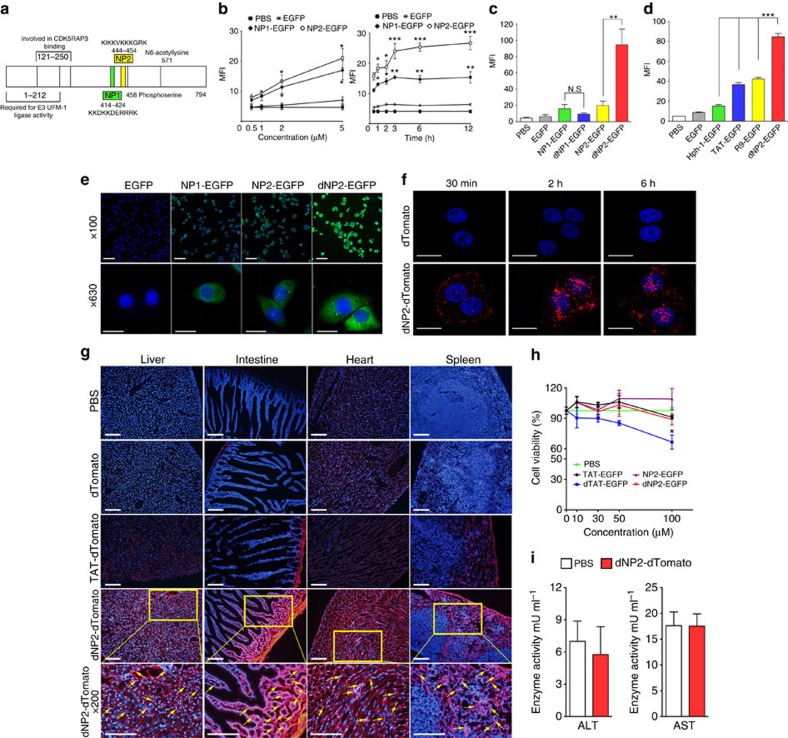
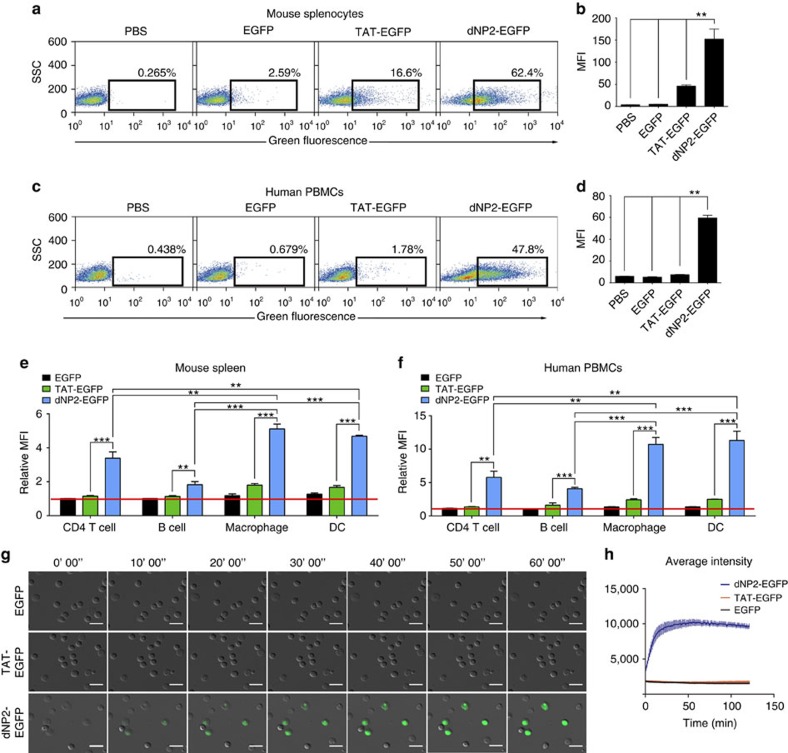
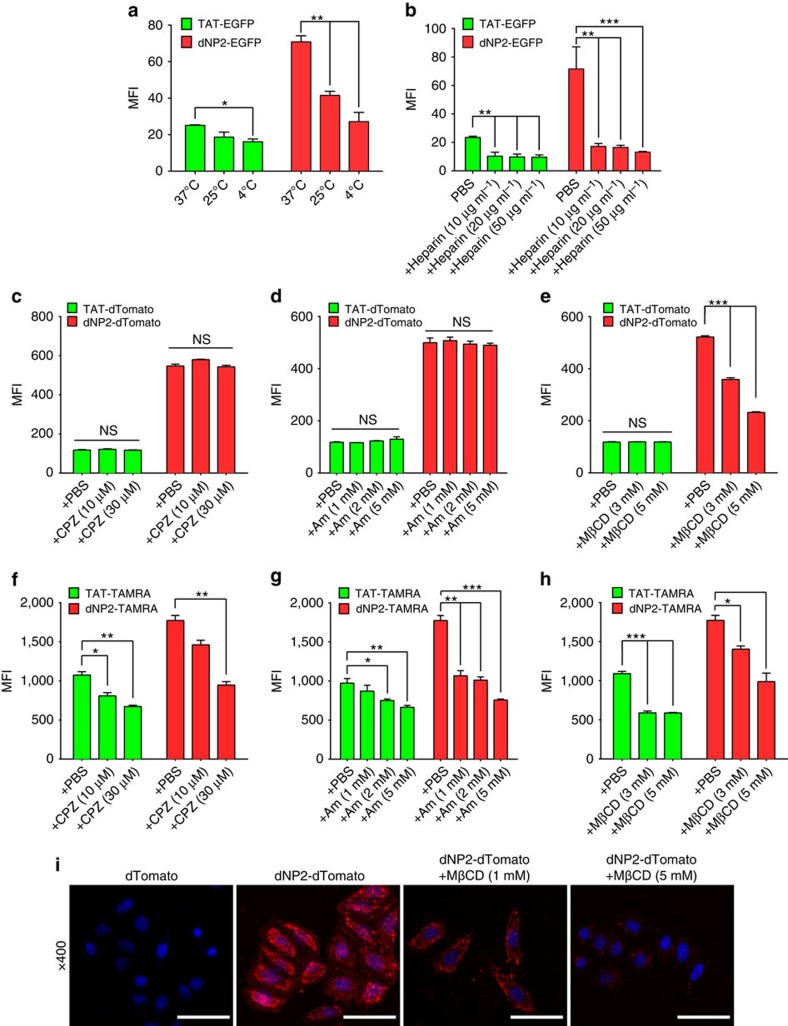
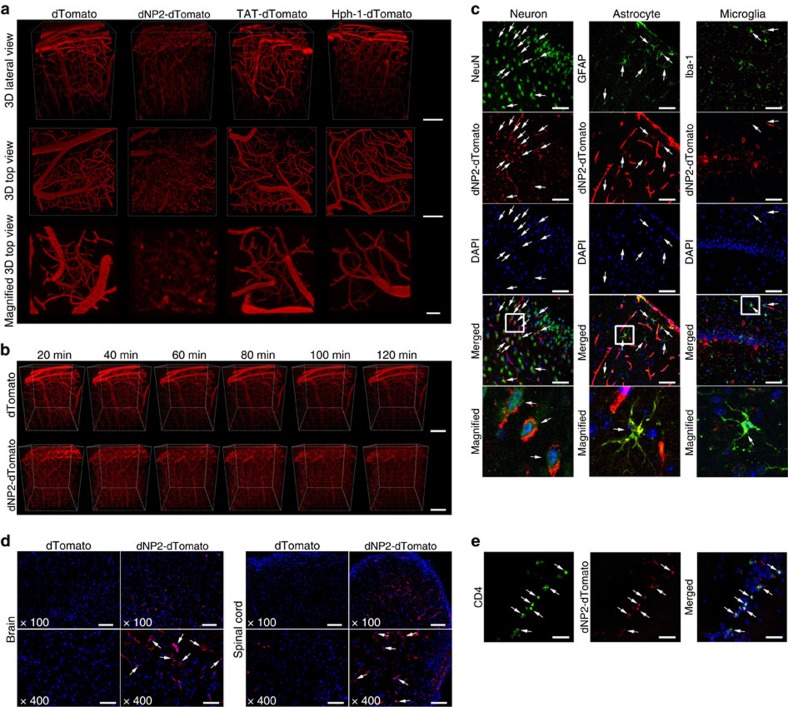
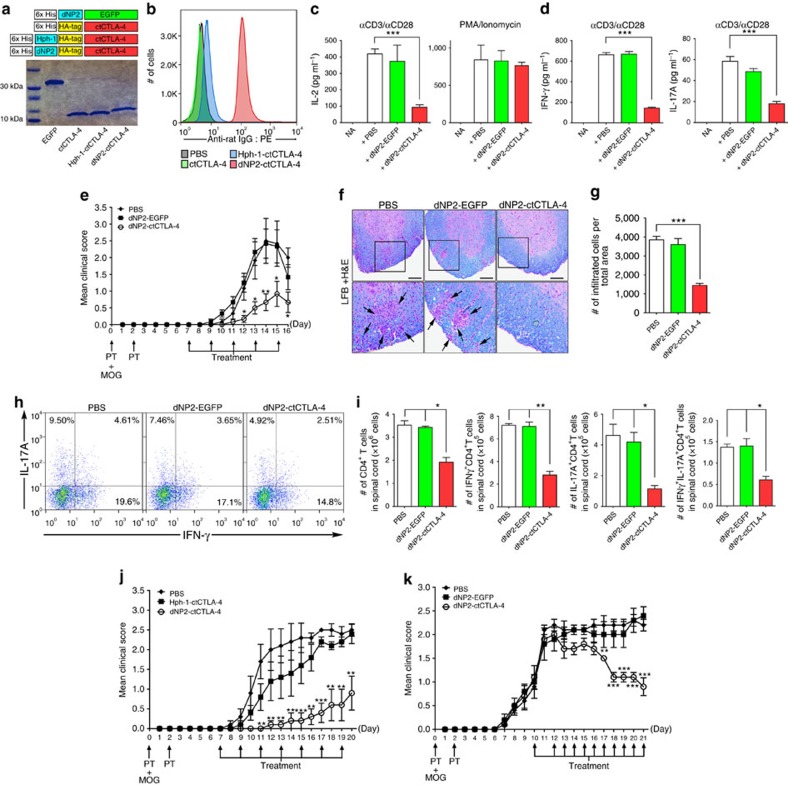
Central nervous system (CNS)-infiltrating effector T cells play critical roles in the development and progression of multiple sclerosis (MS). However, current drugs for MS are very limited due to the difficulty of delivering drugs into the CNS. Here we identify a cell-permeable peptide, dNP2, which efficiently delivers proteins into mouse and human T cells, as well as various tissues. Moreover, it enters the brain tissue and resident cells through blood vessels by penetrating the tightly organized blood-brain barrier. The dNP2-conjugated cytoplasmic domain of cytotoxic T-lymphocyte antigen 4 (dNP2-ctCTLA-4) negatively regulates activated T cells and shows inhibitory effects on experimental autoimmune encephalomyelitis in both preventive and therapeutic mouse models, resulting in the reduction of demyelination and CNS-infiltrating T helper 1 and T helper 17 cells. Thus, this study demonstrates that dNP2 is a blood-brain barrier-permeable peptide and dNP2-ctCTLA-4 could be an effective agent for treating CNS inflammatory diseases such as MS.


Conflict of interest statement

S. L., W.-J.K., Y.-H.K., and J.-M.C. are inventors on a patent application describing the use of dNP2 as drug delivery peptide and therapeutic use of dNP2-ctCTLA-4 in multiple sclerosis. The remaining authors declare no competing financial interests.

Figures

Figure 1
Figure 1. Identification and optimization of a human-derived cell-permeable peptide, dNP2.
(a) The NP1 and NP2 sequences are located in a central domain of human NLBP. (b) Jurkat T cells were incubated with various concentrations (0.5–5 μM) of EGFP, NP1- and NP2-EGFP for 2 h and various time periods (0.5–12 h) with 5 μM protein. Intracellular fluorescence was analysed by flow cytometry and is represented as mean fluorescence intensity (MFI) of the cells. (c) Jurkat T cells were incubated with 5 μM EGFP, NP1-, dNP1-, NP2-, dNP2-EGFP or PBS for 2 h and the data were analysed as described above. (d) Jurkat T cells were incubated with 5 μM EGFP, Hph-1-, TAT-, R9-, dNP2-EGFP or PBS for 2 h and the data were analysed described above. (e) HeLa cells were visualized after a 2 h incubation with EGFP, NP1- NP2 or dNP2-EGFP (20 μM) using a DeltaVision system at × 100 (Scale bar, 100 μm) or × 500 (Scale bar, 20 μm) magnification. (f) The nuclear localization of the dNP2-dTomato in HeLa cells was observed after a 30 min, 2 or 6 h incubation with the proteins using a confocal microscope at × 400 (Scale bar, 20 μm) magnification. (g) Five milligrams dTomato, TAT- or dNP2-dTomato was intraperitoneally injected into 7-week-old female C57BL/6 mice. At 2 h after injection, the tissues were harvested and prepared as frozen slides. The nuclei were stained with Hoechst and fluorescence was observed via fluorescence microscopy. Yellow boxes in the images indicate magnified region ( × 100; Scale bar, 200 μm, × 200; Scale bar, 100 μm). (h) HeLa cells were incubated with various concentrations (10, 30, 50 or 100 μM) of TAT-, dTAT-, NP2-, dNP2-EGFP or PBS for 24 h. Cell viability was analysed by water-soluble tetrazolium-8 based cell counting kit-8 (CCK-8). (i) Alanine aminotransferase (ALT) activity and aspartate aminotransferase (AST) activity in serum of every other day injected mice by 5 mg kg−1 dNP2-dTomato, dNP2-ctCTLA-4 or PBS for 14 days were measured using an ALT/AST activity assay kit. Values are mean±s.e.m. and *P<0.05; **P<0.01; ***P<0.001; Student's t-test.
Figure 2
Figure 2. Protein delivery efficiency of dNP2 in primary mouse and human immune cells.
(a,b) Mouse primary splenocytes were isolated from 6-week-old female C57BL/6 mice and the cells were incubated with 5 μM EGFP, TAT- and dNP2-EGFP for 2 h. Intracellular fluorescence was analysed by flow cytometry and the data are represented as dot plots or mean fluorescence intensity (MFI) of the cells. (c,d) Human PBMCs were isolated from healthy donor blood and the cells were incubated with 5 μM EGFP, TAT-, dNP2-EGFP for 2 h. The data were analysed as described above. (e) Total splenocytes were incubated with 1 μM EGFP, TAT-, and dNP2-EGFP for 2 h. Cells were gated using markers specific for CD4 T cells (CD4+), B cells (CD19+), macrophages (CD11cloCD11bhiF480+) and DCs (CD11chiMHCIIhi). The EGFP signal in each cell population was then analysed by flow cytometric analysis. The relative MFI value was normalization to PBS treated cells. The red line indicates relative MFI of PBS-treated cells. (f) Total PBMCs were incubated with 1 μM EGFP, TAT-, and dNP2-EGFP for 2 h. Cells were gated with markers specific for CD4 T cells (CD4+), B cells (CD19+), macrophages (CD11b+) and DCs (CD11c+) and the data were then analysed as described above. (g) Time-lapse images of mouse CD4 T cells incubated with 1 μM EGFP, TAT- and dNP2-EGFP were acquired for 2 h (Scale bar, 15 μm) and (h) the average fluorescence intensities of 10 cells from each sample were calculated and plotted. Values are mean±s.e.m. and **P<0.01; ***P<0.001; Student's t-test.
Figure 3
Figure 3. Intracellular delivery mechanisms of dNP2.
(a) Splenocytes from 6-week-old female C57BL/6 mice were incubated with 5 μM TAT- or dNP2-EGFP at various temperatures (4, 25 or 37 °C) for 2 h. The intracellular EGFP signal of gated CD4 T cells was analysed by flow cytometric analysis and the data are represented as mean fluorescence intensity (MFI). (b) The splenocytes were pretreated with 0, 10, 20 or 50 μg ml−1 heparin at 37 °C for 30 min and the cells were then further incubated with 5 μM TAT- or dNP2-EGFP at 37 °C for 2 h. The intracellular EGFP protein signal of gated CD4 T cells was analysed and the data are represented as described above. (ch) The splenocytes were pre-treated with the indicated concentrations of chlorpromazine (CPZ), amiloride (Am) or methyl-beta cyclodextrin (MβCD) at 37 °C for 30 min and cells were further incubated with (ce) 5 μM TAT- or dNP2-dTomato or (fh) 5 μM TAMRA-labeled TAT or dNP2 peptide at 37 °C for 1 h. The intracellular dTomato protein signal or TAMRA signal in the CD4 T cells were analysed by flow cytometry. (i) HeLa cells were pre-treated with 1–5 mM MβCD or PBS on ice for 10 min and the cells were further incubated with 20 μM dTomato or dNP2-dTomato at 37 °C for 1 h. The intracellular localization of the dTomato protein was visualized by fluorescent microscopy ( × 400, Scale bar, 75 μm). Values are mean±s.e.m. and *P<0.05; **P<0.01; ***P<0.001; Student's t-test.
Figure 4
Figure 4. Protein delivery efficiency of dNP2 in brain and spinal cord.
2.5 mg dTomato, Hph-1-, TAT-, and dNP2-dTomato proteins were intravenously injected into 8-week-old male C57BL/6 mice through the tail vein after anaesthesia for real-time live confocal microscopic analysis. (a) Mouse brains were observed at 40 min after injection via multi-photon confocal microscopy using a 3D lateral view and 3D top view or magnified 3D top view (Scale bar, 100 μm). (b) The fluorescent diffusion of the dNP2-dTomato protein out of blood vessels in the brain was monitored from 20–120 min (Scale bar, 50 μm). (c) Co-localization of the dNP2-dTomato (red) signal with fluorescent signals specific for various cell types, including neurons (NeuN, green), astrocytes (GFAP, green), and microglia (Iba-1, green), in frozen sectioned brain tissue following confocal microscopy ( × 400, Scale bar, 50 μm) is indicated by white arrows. White boxes in the merged images are magnified regions. (de) EAE was induced in mice as described in the Materials and Method section, 2.5 mg of the dTomato or dNP2-dTomato proteins were subsequently injected intravenously. After 1 h, the brain and spinal cord tissues were harvested and prepared as frozen slides. (d) The cellular localization of the dNP2-dTomato protein in the brain or spinal cord tissues was visualized by fluorescence microscopy ( × 100; Scale bar, 200 μm, × 400; Scale bar, 50 μm). (e) The co-localization of the dNP2-dTomato protein with CD4-positive cells (green) was analysed by fluorescence microscopy ( × 400, Scale bar, 50 μm) and is indicated as white arrows.
Figure 5
Figure 5. Inhibition of effector T cell functions and amelioration of EAE by dNP2-ctCTLA-4.
(a) DNA constructs and purified proteins. (b) Mouse splenocytes were incubated with 1 μM ctCTLA-4, Hph-1-, and dNP2-ctCTLA-4 for 1 h and the intracellular ctCTLA-4 proteins were stained with an anti-HA antibody and the signal was amplified with PE-conjugated anti-rabbit IgG antibody. Intracellular fluorescence was analysed by flow cytometry. (c) Splenocytes from 6-week-old female C57BL/6 mice were activated with anti-CD3/CD28 antibody or PMA/ionomycin in the presence of 1 μM PBS, dNP2-EGFP or dNP2-ctCTLA-4 for 24 h. The concentration of IL-2 was determined by ELISA assay. (d) The supernatants of anti-CD3/CD28 antibody stimulated cells were analysed for IFN-γ and IL-17A by ELISA assay. (ei) EAE was induced in 7-week-old female C57BL/6 mice as described in the Methods section. The mice were treated intraperitoneally with PBS or 25 μg dNP2-EGFP or dNP2-ctCTLA-4 on day 7 after MOG immunization and subsequently treated every other day (prevention scheme, n=15). (e) The clinical scores were monitored and (f) spinal cord tissues were harvested and observed after Luxol fast blue (LFB) and hematoxylin and eosin staining to determine demyelination and tissue inflammation levels (Scale bar, 100 μm). (g) The number of spinal cord tissue infiltrating cells was counted via Image J software. (h) The spinal cord cells were isolated and IL-17A and/or IFN-γ expressing CD4 T cells were analysed by flow cytometry. (i) Absolute cell numbers in single-cell suspended fractions from the spinal cord were counted and multiplied to determine the proportion of total CD4+, IFNγ+ CD4+, IL-17A+CD4+ and IFNγ+IL-17A+CD4+ cells. The data are represented as bar graphs (n=15). (j) EAE was induced as described above. The mice were intraperitoneally treated with 25 μg Hph-1-, dNP2-ctCTLA-4 or PBS every other day from day 7. The clinical scores were monitored every day (n=5). (k) EAE was induced as described above, then the mice were treated with 100 μg dNP2-EGFP, dNP2-ctCTLA-4 proteins or PBS every day after the clinical score reached 1 (day 10, n=5). Values are mean±s.e.m. and *P<0.05; **P<0.01; ***P<0.001; Student's t-test.

Similar articles

Cited by

References

    1. Trapp B. D., Ransohoff R. & Rudick R. Axonal pathology in multiple sclerosis: relationship to neurologic disability. Curr. Opin. Neurol. 12, 295–302 (1999). - PubMed
    1. Rangachari M. & Kuchroo V. K. Using EAE to better understand principles of immune function and autoimmune pathology. J. Autoimmun. 45, 31–39 (2013). - PMC - PubMed
    1. Goverman J. Autoimmune T cell responses in the central nervous system. Nat. Rev. Immunol. 9, 393–407 (2009). - PMC - PubMed
    1. Pierson E., Simmons S. B., Castelli L. & Goverman J. M. Mechanisms regulating regional localization of inflammation during CNS autoimmunity. Immunol. Rev. 248, 205–215 (2012). - PMC - PubMed
    1. Wingerchuk D. M. & Carter J. L. Multiple sclerosis: current and emerging disease-modifying therapies and treatment strategies. Mayo Clin. Proc. 89, 225–240 (2014). - PubMed

Publication types