

Growth Hormone Receptor Antagonist Transgenic Mice Have Increased Subcutaneous Adipose Tissue Mass, Altered Glucose Homeostasis and No Change in White Adipose Tissue Cellular Senescence
- PMID: 26372907
- PMCID: PMC4760896
- DOI: 10.1159/000439050
Growth Hormone Receptor Antagonist Transgenic Mice Have Increased Subcutaneous Adipose Tissue Mass, Altered Glucose Homeostasis and No Change in White Adipose Tissue Cellular Senescence
Abstract
Background: Growth hormone (GH)-resistant/deficient mice experience improved glucose homeostasis and substantially increased lifespan. Recent evidence suggests that long-lived GH-resistant/deficient mice are protected from white adipose tissue (WAT) dysfunction, including WAT cellular senescence, impaired adipogenesis and loss of subcutaneous WAT in old age. This preservation of WAT function has been suggested to be a potential mechanism for the extended lifespan of these mice.
Objective: The objective of this study was to examine WAT senescence, WAT distribution and glucose homeostasis in dwarf GH receptor antagonist (GHA) transgenic mice, a unique mouse strain having decreased GH action but normal longevity.
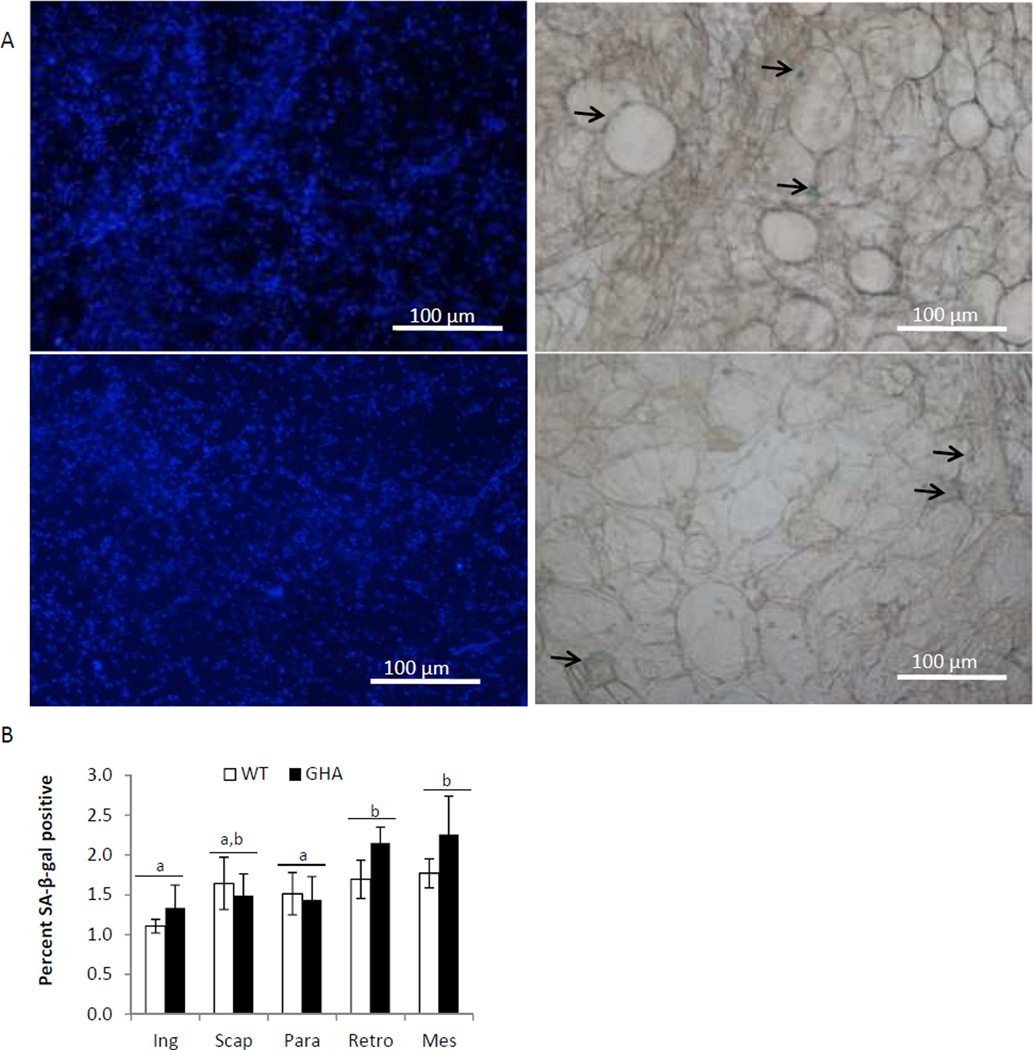
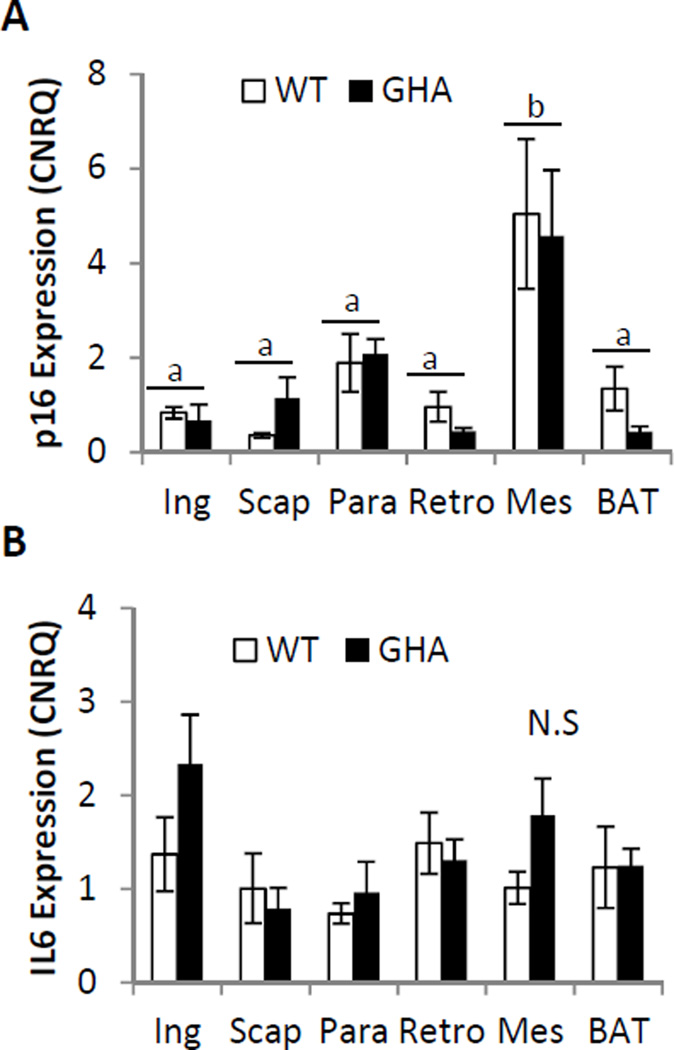
Methods: 18-month-old female GHA mice and wild-type (WT) littermate controls were used. Prior to dissection, body composition, fasting blood glucose as well as glucose and insulin tolerance tests were performed. WAT distribution was determined by weighing four distinct WAT depots at the time of dissection. Cellular senescence in four WAT depots was assessed using senescence-associated β-galactosidase staining to quantify the senescent cell burden, and real-time qPCR to quantify gene expression of senescence markers p16 and IL-6.
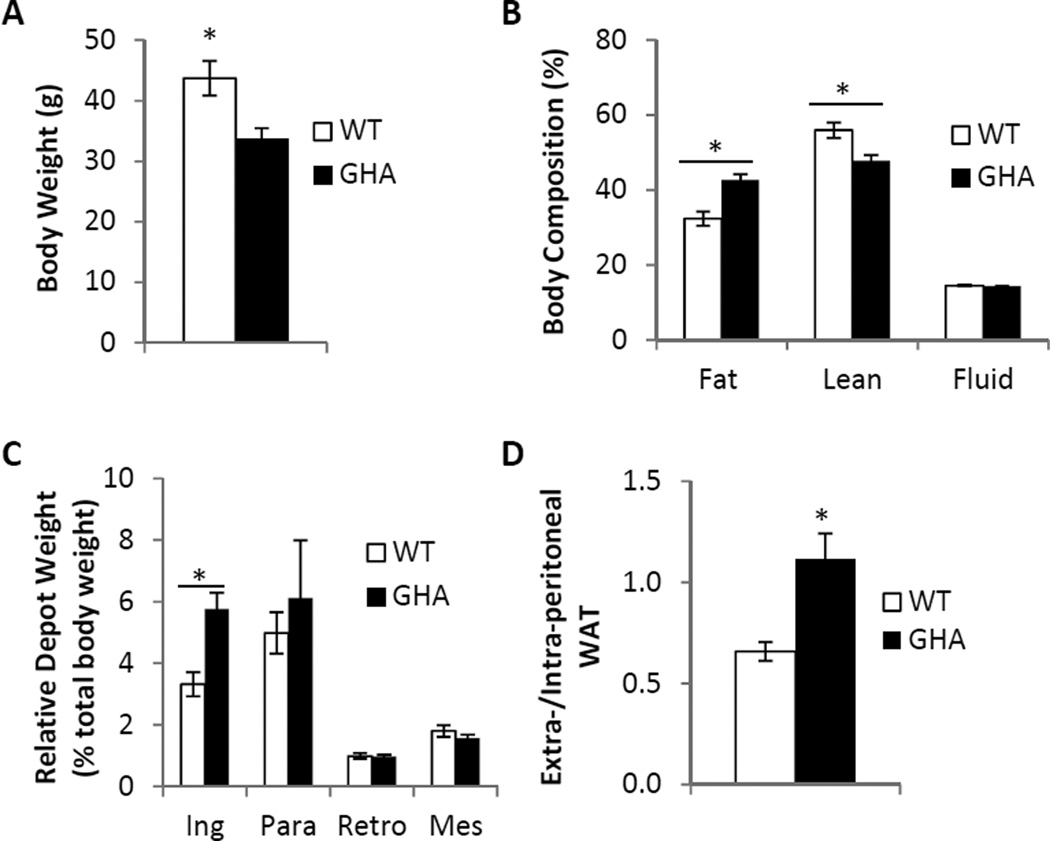
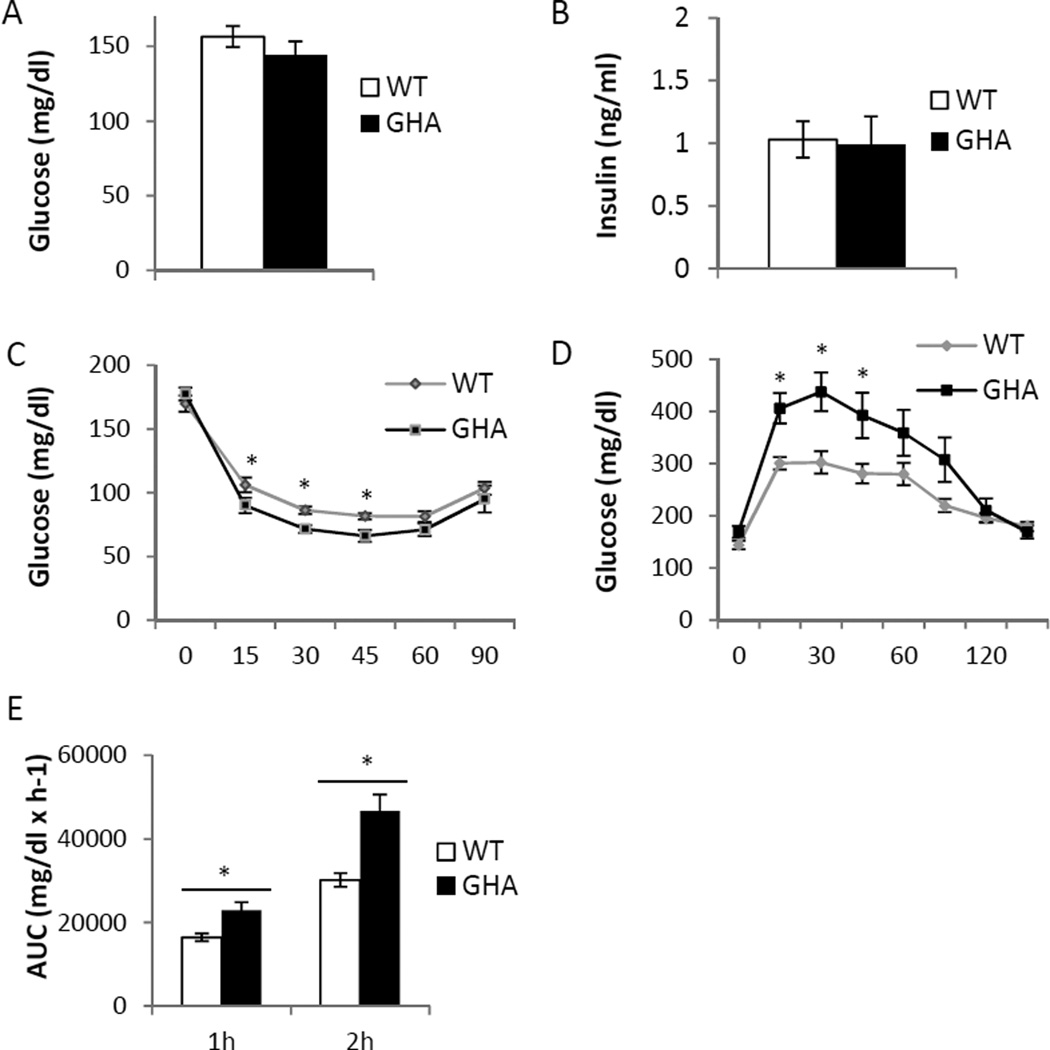
Results: GHA mice had a 22% reduction in total body weight, a 33% reduction in lean mass and a 10% increase in body fat percentage compared to WT controls. GHA mice had normal fasting blood glucose and improved insulin sensitivity; however, they exhibited impaired glucose tolerance. Moreover, GHA mice displayed enhanced lipid storage in the inguinal subcutaneous WAT depot (p < 0.05) and a 1.7-fold increase in extra-/intraperitoneal WAT ratio compared to controls (p < 0.05). Measurements of WAT cellular senescence showed no difference between GHA mice and WT controls.
Conclusions: Similar to other mice with decreased GH action, female GHA mice display reduced age-related lipid redistribution and improved insulin sensitivity, but no change in cellular senescence. The similar abundance of WAT senescent cells in GHA and control mice suggests that any protection against generation of senescent cells afforded by decreased GH action, low insulin-like growth factor 1 and/or improved insulin sensitivity in the GHA mice may be offset by their severe adiposity, since obesity is known to increase senescence.
© 2015 S. Karger AG, Basel.
Conflict of interest statement
Conflicts of Interest: None
Figures
Similar articles
-
Increased fibrosis: A novel means by which GH influences white adipose tissue function.Growth Horm IGF Res. 2018 Apr;39:45-53. doi: 10.1016/j.ghir.2017.12.010. Epub 2017 Dec 20. Growth Horm IGF Res. 2018. PMID: 29279183 Free PMC article.
-
Growth hormone receptor antagonist transgenic mice are protected from hyperinsulinemia and glucose intolerance despite obesity when placed on a HF diet.Endocrinology. 2015 Feb;156(2):555-64. doi: 10.1210/en.2014-1617. Epub 2014 Nov 18. Endocrinology. 2015. PMID: 25406017 Free PMC article.
-
A dwarf mouse model with decreased GH/IGF-1 activity that does not experience life-span extension: potential impact of increased adiposity, leptin, and insulin with advancing age.J Gerontol A Biol Sci Med Sci. 2014 Feb;69(2):131-41. doi: 10.1093/gerona/glt069. Epub 2013 May 21. J Gerontol A Biol Sci Med Sci. 2014. PMID: 23695394 Free PMC article.
-
Altered structure and function of adipose tissue in long-lived mice with growth hormone-related mutations.Adipocyte. 2017 Apr 3;6(2):69-75. doi: 10.1080/21623945.2017.1308990. Epub 2017 Mar 21. Adipocyte. 2017. PMID: 28425851 Free PMC article. Review.
-
Cellular Senescence in Diabetes Mellitus: Distinct Senotherapeutic Strategies for Adipose Tissue and Pancreatic β Cells.Front Endocrinol (Lausanne). 2022 Mar 31;13:869414. doi: 10.3389/fendo.2022.869414. eCollection 2022. Front Endocrinol (Lausanne). 2022. PMID: 35432205 Free PMC article. Review.
Cited by
-
GH Knockout Mice Have Increased Subcutaneous Adipose Tissue With Decreased Fibrosis and Enhanced Insulin Sensitivity.Endocrinology. 2019 Jul 1;160(7):1743-1756. doi: 10.1210/en.2019-00167. Endocrinology. 2019. PMID: 31099824 Free PMC article.
-
Growth Hormone's Effect on Adipose Tissue: Quality versus Quantity.Int J Mol Sci. 2017 Jul 26;18(8):1621. doi: 10.3390/ijms18081621. Int J Mol Sci. 2017. PMID: 28933734 Free PMC article. Review.
-
Developments in our understanding of the effects of growth hormone on white adipose tissue from mice: implications to the clinic.Expert Rev Endocrinol Metab. 2016;11(2):197-207. doi: 10.1586/17446651.2016.1147950. Epub 2016 Feb 24. Expert Rev Endocrinol Metab. 2016. PMID: 28435436 Free PMC article.
-
The effects of growth hormone on adipose tissue: old observations, new mechanisms.Nat Rev Endocrinol. 2020 Mar;16(3):135-146. doi: 10.1038/s41574-019-0280-9. Epub 2019 Nov 28. Nat Rev Endocrinol. 2020. PMID: 31780780 Free PMC article. Review.
-
Mouse models of growth hormone insensitivity.Rev Endocr Metab Disord. 2021 Mar;22(1):17-29. doi: 10.1007/s11154-020-09600-6. Epub 2020 Oct 10. Rev Endocr Metab Disord. 2021. PMID: 33037595 Free PMC article. Review.
References
-
- Kuk JL, et al. Age-related changes in total and regional fat distribution. Ageing research reviews. 2009;8(4):339–348. - PubMed
-
- Wajchenberg BL. Subcutaneous and visceral adipose tissue: their relation to the metabolic syndrome. Endocrine reviews. 2000;21(6):697–738. - PubMed
-
- Ibrahim MM. Subcutaneous and visceral adipose tissue: structural and functional differences. Obesity reviews : an official journal of the International Association for the Study of Obesity. 2010;11(1):11–18. - PubMed
-
- Goodpaster BH, et al. Association between regional adipose tissue distribution and both type 2 diabetes and impaired glucose tolerance in elderly men and women. Diabetes care. 2003;26(2):372–379. - PubMed
Publication types
MeSH terms
Substances
Grants and funding
LinkOut - more resources
Full Text Sources
Other Literature Sources
Medical
