. 2015 Nov;33(11):1152-8.
doi: 10.1038/nbt.3344.

Comprehensive analysis of cancer-associated somatic mutations in class I HLA genes

Comprehensive analysis of cancer-associated somatic mutations in class I HLA genes

Sachet A Shukla et al. Nat Biotechnol. 2015 Nov.

Abstract

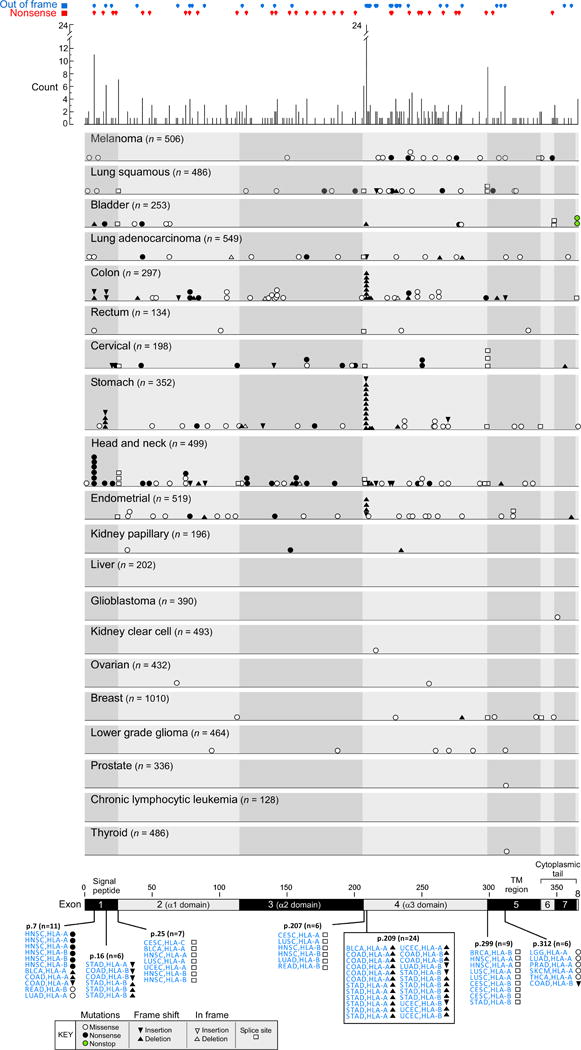
Detection of somatic mutations in human leukocyte antigen (HLA) genes using whole-exome sequencing (WES) is hampered by the high polymorphism of the HLA loci, which prevents alignment of sequencing reads to the human reference genome. We describe a computational pipeline that enables accurate inference of germline alleles of class I HLA-A, B and C genes and subsequent detection of mutations in these genes using the inferred alleles as a reference. Analysis of WES data from 7,930 pairs of tumor and healthy tissue from the same patient revealed 298 nonsilent HLA mutations in tumors from 266 patients. These 298 mutations are enriched for likely functional mutations, including putative loss-of-function events. Recurrence of mutations suggested that these 'hotspot' sites were positively selected. Cancers with recurrent somatic HLA mutations were associated with upregulation of signatures of cytolytic activity characteristic of tumor infiltration by effector lymphocytes, supporting immune evasion by altered HLA function as a contributory mechanism in cancer.


Conflict of interest statement

COMPETING FINANCIAL INTERESTS

Work of this paper is included in patent applications.

Figures

Figure 1
Figure 1. Development and validation of POLYSOLVER for inference of MHC class I type
(a) Schematic of the POLYSOLVER algorithm. (b) Comparative performance of POLYSOLVER (black bars) and other previously reported algorithms, – by library size (error bars correspond to s.d.) using the following performance criteria: (i) sensitivity – the proportion of all true allele species that are correctly identified by the algorithm; (ii) precision – the probability that an inferred allele species is correct; (iii) accuracy – the fraction of total number of alleles that are correctly called; and (iv) homozygosity success rate – the fraction of all homozygous cases that are correctly inferred.
Figure 2
Figure 2. POLYSOLVER for the detection of somatic mutations in MHC class I alleles across cancers
(a) Schema for detection of somatic changes in HLA genes using POLYSOLVER. Mutation detection algorithms Mutect and Strelka were incorporated for calling point mutations and indels respectively, following MHC class I typing of the germline by POLYSOLVER. (b) Comparison of somatic HLA mutations identified by TCGA (yellow) across cancers using standard approaches to those identified by POLYSOLVER (black) (n=2,545). Green – mutations found in common between the two datasets. (c) Number of HLA mutations and the percentage of samples bearing HLA mutations per cancer type identified by standard methods (yellow) and POLYSOLVER (black). (d) Validation of mutations using RNA-Seq and long read sequencing. RNA-Seq based validation was restricted to 49 samples with HLA point mutations (missense, nonsense, non-stop, splice site) identified by exome analysis and with available RNA-Seq data. Long read sequencing using Pacific Biosciences’ SMRT® technology was performed on HLA alleles from 18 samples with available DNA material (Online Methods).
Figure 3
Figure 3. Distribution of HLA mutations across cancers
Distribution of HLA mutations across functional domains and tumor types. Top – Distribution of potential loss-of-function events; out of frame (blue) and nonsense mutations (red). The histogram summarizes the number of events identified at each position. Central panel – Pattern of mutations detected in each tumor type. Bottom – Recurrent events; recurrent positions (with disease, allele group) with frequency >= 5 cases/recurrent site are shown.
Figure 4
Figure 4. Distribution of MHC class I mutations and evidence of positive functional selection
(a) Comparison of spectrum of mutations in non-HLA genes and HLA genes. The ratio of number of mutations of a particular type to the number of silent mutations is compared between the non-HLA and HLA genes for all mutation types (chi-square test, P < 2.2 × 10⁻¹⁶). (b) Distribution of HLA mutations across exons. (c) Mutations in HLA positions that are in actual physical contact with the peptide (contact residues). Left panel – The relative orientation of a 9-mer peptide with respect to the HLA and T cell molecules. Positions 2 and 9 constitute the primary anchors while position 6 forms the secondary anchor with HLA. The remaining position interacts with the T cell molecule. Right panel – The 9 amino acids of the peptide and their corresponding HLA contact residues are indicated along the rows (orange – HLA interacting anchor positions, blue – T cell interacting positions). The histogram depicts the frequency of observed HLA mutations in contact residues corresponding to each peptide position. (d) Killer lymphocyte effector genes are more highly expressed in tumors exhibiting MHC Class I mutation. Unbiased statistical analysis was employed to find genes more highly expressed in tumors harboring a mutation in an MHC class I allele. Heatmap displays color-coded expression ratio of medians (HLA-mutant vs. non-mutant samples) for genes (columns) in each cancer type (rows), excluding cancer types with fewer than 3 instances of HLA mutation in the cohort. Asterisks (* or **, see key) indicate the significance of the association for the given gene in the given cancer type according to one-sided Wilcoxon rank-sum test (null hypothesis: expression is not greater in the mutants). Cytolytic activity (geometric mean of GZMA and PRF1 expression) is included as though a gene. The depicted genes are those for which expression in MHC Class I-mutated tumors was most significantly elevated pan-cancer (unadjusted P < 10−10 combined by Fisher’s method, Supplementary Table 15). Corresponding analysis for genes with reduced expression in MHC Class I mutants was also performed (Supplementary Fig. 5 and Supplementary Table 16).

References

    1. Stransky N, et al. The mutational landscape of head and neck squamous cell carcinoma. Science. 2011;333:1157–1160. - PMC - PubMed
    1. Comprehensive genomic characterization of squamous cell lung cancers. Nature. 2012;489:519–525. - PMC - PubMed
    1. Lohr JG, et al. Discovery and prioritization of somatic mutations in diffuse large B-cell lymphoma (DLBCL) by whole-exome sequencing. Proc Natl Acad Sci U S A. 2012;109:3879–3884. - PMC - PubMed
    1. Lawrence MS, et al. Discovery and saturation analysis of cancer genes across 21 tumour types. Nature. 2014;505:495–501. - PMC - PubMed
    1. Cancer Genome Atlas Research, N. Comprehensive molecular characterization of gastric adenocarcinoma. Nature. 2014;513:202–209. - PMC - PubMed

Publication types

Substances