. 2015 Sep 29;112(39):E5381-90.
doi: 10.1073/pnas.1515281112. Epub 2015 Sep 8.

Structural insight into selectivity and resistance profiles of ROS1 tyrosine kinase inhibitors

Affiliations

Structural insight into selectivity and resistance profiles of ROS1 tyrosine kinase inhibitors

Monika A Davare et al. Proc Natl Acad Sci U S A. .

Abstract

Oncogenic ROS1 fusion proteins are molecular drivers in multiple malignancies, including a subset of non-small cell lung cancer (NSCLC). The phylogenetic proximity of the ROS1 and anaplastic lymphoma kinase (ALK) catalytic domains led to the clinical repurposing of the Food and Drug Administration (FDA)-approved ALK inhibitor crizotinib as a ROS1 inhibitor. Despite the antitumor activity of crizotinib observed in both ROS1- and ALK-rearranged NSCLC patients, resistance due to acquisition of ROS1 or ALK kinase domain mutations has been observed clinically, spurring the development of second-generation inhibitors. Here, we profile the sensitivity and selectivity of seven ROS1 and/or ALK inhibitors at various levels of clinical development. In contrast to crizotinib's dual ROS1/ALK activity, cabozantinib (XL-184) and its structural analog foretinib (XL-880) demonstrate a striking selectivity for ROS1 over ALK. Molecular dynamics simulation studies reveal structural features that distinguish the ROS1 and ALK kinase domains and contribute to differences in binding site and kinase selectivity of the inhibitors tested. Cell-based resistance profiling studies demonstrate that the ROS1-selective inhibitors retain efficacy against the recently reported CD74-ROS1(G2032R) mutant whereas the dual ROS1/ALK inhibitors are ineffective. Taken together, inhibitor profiling and stringent characterization of the structure-function differences between the ROS1 and ALK kinase domains will facilitate future rational drug design for ROS1- and ALK-driven NSCLC and other malignancies.

Keywords: ALK; ROS1; inhibitor; kinase; structural modelling.


Conflict of interest statement

Conflict of interest statement: The Oregon Health & Science University has clinical trial contracts with Novartis and Bristol-Myers Squibb (BMS) to pay for patient costs, nurse and data manager salaries, and institutional overhead. B.J.D. does not derive salary, nor does his laboratory receive funds, from these contracts. M.W.D. served on advisory boards and as a consultant for BMS, ARIAD, and Novartis.

Figures

Fig. 1.
Fig. 1.
Structural differences between the ROS1 and ALK kinase domains underlie the differential selectivity of TKIs. (A) Proliferation of Ba/F3 CD74-ROS1 and EML4-ALK cells after 72-h exposure to cabozantinib, foretinib, crizotinib, brigatinib, ceritinib, AZD3634, and alectinib. Data are normalized to vehicle-treated control, and values shown are the mean ± SEM. (B) Scatter plot of cell proliferation IC50 values for each TKI against Ba/F3 cells expressing CD74-ROS1 (blue) and EML4-ALK (orange). Categories of selectivity profile are indicated above the plot. (C) Immunoblot analysis of phospho-ROS1 from TKI-treated Ba/F3 CD74-ROS1 cells (Upper) and phospho-ALK from TKI-treated Ba/F3 EML4-ALK cells (Lower). (D) Alignment of ROS1 (blue) and ALK (orange) using structural homology (based on Cα atoms). The A-loop is not shown. (E) Surface representation of ROS1 kinase, with P- and A-loops shown in ribbon representation (yellow). The protein surface is colored based on sequence identity between ROS1 and ALK kinase, with red for identical sequence and blue for nonidentical sequence. (F) Ribbon model depicting the rotation of αC-helix in ROS1 and ALK. (G) αC-helix rotation plotted against the volume of the specificity site for ROS1 and ALK kinase calculated from molecular dynamic simulation.
Fig. S1.
Fig. S1.
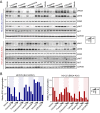
Effect of inhibitors on ROS1 and ALK phosphorylation and downstream signaling in human NSCLC cell lines. (A) Immunoblot analysis of phosphorylated ROS1 (HCC78 only), ALK (H3122 only), ERK, and AKT from HCC78 and H3122 cell lysates treated with TKIs as indicated. (B) Relative levels of ROS1 and ALK phosphorylation. Relative phosphorylation was quantified densitometrically as the ratio of pixel intensity of the phosphorylated protein band to that of the GAPDH band, followed by normalization of the ratios to those of the average of vehicle-treated samples.
Fig. S2.
Fig. S2.
Root mean square deviation (rmsd) plot comparison of ROS1 and ALK. The rmsd was calculated by fitting the trajectory to the initial structure using backbone atoms. The rmsd of the inactive conformations of (A) ROS1 and (B) ALK protein were calculated using 500 ns of MD simulation using three seeds.
Fig. S3.
Fig. S3.
Structural differences between the kinase domains of ROS1 and ALK according to conformational dynamics. (A) Surface representation of the inactive conformation of ROS1, with secondary structure elements [P-loop (magenta), αC-helix (green), A-loop (red)] shown as a schematic model. The ATP binding site (or type I binding pocket) is highlighted as a blue transparent surface, and the specificity site is shown similarly in green. (B) Root mean square fluctuation (RMSF) plot for ROS1 and ALK. The RMSF of active (blue) and inactive (black) conformations of ROS1 and ALK proteins (Upper and Lower, respectively) were calculated using 500 ns of MD simulation. Mean RMSF ± SEM is plotted. Residues encompassing the P-loop, αC-helix, and A-loop are shaded light purple, light green, and light red, respectively. (C) Stabilization of active form of ALK. The overall architecture of active ALK is shown with secondary structure elements highlighted: P-loop (magenta), A-loop (red), and αC-helix (green) (Left). The Right Inset close-up view shows residues lining the hydrophobic pocket. (D) Correlated dynamics of A-loop with the P-loop and αC-helix. (Left) Distance between the A-loop (R2107) and P-loop (F1956) or αC-helix (E1997) of inactive ROS1. (Right) Distance between the A-loop (R1275) and P-loop (F1127) or αC-helix (E1167) of inactive ALK.
Fig. 2.
Fig. 2.
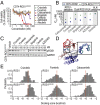
ROS1-selective TKIs retain efficacy against the crizotinib-resistant ROS1G2032R mutant. (A) Dose–response curves for proliferation of Ba/F3 CD74-ROS1G2032R cells after 72-h exposure to varying concentrations of cabozantinib, foretinib, crizotinib, brigatinib, ceritinib, AZD3634, and alectinib. Data are normalized to vehicle-treated cells, and values shown are the mean ± SEM. (B) Scatter plot of cell proliferation IC50 values for each of the indicated TKIs against Ba/F3 cells expressing native CD74-ROS1 (blue) and CD74-ROS1G2032R (green). Categories of selectivity profile are indicated above the plot. (C) Immunoblot analysis of phospho-ROS1 from Ba/F3 CD74-ROS1G2032R cells after treatment with the indicated TKIs. (D) Overlay of crizotinib docking from simulated models with the actual ROS1:crizotinib complex. (E) Docking score histograms for native ROS1 and ROS1G2032R for crizotinib, foretinib, and cabozantinib. A threshold docking score of −6 is indicated by the vertical dashed orange line, where scores above or below this value correspond to poor or good binding conformations, respectively.
Fig. S4.
Fig. S4.
RMSF profiles for native ROS1, ROS1G2032R, and ROS1D2113N. (A) RMSF of active ROS1 (blue) and ROS1G2032R (black) conformations was calculated using 500 ns of MD simulation. Mean RMSF ± SEM is plotted. Residues encompassing the P-loop, αC-helix, and A-loop are shaded in light purple, light green, and light red, respectively. (B) RMSF of inactive ROS1 (blue) and ROS1D2113N (black) conformations were calculated using 500 ns of MD simulation. Mean RMSF ± SEM is plotted. Residues encompassing the P-loop, αC-helix, and A-loop are shaded in light purple, light green, and light red, respectively.
Fig. 3.
Fig. 3.
Structural modeling reveals that the ROS1-selective TKIs cabozantinib and foretinib uniquely bind the inactive conformation of the ROS1 kinase domain. (A) Surface representation of the inactive conformation of ROS1 with the predicted binding of cabozantinib shown as a space-filling mesh (green). The P- and A-loops are shown as ribbons in yellow. (B) Predicted binding poses for cabozantinib and foretinib with inactive ROS1 (Left and Right, respectively). For cabozantinib, a detailed view of specific contact residues is shown (lower left). For foretinib, an alternative, reverse-orientation binding pose is also shown (Lower Right). The P-loop and A-loop are omitted to better illustrate TKI binding. (C) Docking score histograms for the parental conformation docking ensemble and extended, induced-fit conformation docking of cabozantinib to ROS1. (D) Scatter plot showing fold-over-native cell proliferation IC50 values for cabozantinib (blue) and foretinib (red) against Ba/F3 CD74-ROS1 cells with the indicated structurally implicated differentiating residues mutated to alanine substitutions.
Fig. 4.
Fig. 4.
In vitro mutagenesis screens suggest partially overlapping ROS1 point mutation and compound mutation resistance profiles for cabozantinib and foretinib. (A) Outgrowth summaries for cell-based resistance screens starting from Ba/F3 cells expressing native CD74-ROS1. (B) Outgrowth summaries for cell-based resistance screens starting from Ba/F3 CD74-ROS1G2032R cells. Breakdowns of frequency and spectra of mutant clones recovered in the presence of increasing concentrations of cabozantinib and foretinib are shown for assays starting from (C) native CD74-ROS1 and (D) CD74-ROS1G2032R cells. The number of clones sequenced for each condition is indicated, and multiple substitutions at a single position are indicated as stacked bars.
Fig. 5.
Fig. 5.
Mutants recovered from resistance screens for ROS1-selective TKIs, including those involving position D2113, confer varying levels of sensitivity to dual ROS1/ALK inhibitors. Scatter plots of cell proliferation IC50s for the indicated TKIs are shown for Ba/F3 cells expressing (A) CD74-ROS1 point mutations and (B) G2032R-inclusive CD74-ROS1 compound mutations recovered in resistance screens for foretinib and cabozantinib. (C) Heat map depicting differential levels of sensitivity of the CD74-ROS1 point mutations and G2032R-inclusive compound mutations discovered from resistance screens. The indicated color gradient represents fold increase over IC50 for native CD74-ROS1 cells. (D) Ribbon structure description of the inactive ROS1 kinase domain, highlighting four positions implicated in TKI resistance and showing the Cα atom in van der Waals representation. The structural elements of the P-loop (magenta), A-loop (red), and αC-helix (green) are highlighted. (E) Predicted structural consequence of the ROS1D2113N mutation. Positions 2113 and 2120, which form a unique salt-bridge in the mutant kinase (Right), are shown as red balls. The two residues used to evaluate effects of the mutation on the A-loop (R2107) and Cα-helix (E1997) are shown as sidechains in monitoring the shift of the activation loop to resemble a more type I-like conformation in the mutant. (F) A-loop:Cα-helix–correlated conformational shift as measured by distance profiles from simulation of the active and inactive states of native ROS1 and ROS1D2113N.
Fig. S5.
Fig. S5.
The ROS1D2113N mutant selectively compromises the binding of type II, ROS1-selective TKIs. Docking score histograms for native ROS1 and ROS1D2113N for crizotinib, foretinib, and cabozantinib. A threshold docking score of −6 kcal/mol is indicated by the vertical dashed orange line, where scores above or below this value correspond to poor or good binding conformations, respectively.
Fig. S6.
Fig. S6.
Protein alignment of the kinase domains of ROS1, ALK, and other select kinases with respect to positions implicated in resistance to ROS1 and ALK TKI therapies.

Comment in

References

    1. Druker BJ. Perspectives on the development of imatinib and the future of cancer research. Nat Med. 2009;15(10):1149–1152. - PubMed
    1. Druker BJ, et al. IRIS Investigators Five-year follow-up of patients receiving imatinib for chronic myeloid leukemia. N Engl J Med. 2006;355(23):2408–2417. - PubMed
    1. Nowell PC, Hungerford DA. Chromosome studies on normal and leukemic human leukocytes. J Natl Cancer Inst. 1960;25:85–109. - PubMed
    1. Shaw AT, Hsu PP, Awad MM, Engelman JA. Tyrosine kinase gene rearrangements in epithelial malignancies. Nat Rev Cancer. 2013;13(11):772–787. - PMC - PubMed
    1. Grande E, Bolós MV, Arriola E. Targeting oncogenic ALK: A promising strategy for cancer treatment. Mol Cancer Ther. 2011;10(4):569–579. - PubMed

Publication types

MeSH terms