. 2015 Sep 14;28(3):307-317.
doi: 10.1016/j.ccell.2015.07.012.

DNA Methylation and Somatic Mutations Converge on the Cell Cycle and Define Similar Evolutionary Histories in Brain Tumors

Affiliations

DNA Methylation and Somatic Mutations Converge on the Cell Cycle and Define Similar Evolutionary Histories in Brain Tumors

Tali Mazor et al. Cancer Cell. .

Abstract

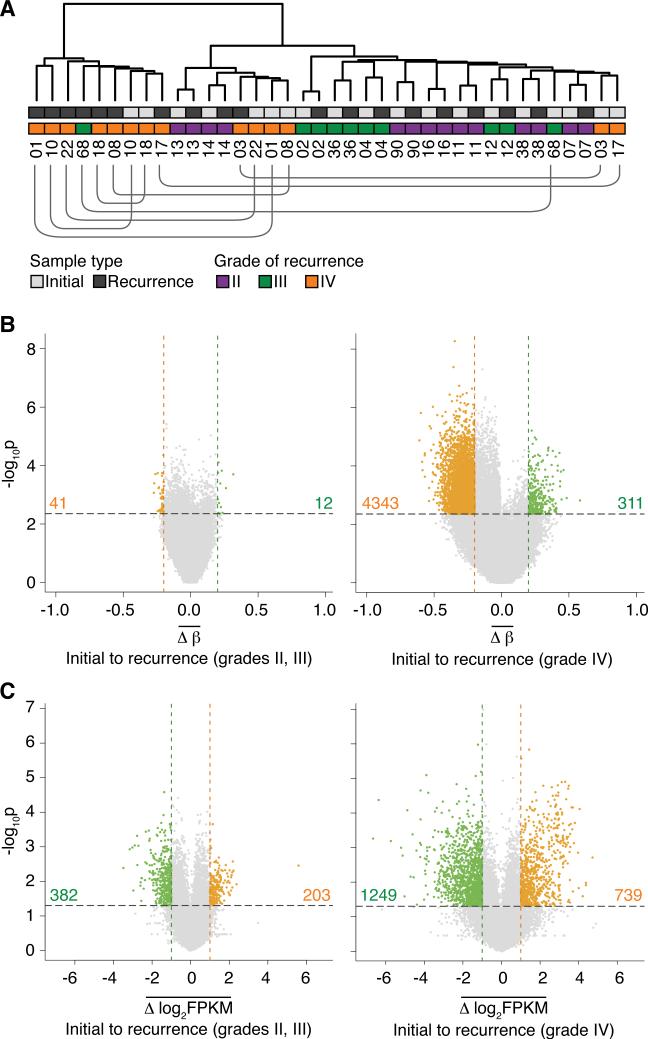
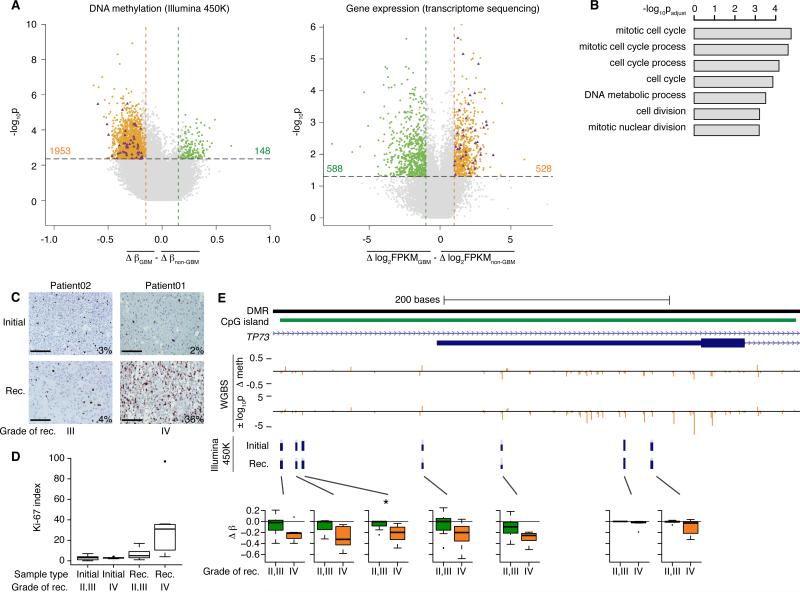
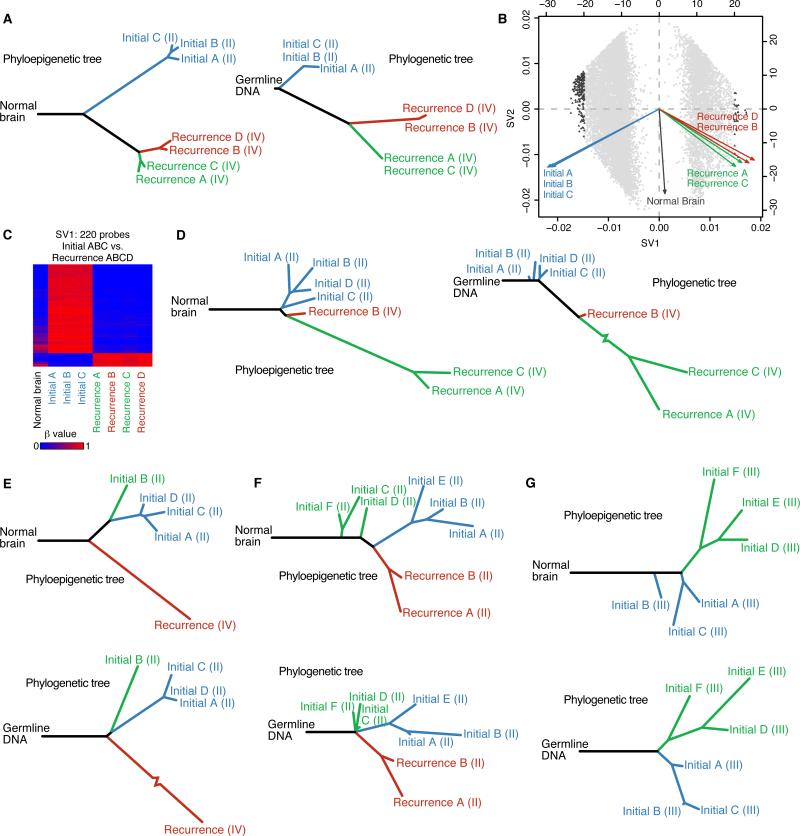
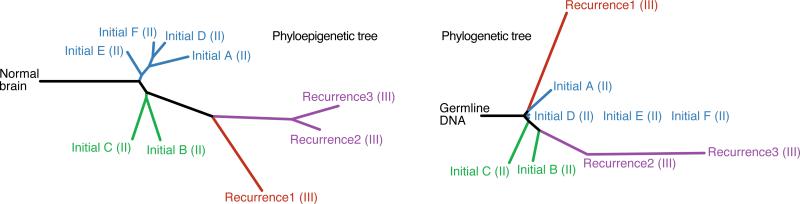
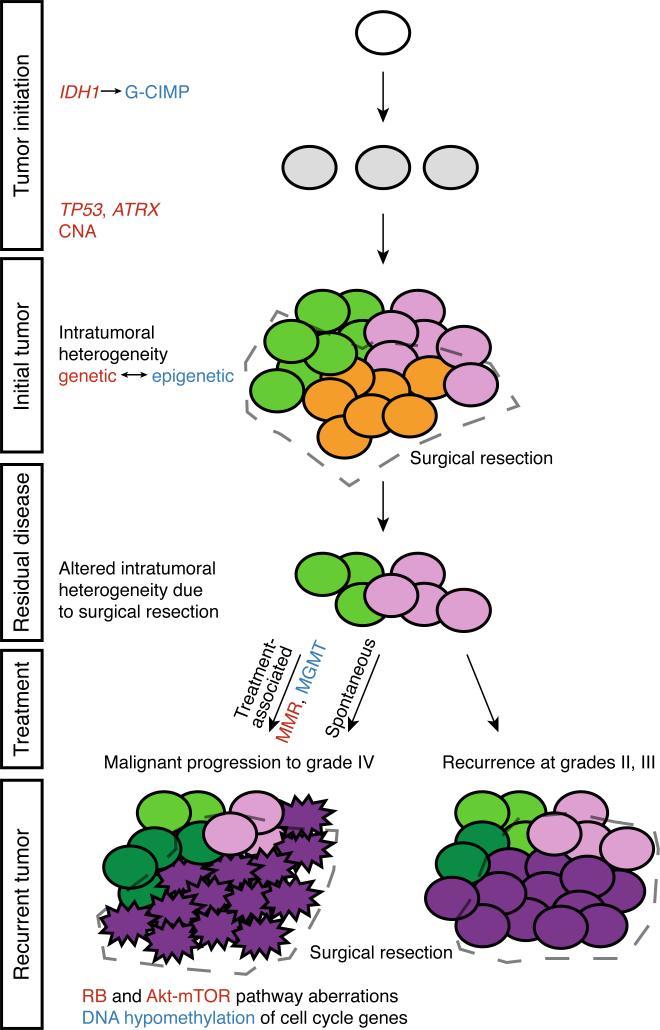
The evolutionary history of tumor cell populations can be reconstructed from patterns of genetic alterations. In contrast to stable genetic events, epigenetic states are reversible and sensitive to the microenvironment, prompting the question whether epigenetic information can similarly be used to discover tumor phylogeny. We examined the spatial and temporal dynamics of DNA methylation in a cohort of low-grade gliomas and their patient-matched recurrences. Genes transcriptionally upregulated through promoter hypomethylation during malignant progression to high-grade glioblastoma were enriched in cell cycle function, evolving in parallel with genetic alterations that deregulate the G1/S cell cycle checkpoint. Moreover, phyloepigenetic relationships robustly recapitulated phylogenetic patterns inferred from somatic mutations. These findings highlight widespread co-dependency of genetic and epigenetic events throughout brain tumor evolution.


Figures

Figure 1
Figure 1. Evolutionary dynamics of the methylome and transcriptome in initial and recurrent glioma pairs
(A) Unsupervised hierarchical clustering of the top 50% most variable CpG sites. Annotations of sample type, grade of recurrence, and patient identification numbers are provided. The lines beneath the patient identification numbers connect initial and recurrent tumors from the same patient that are not adjacent to each other. (B) The average methylation change from initial low-grade tumor to recurrence at each CpG site measured in patients that do not (left) or do (right) undergo malignant progression to GBM (grade IV). Colored dots represent CpG sites that show significant hypomethylation (orange dots, total count provided) or hypermethylation (green dots, total count provided) at recurrence (p valueadjust < 0.05 and |Δβ| > 0.2). (C) Average gene-level expression changes from initial to recurrence in patients that do not (left) or do (right) undergo malignant progression to GBM. Significantly differentially expressed genes are highlighted in green (down-regulated at recurrence, total count provided) and orange (up-regulated at recurrence, total count provided) (p value < 0.05 and |Δlog2FPKM| > 1). See also Figure S1 and Tables S1 and S2.
Figure 2
Figure 2. Cell cycle genes are hypomethylated and over-expressed specifically upon recurrence as GBM, coordinately with an increase in actively cycling cells
(A) Left panel shows a scatter plot of differences between GBM and non-GBM recurrent tumors in methylation changes from initial grade II to recurrent gliomas. Right panel shows an equivalent representation of differences in expression changes between GBM and non-GBM recurrent tumors. Colored points indicate significant differences. Purple triangles highlight genes that become hypomethylated at promoter CpGs (left) and over-expressed (right) during malignant progression to GBM. (B) Barplot of the top results of a gene ontology analysis of genes that are both significantly hypomethylated and over-expressed specifically upon recurrence as GBM. (C) Representative staining for Ki-67 in a patient that recurred at grade III (left) and a patient that recurred at grade IV (right). Bars represent 100 μm. (D) Boxplot representing the Ki-67 labeling index of tumors in the cohort (n=16 patients), subdivided by grade of recurrence (p value = 0.026, two-sided Wilcoxon rank sum test between GBM recurrences and recurrences at grades II or III). The box encompasses data points between the first and third quartiles, with a horizontal line indicating the median value. Whiskers extend to 1.5 × interquartile range, and any data points beyond that range are shown as individual dots. (E) Whole-genome shotgun bisulfite sequencing data (WGBS) of Patient01 across an intragenic CpG island in the TP73 locus. From top to bottom, tracks represent: a differentially methylated region (DMR) reported in primary GBM (Nagarajan et al., 2014); CpG island; TP73 full-length and truncated transcripts; change in methylation level from initial to recurrent tumor by WGBS; statistical significance of the WGBS methylation changes, where positive values indicate hypermethylation at recurrence and negative values indicate hypomethylation; methylation levels from Illumina 450K array in Patient01 at the seven CpG sites assayed on the array. Box plots present the methylation change in all patients in the cohort across the same seven CpG sites. Boxplots are drawn as in panel D. See also Figure S2 and Tables S2, S3 and S4.
Figure 3
Figure 3. The spatial and temporal patterns of tumor evolution observed from DNA methylation dynamics and somatic mutations yield similar evolutionary histories
(A) A phyloepigenetic tree constructed from seven samples from Patient17 (left) and a phylogenetic tree derived from somatic mutations from exome sequencing of the same DNA samples (right) (Spearman's rho = 0.90). Tumor grade is provided in parentheses after each sample name. (B) Singular value decomposition biplot shows the probes involved in separating tumor samples. Each probe used to build the phyloepigenetic tree in (A) is plotted (grey dots). The most highly weighted probes are highlighted (triangles). (C) A heatmap of the beta values at the 220 probes most highly weighted by SV1. (D) A phyloepigenetic tree (left) and a phylogenetic tree (right) were constructed to infer the evolutionary relationships within and between the initial and recurrent tumors of Patient01 (Spearman's rho = 0.83). Tumor grade is provided in parentheses after each sample name. (E-G) Phyloepigenetic (top) and phylogenetic trees (bottom) for Patient 18 (E, Spearman's rho = 0.90), Patient90 (F, Spearman's rho = 0.56) and Patient49 (G, Spearman's rho = 0.64). Tumor grade is provided in parentheses after each sample name. See also Figure S3 and Tables S3, S4, S5 and S6.
Figure 4
Figure 4. Phyloepigenetic trees coupled with phylogenetic trees from a low-grade glioma patient with three recurrences reveal an enhanced understanding of evolutionary relationships
Phyloepigenetic (left) and phylogenetic (right) trees of Patient04 present evolutionary relations across four surgical time points (Spearman's rho = 0.78). Tumor grade is provided in parentheses after each sample name. See also Figure S4 and Tables S3, S5 and S6.
Figure 5
Figure 5. A genomic and epigenomic co-dependency model of clonal evolution
Low-grade gliomas exhibit intratumoral heterogeneity at initial presentation, with subclones that share the initiating genetic (IDH1 followed by TP53 and ATRX and copy number alterations, CNA) and epigenetic (IDH1-associated glioma CpG island methylator phenotype, G-CIMP) alterations, but further develop distinct genetic and epigenetic characteristics. Following surgical resection, the outgrowth from residual disease may be grade II or III, while still continuing to evolve subclones with genetic and co-dependent epigenetic features that are distinct from the initial tumor. In other patients, residual disease may undergo malignant progression to GBM, either spontaneously or as a consequence of treatment-associated mutations, in either case acquiring genetic defects in the RB and Akt-mTOR pathways and promoter hypomethylation and activation of cell cycle genes. Treatment associated progression to GBM is uniquely associated with an increased epigenetic silencing of MGMT (van Thuijl, 2015) and acquisition of genetic defects in mismatch repair genes.

Comment in

  • The Amazing and Deadly Glioma Race.
    Ramaswamy V, Taylor MD. Ramaswamy V, et al. Cancer Cell. 2015 Sep 14;28(3):275-7. doi: 10.1016/j.ccell.2015.08.010. Cancer Cell. 2015. PMID: 26373273

References

    1. Baeza N, Weller M, Yonekawa Y, Kleihues P, Ohgaki H. PTEN methylation and expression in glioblastomas. Acta Neuropathol. 2003;106:479–485. - PubMed
    1. Banine F, Bartlett C, Gunawardena R, Muchardt C, Yaniv M, Knudsen ES, Weissman BE, Sherman LS. SWI/SNF chromatin-remodeling factors induce changes in DNA methylation to promote transcriptional activation. Cancer research. 2005;65:3542–3547. - PubMed
    1. Brocks D, Assenov Y, Minner S, Bogatyrova O, Simon R, Koop C, Oakes C, Zucknick M, Lipka DB, Weischenfeldt J, et al. Intratumor DNA methylation heterogeneity reflects clonal evolution in aggressive prostate cancer. Cell reports. 2014;8:798–806. - PubMed
    1. Cancer Genome Atlas Research Network Comprehensive genomic characterization defines human glioblastoma genes and core pathways. Nature. 2008;455:1061–1068. - PMC - PubMed
    1. Chen HZ, Tsai SY, Leone G. Emerging roles of E2Fs in cancer: an exit from cell cycle control. Nat Rev Cancer. 2009;9:785–797. - PMC - PubMed

Publication types

MeSH terms