Genomic insights into the taxonomic status of the Bacillus cereus group
- PMID: 26373441
- PMCID: PMC4571650
- DOI: 10.1038/srep14082
Genomic insights into the taxonomic status of the Bacillus cereus group
Abstract
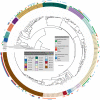
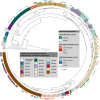
The identification and phylogenetic relationships of bacteria within the Bacillus cereus group are controversial. This study aimed at determining the taxonomic affiliations of these strains using the whole-genome sequence-based Genome BLAST Distance Phylogeny (GBDP) approach. The GBDP analysis clearly separated 224 strains into 30 clusters, representing eleven known, partially merged species and accordingly 19-20 putative novel species. Additionally, 16S rRNA gene analysis, a novel variant of multi-locus sequence analysis (nMLSA) and screening of virulence genes were performed. The 16S rRNA gene sequence was not sufficient to differentiate the bacteria within this group due to its high conservation. The nMLSA results were consistent with GBDP. Moreover, a fast typing method was proposed using the pycA gene, and where necessary, the ccpA gene. The pXO plasmids and cry genes were widely distributed, suggesting little correlation with the phylogenetic positions of the host bacteria. This might explain why classifications based on virulence characteristics proved unsatisfactory in the past. In summary, this is the first large-scale and systematic study of the taxonomic status of the bacteria within the B. cereus group using whole-genome sequences, and is likely to contribute to further insights into their pathogenicity, phylogeny and adaptation to diverse environments.
Figures


Similar articles
-
A rare waterborne outbreak of Bacillus paranthracis in Shandong province, China, 2020: epidemiologic survey, genomic insights, and virulence characteristics.Emerg Microbes Infect. 2024 Dec;13(1):2348498. doi: 10.1080/22221751.2024.2348498. Epub 2024 Jun 3. Emerg Microbes Infect. 2024. PMID: 38686555 Free PMC article.
-
Identification and Analysis of Informative Single Nucleotide Polymorphisms in 16S rRNA Gene Sequences of the Bacillus cereus Group.J Clin Microbiol. 2016 Nov;54(11):2749-2756. doi: 10.1128/JCM.01267-16. Epub 2016 Aug 31. J Clin Microbiol. 2016. PMID: 27582514 Free PMC article.
-
gyrB as a phylogenetic discriminator for members of the Bacillus anthracis-cereus-thuringiensis group.J Microbiol Methods. 2004 Mar;56(3):383-94. doi: 10.1016/j.mimet.2003.11.004. J Microbiol Methods. 2004. PMID: 14967230
-
The Bacillus cereus group: novel aspects of population structure and genome dynamics.J Appl Microbiol. 2006 Sep;101(3):579-93. doi: 10.1111/j.1365-2672.2006.03087.x. J Appl Microbiol. 2006. PMID: 16907808 Review.
-
Genomic metrics made easy: what to do and where to go in the new era of bacterial taxonomy.Crit Rev Microbiol. 2019 Mar;45(2):182-200. doi: 10.1080/1040841X.2019.1569587. Epub 2019 May 31. Crit Rev Microbiol. 2019. PMID: 31148498 Review.
Cited by
-
Bacillus pumilus Group Comparative Genomics: Toward Pangenome Features, Diversity, and Marine Environmental Adaptation.Front Microbiol. 2021 May 7;12:571212. doi: 10.3389/fmicb.2021.571212. eCollection 2021. Front Microbiol. 2021. PMID: 34025591 Free PMC article.
-
Phylogenomic Study of Burkholderia glathei-like Organisms, Proposal of 13 Novel Burkholderia Species and Emended Descriptions of Burkholderia sordidicola, Burkholderia zhejiangensis, and Burkholderia grimmiae.Front Microbiol. 2016 Jun 8;7:877. doi: 10.3389/fmicb.2016.00877. eCollection 2016. Front Microbiol. 2016. PMID: 27375597 Free PMC article.
-
A selected bacterial strain for the self-healing process in cementitious specimens without cell immobilization steps.Bioprocess Biosyst Eng. 2021 Jan;44(1):195-208. doi: 10.1007/s00449-020-02435-0. Epub 2020 Sep 5. Bioprocess Biosyst Eng. 2021. PMID: 32892287
-
Complete Genome Sequences of Nine Bacillus cereus Group Phages.Genome Announc. 2016 Jul 14;4(4):e00473-16. doi: 10.1128/genomeA.00473-16. Genome Announc. 2016. PMID: 27417827 Free PMC article.
-
Antibiotics resistance and toxin profiles of Bacillus cereus-group isolates from fresh vegetables from German retail markets.BMC Microbiol. 2019 Nov 9;19(1):250. doi: 10.1186/s12866-019-1632-2. BMC Microbiol. 2019. PMID: 31706266 Free PMC article.
References
-
- Jimenez G. et al.. Description of Bacillus toyonensis sp. nov., a novel species of the Bacillus cereus group, and pairwise genome comparisons of the species of the group by means of ANI calculations. Syst Appl Microbiol 36, 383–391 (2013). - PubMed
-
- Jung M. Y. et al.. Bacillus manliponensis sp. nov., a new member of the Bacillus cereus group isolated from foreshore tidal flat sediment. J Microbiol 49, 1027–1032 (2011). - PubMed
-
- Liu B. et al.. Bacillus bingmayongensis sp. nov., isolated from the pit soil of Emperor Qin’s Terra-cotta warriors in China. Antonie Van Leeuwenhoek 105, 501–510 (2014). - PubMed
-
- Rasko D. A., Altherr M. R., Han C. S. & Ravel J. Genomics of the Bacillus cereus group of organisms. FEMS Microbiol Rev 29, 303–329 (2005). - PubMed
-
- Baillie L. & Read T. D. Bacillus anthracis, a bug with attitude! Curr Opin Microbiol 4, 78–81 (2001). - PubMed
Publication types
MeSH terms
Substances
LinkOut - more resources
Full Text Sources
Other Literature Sources
Research Materials
Miscellaneous

