. 2015 Sep 16:5:14106.
doi: 10.1038/srep14106.

Donkey genome and insight into the imprinting of fast karyotype evolution

Affiliations

Donkey genome and insight into the imprinting of fast karyotype evolution

Jinlong Huang et al. Sci Rep. .

Erratum in

  • Corrigendum: Donkey genome and insight into the imprinting of fast karyotype evolution.
    Huang J, Zhao Y, Bai D, Shiraigol W, Li B, Yang L, Wu J, Bao W, Ren X, Jin B, Zhao Q, Li A, Bao S, Bao W, Xing Z, An A, Gao Y, Wei R, Bao Y, Bao T, Han H, Bai H, Bao Y, Zhang Y, Daidiikhuu D, Zhao W, Liu S, Ding J, Ye W, Ding F, Sun Z, Shi Y, Zhang Y, Meng H, Dugarjaviin M. Huang J, et al. Sci Rep. 2015 Dec 18;5:17124. doi: 10.1038/srep17124. Sci Rep. 2015. PMID: 26681131 Free PMC article. No abstract available.

Abstract

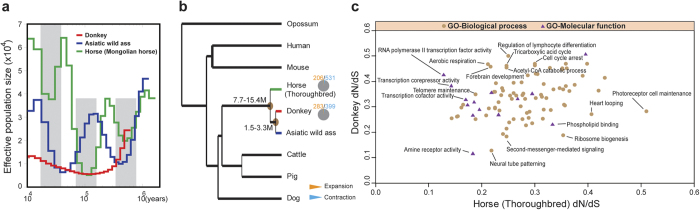
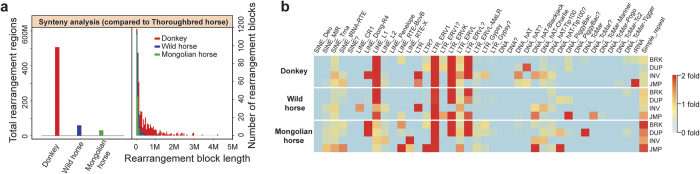
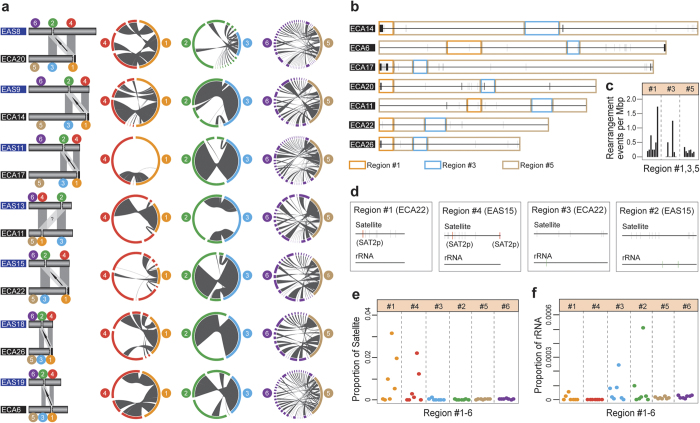
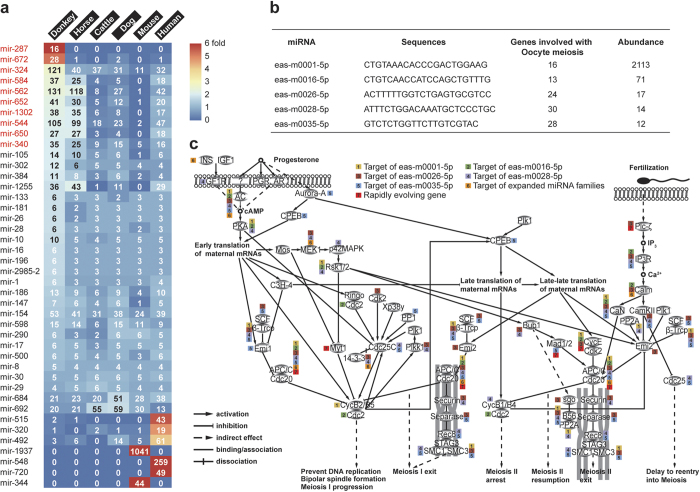
The donkey, like the horse, is a promising model for exploring karyotypic instability. We report the de novo whole-genome assemblies of the donkey and the Asiatic wild ass. Our results reflect the distinct characteristics of donkeys, including more effective energy metabolism and better immunity than horses. The donkey shows a steady demographic trajectory. We detected abundant satellite sequences in some inactive centromere regions but not in neocentromere regions, while ribosomal RNAs frequently emerged in neocentromere regions but not in the obsolete centromere regions. Expanded miRNA families and five newly discovered miRNA target genes involved in meiosis may be associated with fast karyotype evolution. APC/C, controlling sister chromatid segregation, cytokinesis, and the establishment of the G1 cell cycle phase were identified by analysis of miRNA targets and rapidly evolving genes.


Figures

Figure 1
Figure 1. Analysis of evolution genomics.
(a) Reconstructed population demographics of donkey, Asiatic wild ass and horse for the last 1 million years. (b) Phylogenetic tree of nine mammals. The numbers represent the time of divergence. The proportion of expanded and contracted gene families are shown as pie charts at branch termini. (c) Rapidly evolving functions of donkey and horse.
Figure 2
Figure 2. Whole genome synteny analysis.
Comparisons of the donkey, wild horse and Mongolian horse genomes to the Thoroughbred horse genome. (a) The number of rearrangement blocks in donkey, wild horse, Mongolian horse genomes with respect to the Thoroughbred genome. (b) The content of some repetitive sequences significantly increased in rearrangement regions compared with the collinearity region.
Figure 3
Figure 3. Chromosomal rearrangements and characteristic sequences in centromere regions.
(a) Landscape of chromosomal rearrangements. Column 1: Six regions categorized in donkey and horse chromosomes. They are: #1(orange): Centromere regions in the horse chromosome; #2(green): Centromere regions in the donkey chromosome (at least 6 centromeres are neocentromeres); #3(blue): Homologous regions in the horse chromosome related to region #2; #4(red): Homologous regions in the donkey chromosome related to region #1; #5(brown): Other regions in the horse chromosome; #6(purple): Other regions in the donkey chromosome. (EAS: Equus asinus; ECA:Equus caballus). The arrow indicates the direction of two corresponding centromere repositionings. The question mark (‘?’) indicates the direction of two corresponding centromere repositionings that are not classified. Column 2: Synteny analysis between region #4 and region #1. Column 3: Synteny analysis between region #2 and region #3. Column 4: Synteny analysis between region #6 and region #5. (b) Chromosomal rearrangements between donkey and Thoroughbred horse. Black vertical lines represent rearrangement regions in the Thoroughbred horse chromosomes. (c) Numbers of rearrangements events in seven pairs of chromosomes. (d) Distribution of satellite sequences and ribosomal RNA in region #1, #3 of ECA22 and region #2, #4 of EAS15. (e) Proportion of satellite sequences in regions #1–6. (f) Proportion of ribosomal RNA in regions #1–6.
Figure 4
Figure 4. Novel miRNAs, expanded miRNA families and rapidly evolving genes in donkey, which are associated with the meiosis pathway.
(a) Expanded miRNA families (red) in the donkey genome. (b) Five novel miRNAs targeting meiosis in the donkey genome identified by RNA-seq. (c) The donkey meiosis pathway. Small boxes indicate that the gene is regulated by novel miRNAs, expanded miRNA families or rapidly evolving genes.

References

    1. Rossel S. et al. Domestication of the donkey: timing, processes, and indicators. Proc. Natl. Acad. Sci. USA 105, 3715–3720 (2008). - PMC - PubMed
    1. Beja-Pereira A. et al. African origins of the domestic donkey. Science 304, 1781 (2004). - PubMed
    1. Hintz H. F. & Cymbaluk N. F. Nutrition of the horse. Annu. Rev. Nutr. 14, 243–267 (1994). - PubMed
    1. Izraely H., Choshniak I., Stevens C. E., Demment M. W. & Shkolnik A. Factors determining the digestive efficiency of the domesticated donkey (Equus asinus asinus). Q. J. Exp. Physiol. 74, 1–6 (1989). - PubMed
    1. Trifonov V. A. et al. Multidirectional cross-species painting illuminates the history of karyotypic evolution in Perissodactyla. Chromosome Res. 16, 89–107 (2008). - PubMed

Publication types

LinkOut - more resources