. 2015 Sep 14;143(10):104201.
doi: 10.1063/1.4929991.

Counting tagged molecules one by one: Quantitative photoactivation and bleaching of photoactivatable fluorophores

Affiliations

Counting tagged molecules one by one: Quantitative photoactivation and bleaching of photoactivatable fluorophores

Huong T Kratochvil et al. J Chem Phys. .

Abstract

Determining the number of molecules in a given assembly, such as the number of proteins in a toxic aggregate, is often critical to understanding chemistry and function. Herein, we report a variation of a limitless method for counting photoactivatable fluorescent dyes in which single dye molecules are photoswitched to a fluorescent state, counted, and then irreversibly photobleached. We use this method to count the number of CAGE 552 covalently bound to the surface of 500 nm polystyrene beads. Activation of CAGE 552 was achieved with a 405 nm laser pulse. Once activated, the dye was excited with 532 nm light, and the fluorescence emission was collected with a CCD camera. The results from the fluorescence experiments were then compared to bulk fluorescence measurements to assess the error in counting. There are other ways of counting molecules, such as photobleaching and statistical analysis of reversible switchable chromophores. The method reported here provides a lower bound to the number of chromophores, with no upper limit to the number of molecules that can be quantified.


Figures

FIG. 1.
FIG. 1.
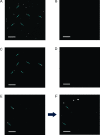
Photoactivation and detection cycle. The 405 nm and 532 nm diode lasers were not on simultaneously. In the fluorescence images, by comparing the images in the first column (before activation) and those in the second column (after activation), we can avoid overcounting fluorophores with long-lived fluorescence lifetimes.
FIG. 2.
FIG. 2.
Transmitted white light and fluorescence images of dye-labeled beads. (a) Transmitted light image of the beads on an imaging is (b) fluorescence image on the same area before an activation pulse was given. Almost no fluorescent spots were detected. (c) Fluorescence image on the same area after the activation. The arrows indicate the positions of the beads that have activated dyes on their surface. (d) Fluorescence image taken 10 s after the activation pulse arrived. All the activated fluorophores were photobleached and are now dark. Fluorescence images (e) before and (f) after an activation pulse are compared. Following the photobleaching of the fluorophores, another activation pulse illuminates the sample, creating three newly activated chromophores. In the next iteration of the photoactivation and detection cycle, the fluorophores that did not bleach out (shown with arrows) are not counted. Scale bars are at 5 μm.
FIG. 3.
FIG. 3.
Fluorescence lifetime of CAGE 552. Fluorescence of CAGE 552 with 532 nm excitation was measured at every 500 ms after activation (black square). The solid line is a fit by a single exponential with a time constant of 1.71 ± 0.07 s.
FIG. 4.
FIG. 4.
3-D histogram of the counts on the beads (for 40:1 dye to bead sample) above the transmitted light image of the beads. The height of the bars corresponds to the counts on the positions.
FIG. 5.
FIG. 5.
Distribution of the counts from each sample was fitted with a Poisson distribution. The means of the counts in 10:1 (a), 20:1 (b), 30:1 (c), and 40:1 (d) dye to bead ratio samples were 3.4 ± 2.2, 5.7 ± 1.5, 8.4 ± 3.7, and 13.6 ± 4.2, respectively.
FIG. 6.
FIG. 6.
Counting efficiency changes upon setting different thresholds. When the threshold level dropped from 25 to 20, the counts increased more rapidly than when it dropped from 30 to 25, which implies that to set a threshold level at 20 would be less accurate because the background counts are no longer non-zero.
FIG. 7.
FIG. 7.
Average number of dye molecules determined by different methods. The blue squares show the number of fluorophores for a given sample obtained using ensemble fluorescence measurements while the red circles are the number of fluorophores counted using single-molecule counting. The numbers from the fluorescence intensity measurement are more than two times larger than the numbers from the single-molecule counting.
FIG. 8.
FIG. 8.
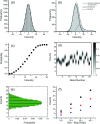
Analysis of counting data without using a threshold. (a) Distribution of dark counts measured with the shutter off from the 40:1 dye to bead sample. (b) Distribution of detected fluorescence intensities on each bead can be separated into that of background intensities and that of activated single molecule fluorescence intensities. (c) Each of the single molecule fluorescence intensities detected in each measurement on each bead can be converted to the probability that there is an activation of a dye molecule. (d) Using the intensity probability distribution, the probability distributions of having a certain number of dyes on each bead were calculated. (e) Overall probability distribution is acquired from averaging the probability distributions. (f) The counts obtained using the thresholding method (blue circles) to the intensity profile analysis (red triangles) are compared to the ensemble measurement (black squares). The threshold method severely undercounts the number of dyes, while the counts from the intensity ratio analysis are considerably closer to the control experiment.

Similar articles

Cited by

References

    1. Garner M. M. and Revzin A., Nucleic Acids Res. 9(13), 3047–3060 (1981).10.1093/nar/9.13.3047 - DOI - PMC - PubMed
    1. Lai V. C., Guan R., Wood M. L., Lo S. K., Yuen M. F., and Lai C. L., J. Clin. Microbiol. 37(1), 161–164 (1999). - PMC - PubMed
    1. Oda Y., Huang K., Cross F. R., Cowburn D., and Chait B. T., Proc. Natl. Acad. Sci. U. S. A. 96(12), 6591–6596 (1999).10.1073/pnas.96.12.6591 - DOI - PMC - PubMed
    1. Simonson P. D., Deberg H. A., Ge P., Alexander J. K., Jeyifous O., Green W. N., and Selvin P. R., Biophys. J. 99(10), L81–L83 (2010).10.1016/j.bpj.2010.08.076 - DOI - PMC - PubMed
    1. Ulbrich M. H. and Isacoff E. Y., Nat. Methods 4(4), 319–321 (2007).10.1038/nmeth1024 - DOI - PMC - PubMed

Publication types

LinkOut - more resources