. 2015 Sep 16:6:8323.
doi: 10.1038/ncomms9323.

Ligand-dependent genomic function of glucocorticoid receptor in triple-negative breast cancer

Affiliations

Ligand-dependent genomic function of glucocorticoid receptor in triple-negative breast cancer

Zhong Chen et al. Nat Commun. .

Abstract

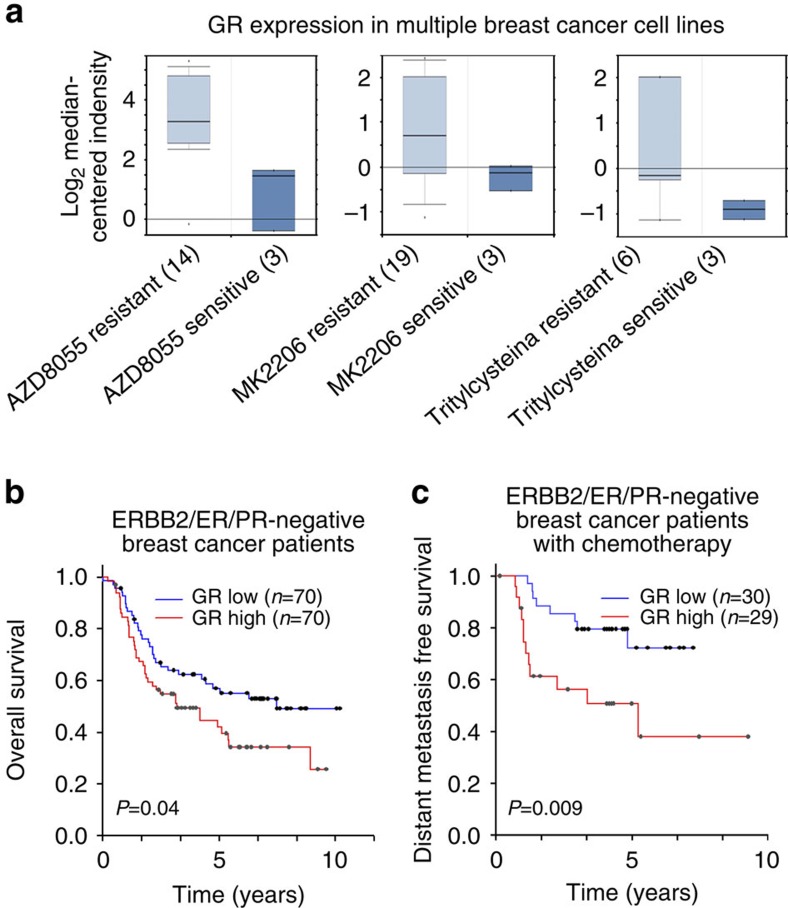
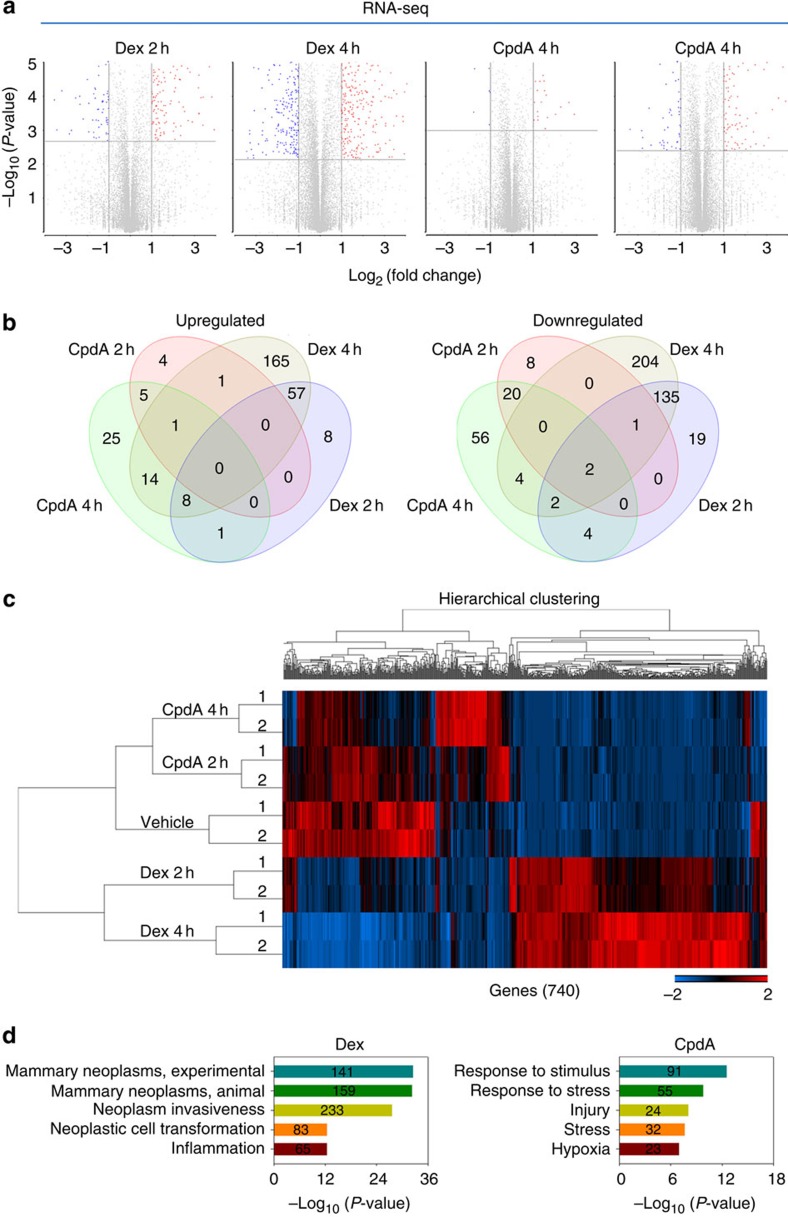
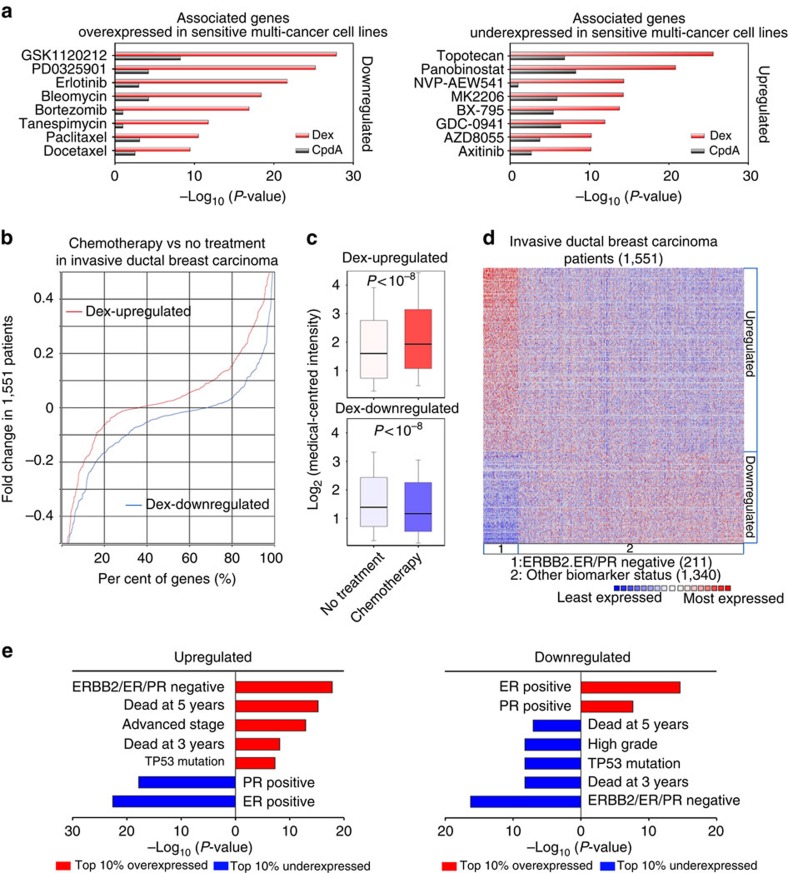
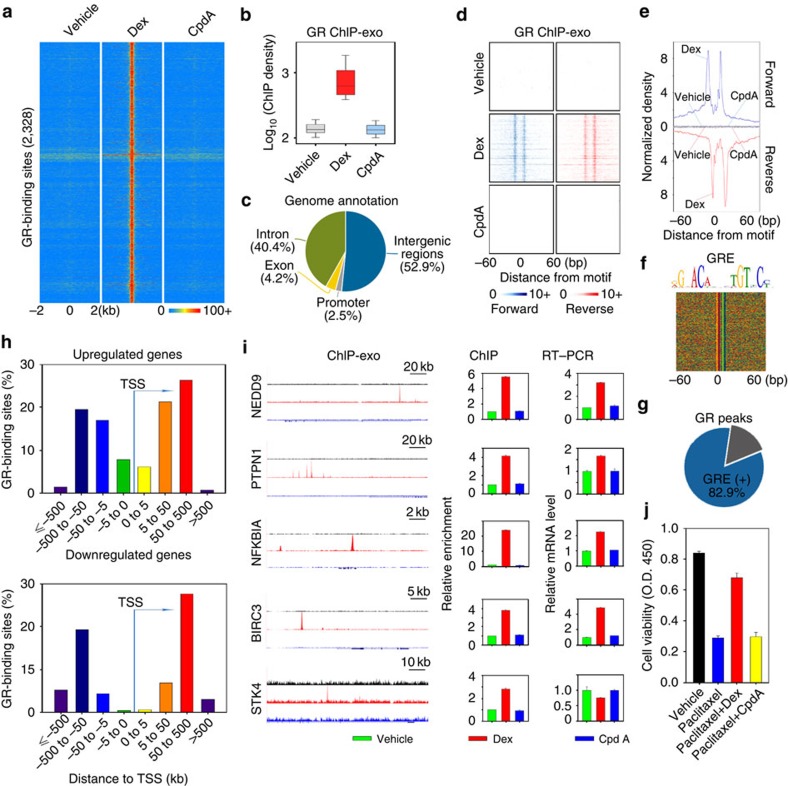
Glucocorticoids (GCs) have been widely used as coadjuvants in the treatment of solid tumours, but GC treatment may be associated with poor pharmacotherapeutic response or prognosis. The genomic action of GC in these tumours is largely unknown. Here we find that dexamethasone (Dex, a synthetic GC)-regulated genes in triple-negative breast cancer (TNBC) cells are associated with drug resistance. Importantly, these GC-regulated genes are aberrantly expressed in TNBC patients and are associated with unfavourable clinical outcomes. Interestingly, in TNBC cells, Compound A (CpdA, a selective GR modulator) only regulates a small number of genes not involved in carcinogenesis and therapy resistance. Mechanistic studies using a ChIP-exo approach reveal that Dex- but not CpdA-liganded glucocorticoid receptor (GR) binds to a single glucocorticoid response element (GRE), which drives the expression of pro-tumorigenic genes. Our data suggest that development of safe coadjuvant therapy should consider the distinct genomic function between Dex- and CpdA-liganded GR.


Figures

Figure 1
Figure 1. Correlation of GR expression with pharmacotherapy resistance of breast cancer cells and clinical outcomes of breast cancer patients.
(a) Correlation of GR expression with resistance to the mammalian target of rapamycin inhibitor AZD8055, AKT inhibitor MK2206 and mitotic kinesin Eg5 inhibitor S-trityl-L-cysteine in multiple breast cancer cell lines. The numbers in the brackets indicate the numbers of different breast cancer cell lines. The gene expression data are from a previous study. (b) Kaplan–Meier analysis comparing overall survival of a cohort of TNBC patients distinguished by low versus high expression of the GR gene. The clinical gene expression data are from a previous study. (c) Kaplan–Meier curves comparing distant metastasis-free survival of another cohort of TNBC patients undergoing chemotherapy distinguished by low versus high expression of the GR gene. The clinical gene expression data are from a previous study.
Figure 2
Figure 2. Analysis of Dex- and CpdA-stimulated transcriptomes in MDA-MB-231 cells.
(a) Volcano plots of pairwise gene expression changes in response to 100 nM Dex for 2 and 4 h, or 10 μM CpdA for 2 and 4 h. Significant differentially expressed genes (fold>2) are highlighted in colour (red for upregulated genes and blue for downregulated genes) with FDR<0.05 (horizontal line). (b) Venn diagrams show upregulated (left panel) and downregulated (right panel) genes regulated by 2 and 4 h Dex or CpdA treatment. (c) A heatmap of differentially expressed genes after CpdA or Dex treatment at indicated time points. Genes varied across all samples after treatment with FDR<0.05 were used in hierarchical clustering. The gene expression (reads pe kilobase per million mapped reads (RPKM)) values for each gene were normalized to the standard normal distribution to generate Z-scores. The scale bar is shown with the minimum expression value for each gene in blue and the maximum value in red. (d) Enriched Gene Ontology (GO) terms in Dex- and CpdA-regulated genes.
Figure 3
Figure 3. Functional and clinical association analysis of Dex- and CpdA-regulated genes.
(a) Correlation of Dex- and CpdA-regulated genes with genes differentially expressed between drug-sensitive and -resistant multiple cancer cell lines. (b) Cumulative distribution of ratios of gene expression change in patients receiving chemotherapy (359 patients) relative to those not receiving chemotherapy (202 patients) were plotted using Dex-upregulated genes and Dex-downregulated genes in MDA-MB-231 cells. (c) Box plots show changes in expression of Dex-upregulated genes (upper panel) and Dex-downregulated genes (lower panel) in patients receiving chemotherapy versus those not receiving chemotherapy. (d) Genes upregulated and downregulated by both Dex treatment in TNBC cells and chemotherapy in patients are overexpressed and underexpressed, respectively, in invasive ductal TNBC (211 patients) but not in other breast cancer subtypes (1,340 patients). (e) Clinical association analysis was performed using upregulated and downregulated genes from d and the top 10% over/underexpressed genes in invasive ductal breast carcinoma patients.
Figure 4
Figure 4. Precise definition and characterization of the GRE recognized by Dex-liganded GR in MDA-MB-231 cells.
(a) Heat maps show the signal intensity of GR binding in MDA-MB-231 cells treated with vehicle, 100 nM Dex or 10 μM CpdA for 1 h. The number (2,328) indicates Dex-responsive GR locations. (b) A box plot shows ChIP-exo signal densities in Dex-responsive GR locations in cells treated with vehicle, Dex or CpdA. (c) Classification of specific Dex-responsive GR-binding locations based on annotation. (d) Raw tags distribution and (e) aggregated tag density over Dex GRE under different treatment conditions is shown on the forward (blue) and reverse (red) strands, separately. (f) Dex GRE is shown and the sequences are presented in the same order as in d. (g) Percentage of Dex-responsive GR-binding locations containing Dex GRE. (h) The distribution of Dex GR binding around the transcription start site (TSS) of upregulated (upper panel) and downregulated (lower panel) GR target genes are shown. (i) Left panel: UCSC genome browser views of ChIP-exo sequencing data at five gene loci. Y-scale is the same for each gene locus. Colours represent different treatment conditions: vehicle (green), red (Dex) and blue (CpdA). Middle panel: ChIP validation of GR ChIP-exo data. Cells were treated with vehicle, 100 nM Dex or 10 μM CpdA for 1 h and GR ChIP was performed. For the PTPN1 locus, ChIP was performed to validate the binding of GR to the highest binding peak. Right panel: messenger RNA levels of five genes were also examined by reverse transcriptase–PCR (RT–PCR) assays. ChIP and RT–PCR data are the mean of triplicates±s.d. (j) Cells were treated with vehicle, 100 nM paclitaxel, 100 nM paclitaxel/100 nM Dex or 100 nM paclitaxel/10 μM CpdA and cell proliferation was determined on day 4 using the WST-1 assay. The data are the mean of triplicates±s.d.

Similar articles

Cited by

References

    1. Oakley R. H. & Cidlowski J. A. The biology of the glucocorticoid receptor: new signaling mechanisms in health and disease. J. Allergy Clin. Immunol. 132, 1033–1044 (2013). - PMC - PubMed
    1. Schmidt S. et al.. Glucocorticoid-induced apoptosis and glucocorticoid resistance: molecular mechanisms and clinical relevance. Cell Death and Differ. 11, (Suppl 1): S45–S55 (2004). - PubMed
    1. Rutz H. P. Effects of corticosteroid use on treatment of solid tumours. Lancet 360, 1969–1970 (2002). - PubMed
    1. Zhang C. et al.. Clinical and mechanistic aspects of glucocorticoid-induced chemotherapy resistance in the majority of solid tumors. Cancer Biol. Ther. 6, 278–287 (2007). - PubMed
    1. Pan D., Kocherginsky M. & Conzen S. D. Activation of the glucocorticoid receptor is associated with poor prognosis in estrogen receptor-negative breast cancer. Cancer Res. 71, 6360–6370 (2011). - PMC - PubMed

Publication types

MeSH terms

Associated data