

Real-time prediction of mortality, readmission, and length of stay using electronic health record data
- PMID: 26374704
- PMCID: PMC7839923
- DOI: 10.1093/jamia/ocv110
Real-time prediction of mortality, readmission, and length of stay using electronic health record data
Abstract
Objective: To develop a predictive model for real-time predictions of length of stay, mortality, and readmission for hospitalized patients using electronic health records (EHRs).
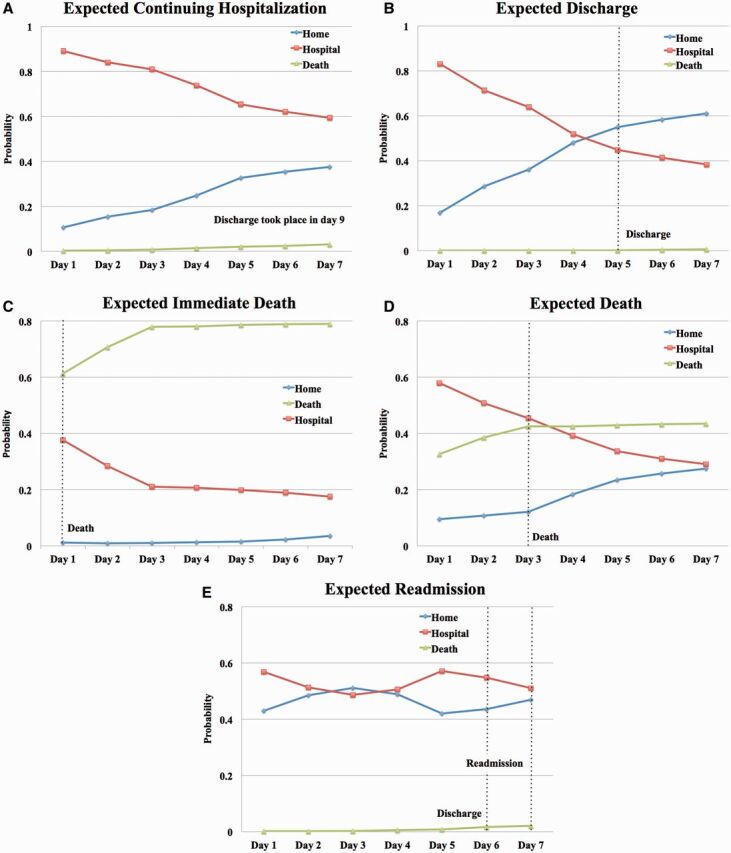
Materials and methods: A Bayesian Network model was built to estimate the probability of a hospitalized patient being "at home," in the hospital, or dead for each of the next 7 days. The network utilizes patient-specific administrative and laboratory data and is updated each time a new pathology test result becomes available. Electronic health records from 32 634 patients admitted to a Sydney metropolitan hospital via the emergency department from July 2008 through December 2011 were used. The model was tested on 2011 data and trained on the data of earlier years.
Results: The model achieved an average daily accuracy of 80% and area under the receiving operating characteristic curve (AUROC) of 0.82. The model's predictive ability was highest within 24 hours from prediction (AUROC = 0.83) and decreased slightly with time. Death was the most predictable outcome with a daily average accuracy of 93% and AUROC of 0.84.
Discussion: We developed the first non-disease-specific model that simultaneously predicts remaining days of hospitalization, death, and readmission as part of the same outcome. By providing a future daily probability for each outcome class, we enable the visualization of future patient trajectories. Among these, it is possible to identify trajectories indicating expected discharge, expected continuing hospitalization, expected death, and possible readmission.
Conclusions: Bayesian Networks can model EHRs to provide real-time forecasts for patient outcomes, which provide richer information than traditional independent point predictions of length of stay, death, or readmission, and can thus better support decision making.
Keywords: length of stay; mortality; patient outcome; prediction; readmission.
© The Author 2015. Published by Oxford University Press on behalf of the American Medical Informatics Association. All rights reserved. For Permissions, please email: journals.permissions@oup.com.
Figures


References
-
- Kenward G Castle N Hodgetts T et al. . Evaluation of a medical emergency team one year after implementation. Resuscitation 2004;61(3):257–263. - PubMed
-
- Bauer M Fitzgerald L Haesler E et al. . Hospital discharge planning for frail older people and their family. Are we delivering best practice? A review of the evidence. J Clin Nurs 2009;18(18):2539–2546. - PubMed
Publication types
MeSH terms
LinkOut - more resources
Full Text Sources
Other Literature Sources
