

Estimating Contraceptive Prevalence Using Logistics Data for Short-Acting Methods: Analysis Across 30 Countries
- PMID: 26374805
- PMCID: PMC4570018
- DOI: 10.9745/GHSP-D-15-00116
Estimating Contraceptive Prevalence Using Logistics Data for Short-Acting Methods: Analysis Across 30 Countries
Abstract
Background: Contraceptive prevalence rate (CPR) is a vital indicator used by country governments, international donors, and other stakeholders for measuring progress in family planning programs against country targets and global initiatives as well as for estimating health outcomes. Because of the need for more frequent CPR estimates than population-based surveys currently provide, alternative approaches for estimating CPRs are being explored, including using contraceptive logistics data.
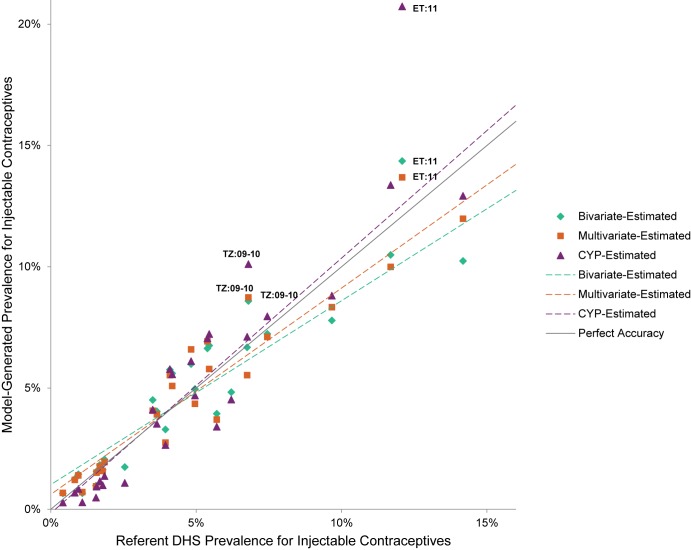
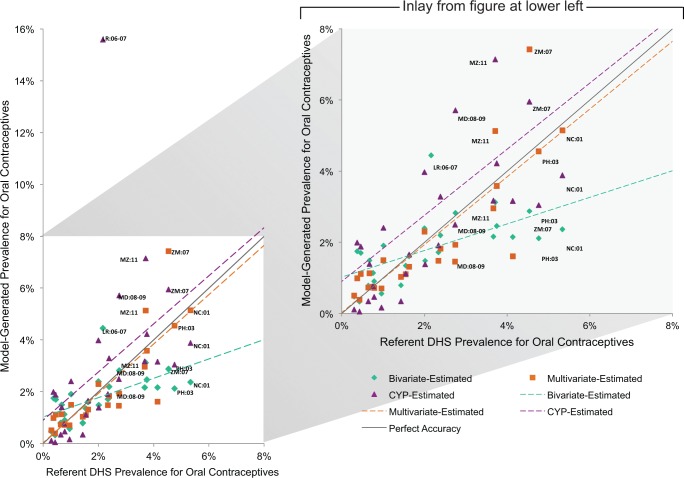
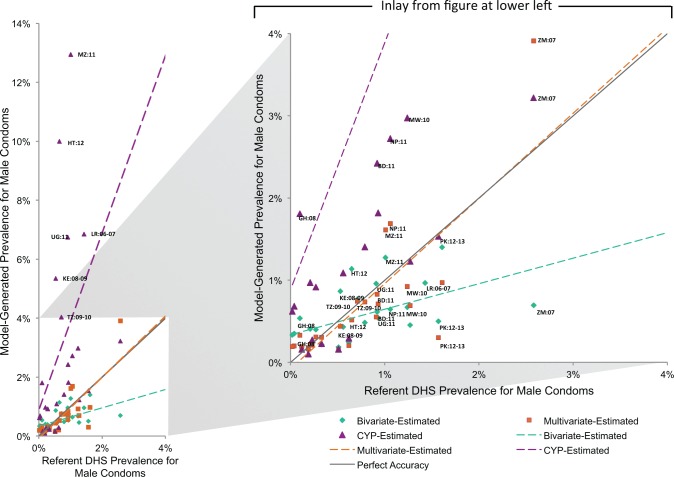
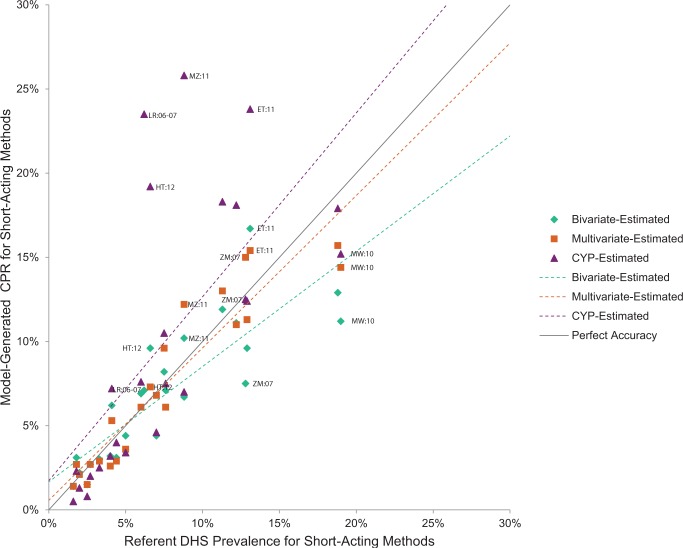
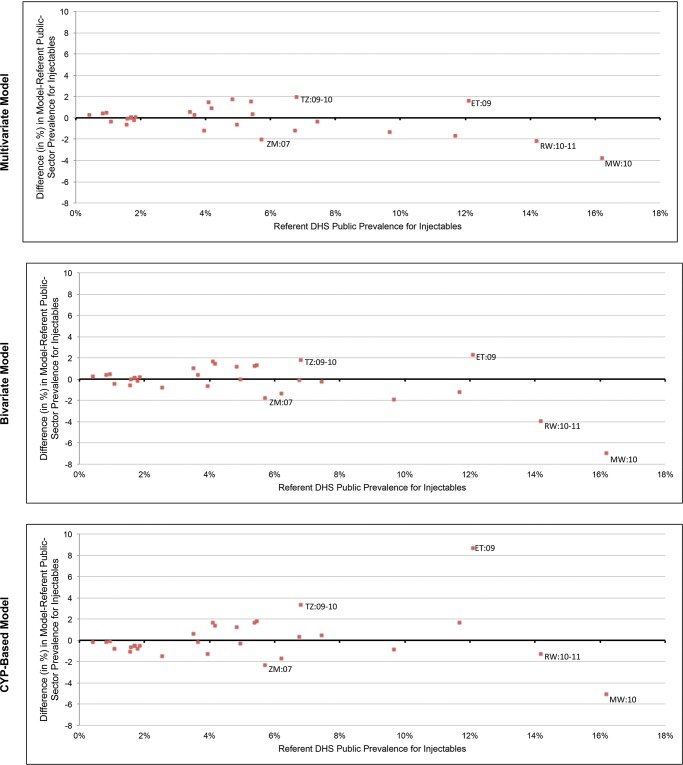
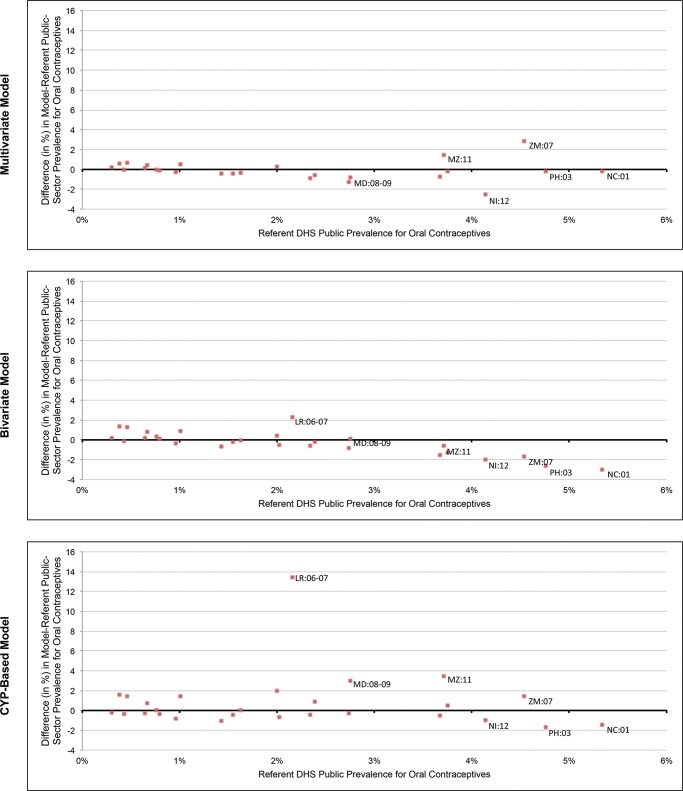
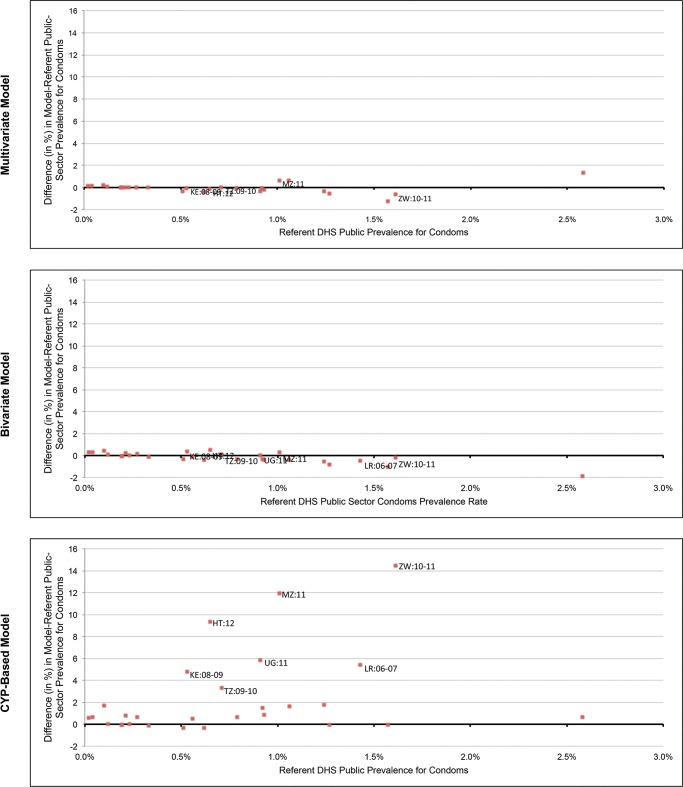
Methods: Using data from the Demographic and Health Surveys (DHS) in 30 countries, population data from the United States Census Bureau International Database, and logistics data from the Procurement Planning and Monitoring Report (PPMR) and the Pipeline Monitoring and Procurement Planning System (PipeLine), we developed and evaluated 3 models to generate country-level, public-sector contraceptive prevalence estimates for injectable contraceptives, oral contraceptives, and male condoms. Models included: direct estimation through existing couple-years of protection (CYP) conversion factors, bivariate linear regression, and multivariate linear regression. Model evaluation consisted of comparing the referent DHS prevalence rates for each short-acting method with the model-generated prevalence rate using multiple metrics, including mean absolute error and proportion of countries where the modeled prevalence rate for each method was within 1, 2, or 5 percentage points of the DHS referent value.
Results: For the methods studied, family planning use estimates from public-sector logistics data were correlated with those from the DHS, validating the quality and accuracy of current public-sector logistics data. Logistics data for oral and injectable contraceptives were significantly associated (P<.05) with the referent DHS values for both bivariate and multivariate models. For condoms, however, that association was only significant for the bivariate model. With the exception of the CYP-based model for condoms, models were able to estimate public-sector prevalence rates for each short-acting method to within 2 percentage points in at least 85% of countries.
Conclusions: Public-sector contraceptive logistics data are strongly correlated with public-sector prevalence rates for short-acting methods, demonstrating the quality of current logistics data and their ability to provide relatively accurate prevalence estimates. The models provide a starting point for generating interim estimates of contraceptive use when timely survey data are unavailable. All models except the condoms CYP model performed well; the regression models were most accurate but the CYP model offers the simplest calculation method. Future work extending the research to other modern methods, relating subnational logistics data with prevalence rates, and tracking that relationship over time is needed.
© Cunningham et al.
Figures
Similar articles
-
Contraceptive use in Latin America and the Caribbean with a focus on long-acting reversible contraceptives: prevalence and inequalities in 23 countries.Lancet Glob Health. 2019 Feb;7(2):e227-e235. doi: 10.1016/S2214-109X(18)30481-9. Lancet Glob Health. 2019. PMID: 30683240 Free PMC article.
-
Modern contraceptive use, unmet need, and demand satisfied among women of reproductive age who are married or in a union in the focus countries of the Family Planning 2020 initiative: a systematic analysis using the Family Planning Estimation Tool.Lancet. 2018 Mar 3;391(10123):870-882. doi: 10.1016/S0140-6736(17)33104-5. Epub 2017 Dec 5. Lancet. 2018. PMID: 29217374 Free PMC article.
-
Multinomial multilevel analysis of factors affecting the use of modern contraceptives in sub-Saharan Africa: evidence from 2015 to 2023 Demographic Health Survey.Sci Rep. 2025 May 14;15(1):16751. doi: 10.1038/s41598-025-01622-x. Sci Rep. 2025. PMID: 40369185 Free PMC article.
-
Contraceptive delivery in the developing world.Br Med Bull. 1993 Jan;49(1):27-39. doi: 10.1093/oxfordjournals.bmb.a072604. Br Med Bull. 1993. PMID: 8324614 Review.
-
Adolescent fertility and family planning in East Asia and the Pacific: a review of DHS reports.Reprod Health. 2011 May 5;8:11. doi: 10.1186/1742-4755-8-11. Reprod Health. 2011. PMID: 21545708 Free PMC article. Review.
Cited by
-
Are Procured Quantities of Implants Adequate and Appropriate? Modeling Procurement, Inventory, and Consumption of Contraceptive Implants During Rapid Uptake.Glob Health Sci Pract. 2019 Jun 27;7(2):240-257. doi: 10.9745/GHSP-D-19-00017. Print 2019 Jun. Glob Health Sci Pract. 2019. PMID: 31249021 Free PMC article.
-
Evaluating the effectiveness of enhanced family planning education on knowledge and use of family planning in fishing communities of Lake Victoria in Uganda: a randomized controlled trial.BMC Health Serv Res. 2022 Apr 14;22(1):506. doi: 10.1186/s12913-022-07898-3. BMC Health Serv Res. 2022. PMID: 35421987 Free PMC article. Clinical Trial.
References
-
- Requejo J, Bryce J, Victora C. Building a future for women and children: the 2012 report. Geneva: World Health Organization; 2012. Co-published by UNICEF Available from: http://www.countdown2015mnch.org/documents/2012Report/2012-complete-no-p...
Publication types
MeSH terms
Substances
LinkOut - more resources
Full Text Sources
Medical