. 2015 Sep 16:4:e07000.
doi: 10.7554/eLife.07000.

Norepinephrine is required to promote wakefulness and for hypocretin-induced arousal in zebrafish

Affiliations

Norepinephrine is required to promote wakefulness and for hypocretin-induced arousal in zebrafish

Chanpreet Singh et al. Elife. .

Abstract

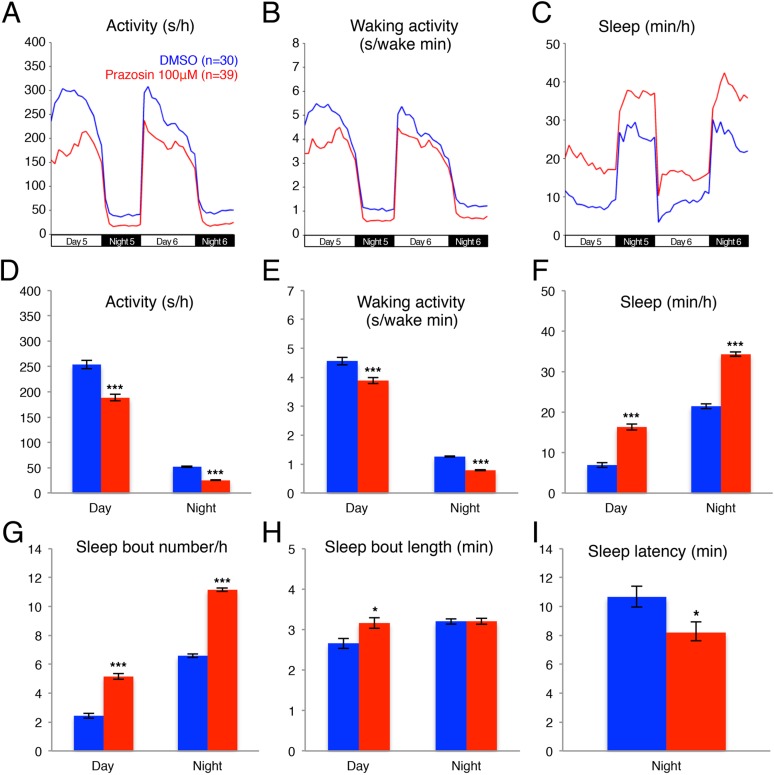
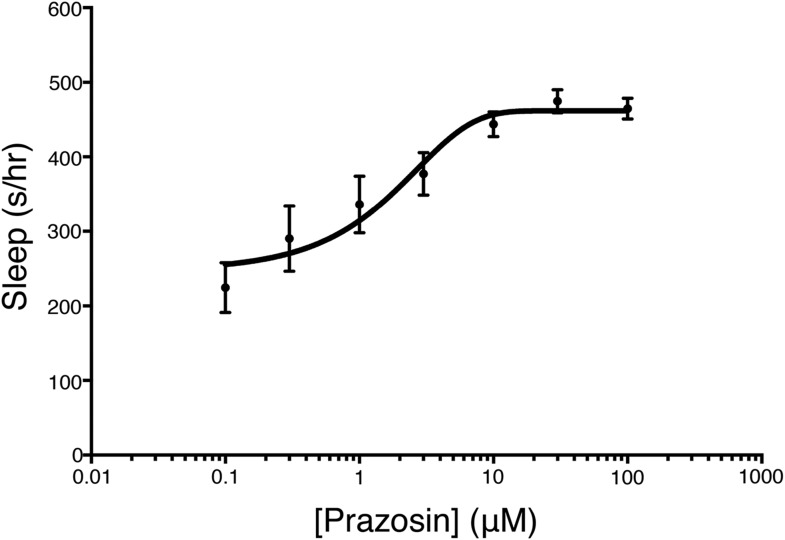
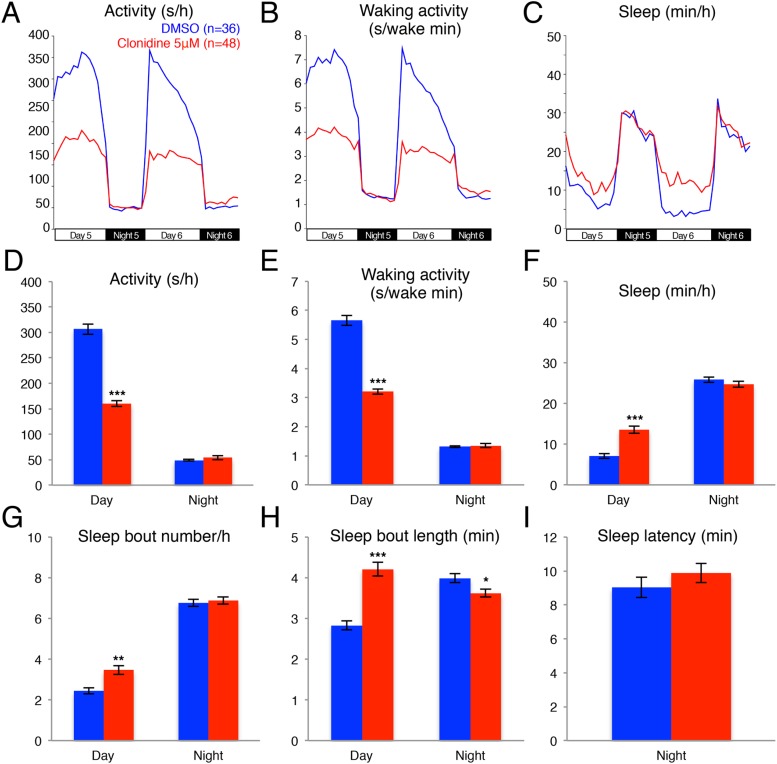
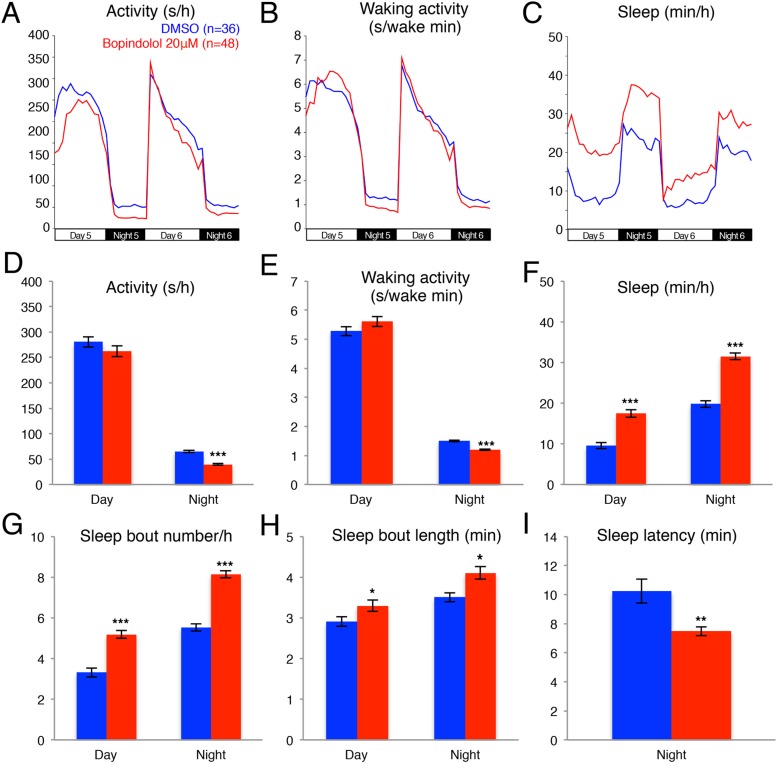
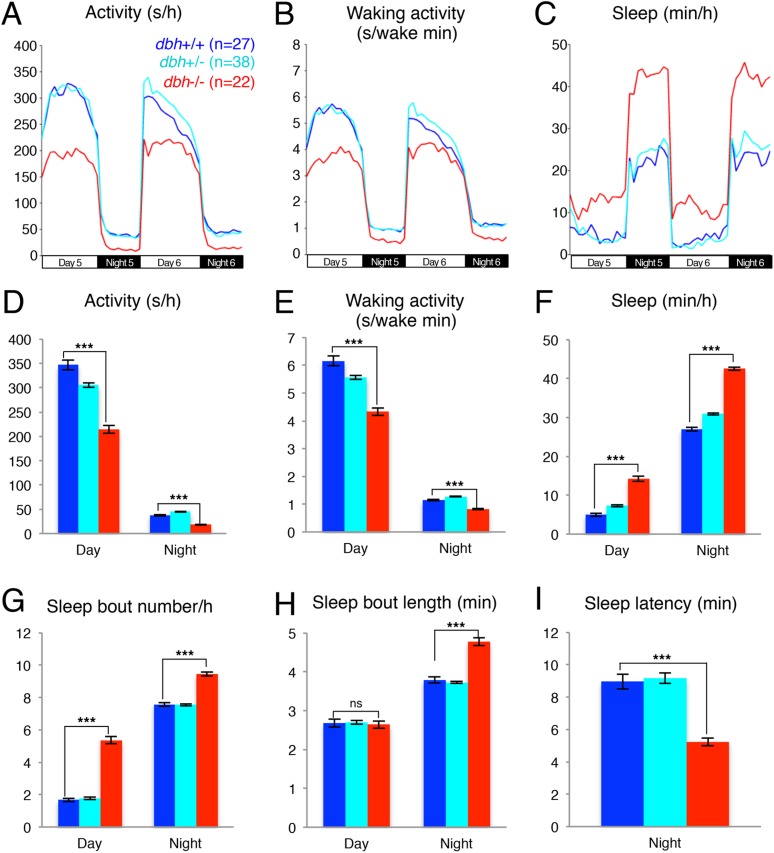
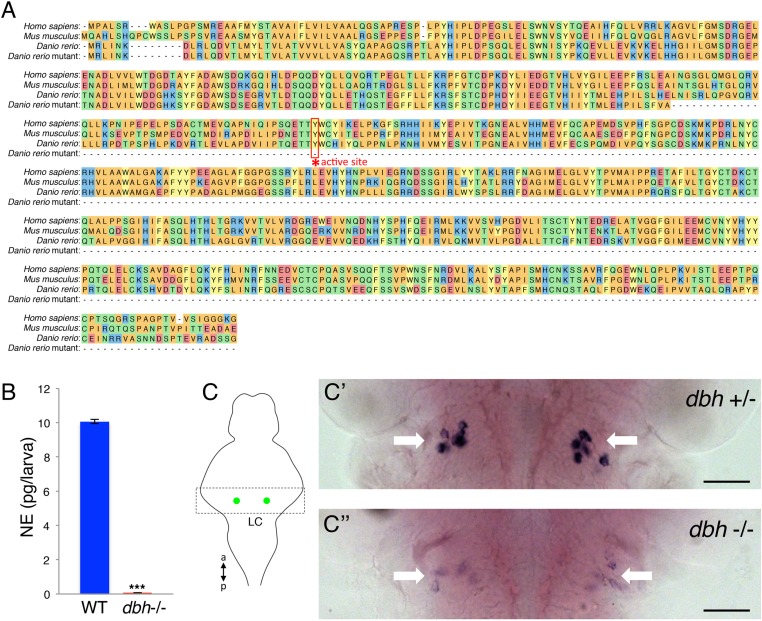
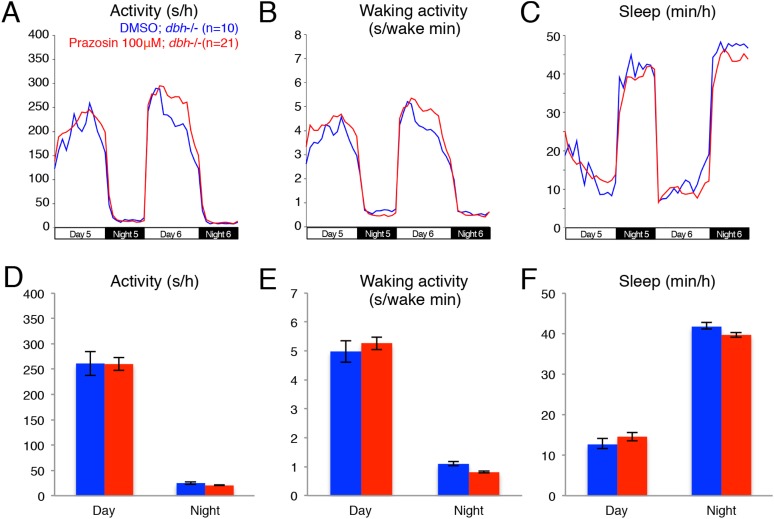
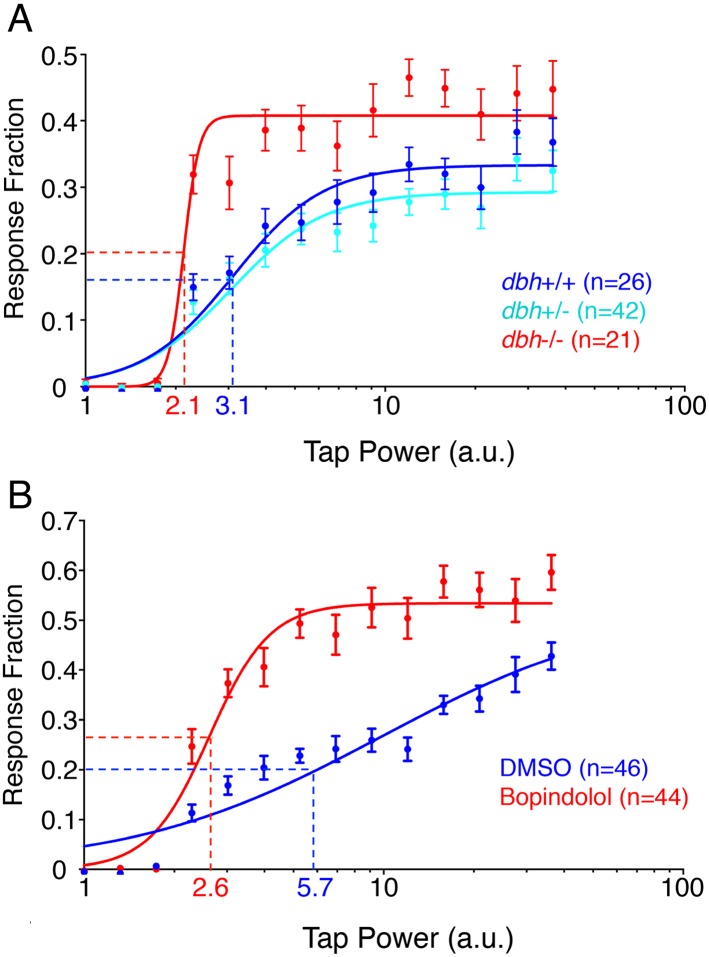
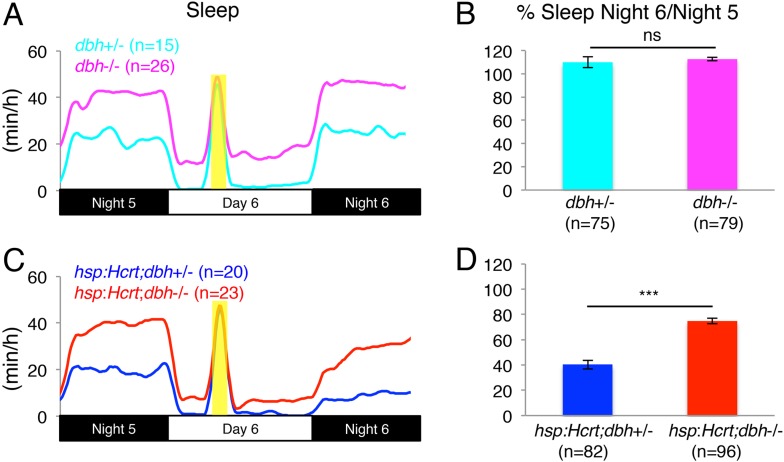
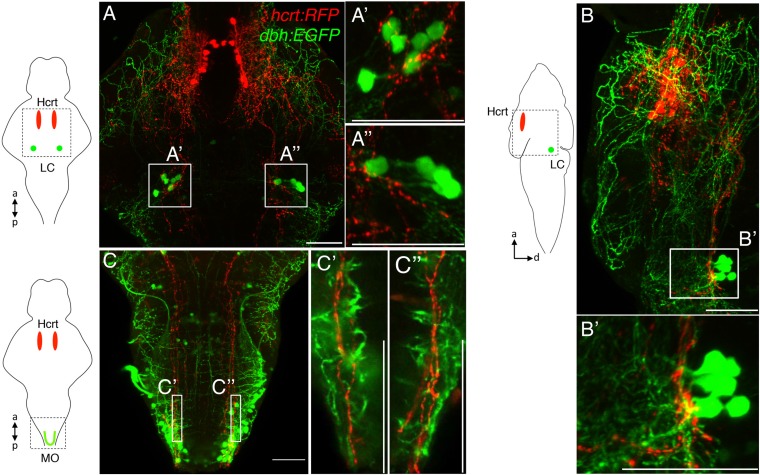
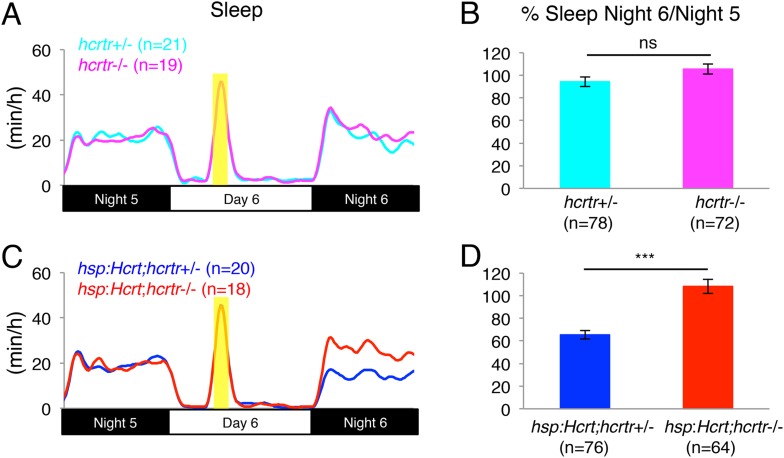
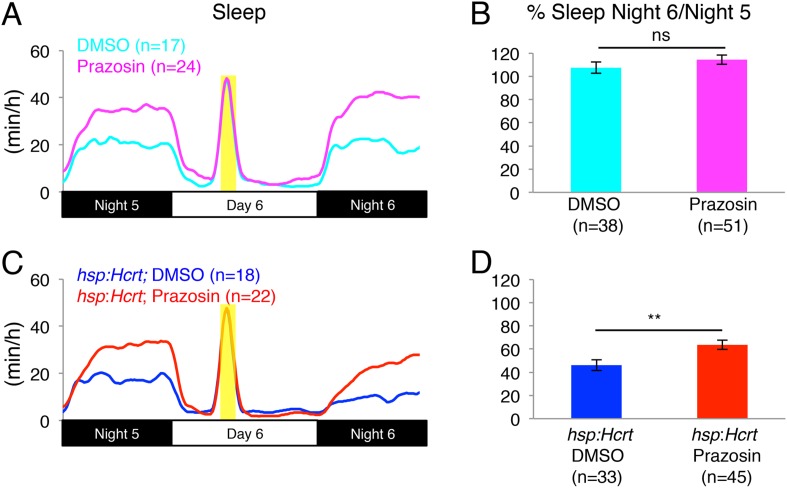
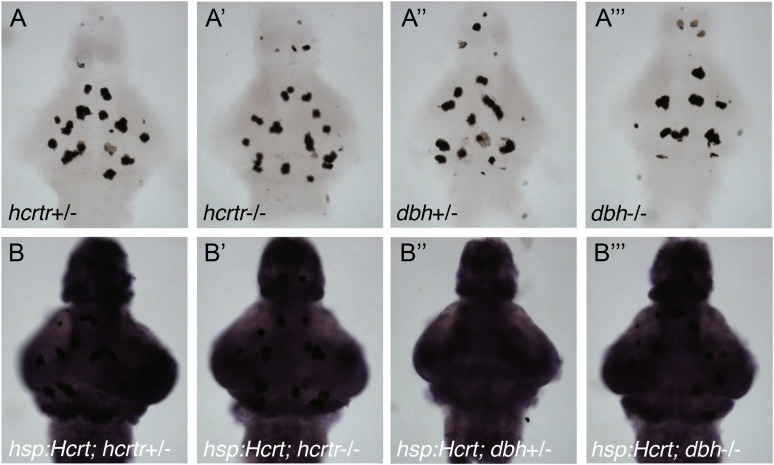
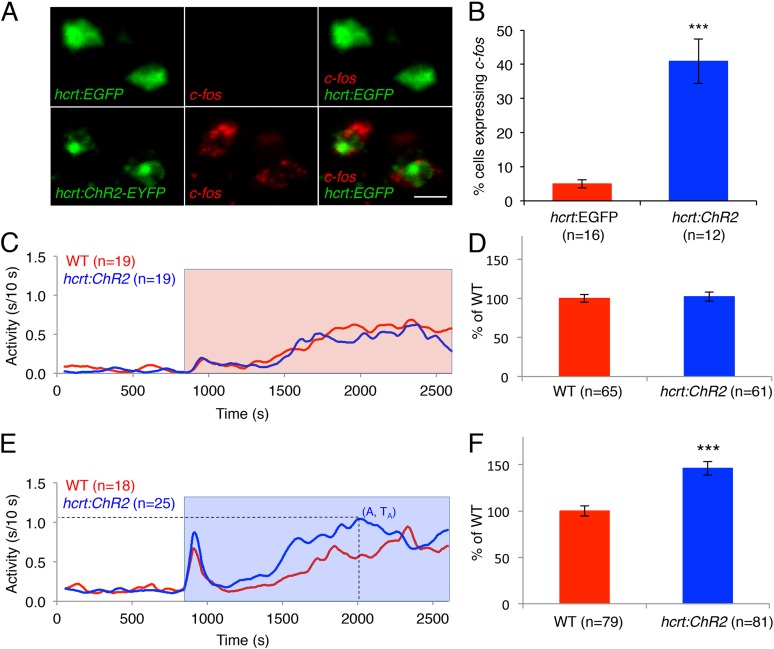
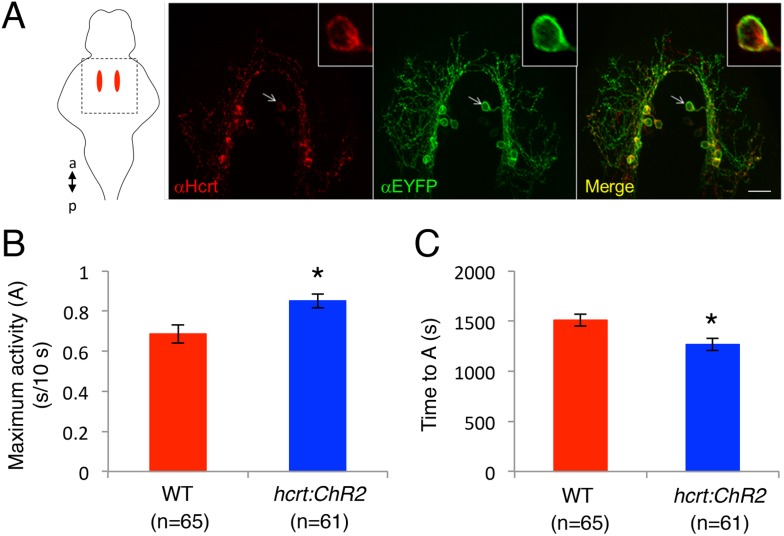
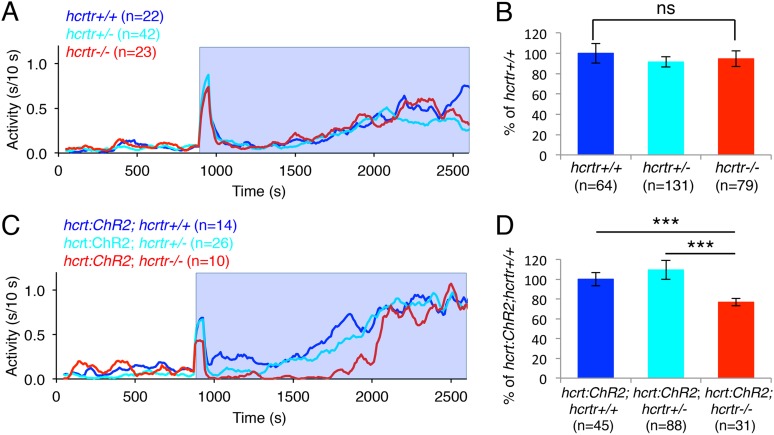
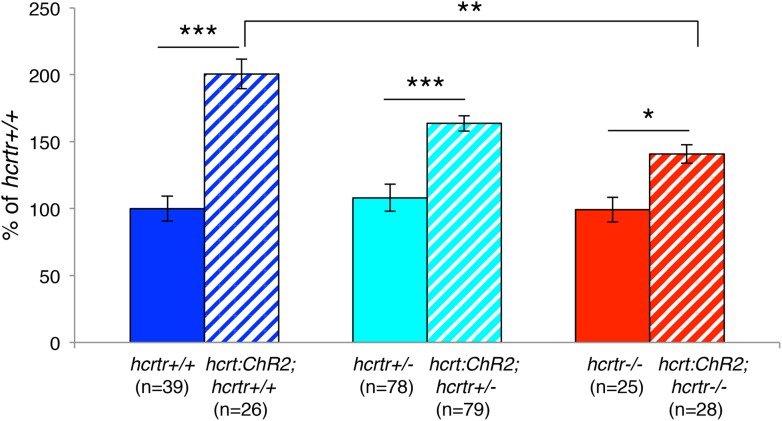
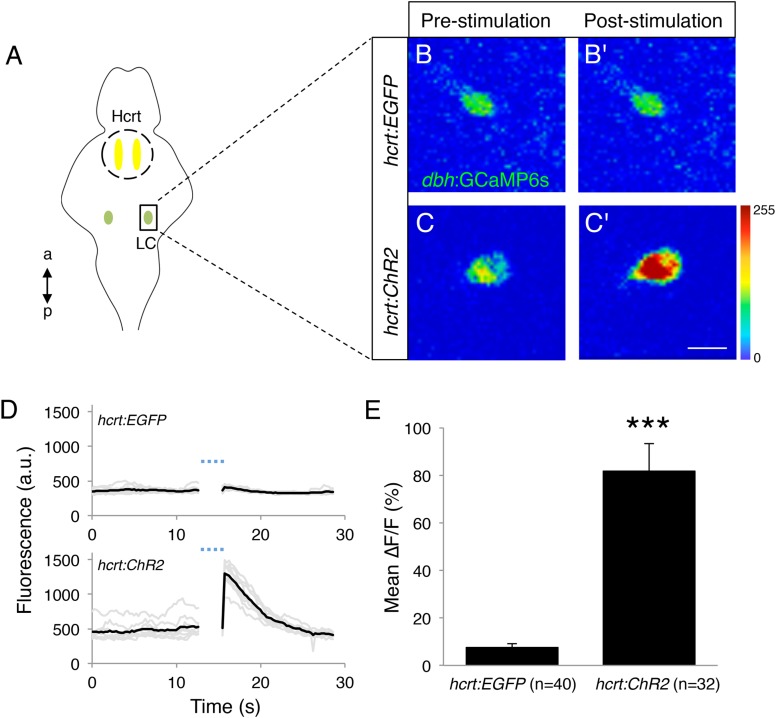
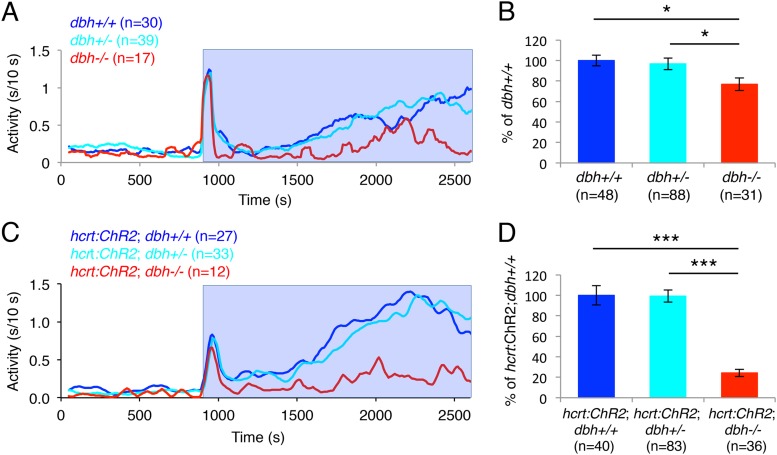
Pharmacological studies in mammals suggest that norepinephrine (NE) plays an important role in promoting arousal. However, the role of endogenous NE is unclear, with contradicting reports concerning the sleep phenotypes of mice lacking NE due to mutation of dopamine β-hydroxylase (dbh). To investigate NE function in an alternative vertebrate model, we generated dbh mutant zebrafish. In contrast to mice, these animals exhibit dramatically increased sleep. Surprisingly, despite an increase in sleep, dbh mutant zebrafish have a reduced arousal threshold. These phenotypes are also observed in zebrafish treated with small molecules that inhibit NE signaling, suggesting that they are caused by the lack of NE. Using genetic overexpression of hypocretin (Hcrt) and optogenetic activation of hcrt-expressing neurons, we also find that NE is important for Hcrt-induced arousal. These results establish a role for endogenous NE in promoting arousal and indicate that NE is a critical downstream effector of Hcrt neurons.

Keywords: hypocretin; neuroscience; noradrenaline; norepinephrine; orexin; sleep; zebrafish.


Conflict of interest statement

The authors declare that no competing interests exist.

Figures

Figure 1.
Figure 1.. Prazosin treated larvae are less active and sleep more than vehicle treated controls.
Representative activity (A), waking activity (amount of locomotor activity while awake) (B) and sleep (C) traces of vehicle (blue) and prazosin (red) treated zebrafish larvae. Bar graphs of activity (D), waking activity (E), sleep (F), sleep bout number (G), sleep bout length (H) and sleep latency (I) from three combined experiments (n > 180 for each condition). Bars represent mean ± s.e.m. *, p < 0.05 and ***, p < 0.0001 by one-way ANOVA. DOI: http://dx.doi.org/10.7554/eLife.07000.003
Figure 1—figure supplement 1.
Figure 1—figure supplement 1.. Prazosin night sleep dose–response curve.
Larvae were treated with prazosin over range of concentrations (n = 12 for each concentration) on the morning of day 5 of development. Sleep was measured during night 5. Mean ± s.e.m is shown for each concentration. DOI: http://dx.doi.org/10.7554/eLife.07000.004
Figure 1—figure supplement 2.
Figure 1—figure supplement 2.. Clonidine treated larvae are less active and sleep more than vehicle treated controls during the day.
Representative activity (A), waking activity (B) and sleep (C) traces of vehicle (blue) and clonidine (red) treated zebrafish larvae. Bar graphs of activity (D), waking activity (E), sleep (F), sleep bout number (G), sleep bout length (H) and sleep latency (I) from two combined experiments (n > 140 for each condition). Bars represent mean ± s.e.m. *, p < 0.05; **; p < 0.001; ***, p < 0.0001 by one-way ANOVA. DOI: http://dx.doi.org/10.7554/eLife.07000.005
Figure 1—figure supplement 3.
Figure 1—figure supplement 3.. Bopindolol treated larvae sleep more than vehicle treated controls.
Representative activity (A), waking activity (B) and sleep (C) traces of vehicle (blue) and bopindolol (red) treated zebrafish larvae. Bar graphs of activity (D), waking activity (E), sleep (F), sleep bout number (G), sleep bout length (H) and sleep latency (I) from two combined experiments (n > 140 for each condition). Bars represent mean ± s.e.m. n indicates number of larvae. *, p < 0.05; **, p < 0.001; ***, p < 0.0001 by one-way ANOVA. DOI: http://dx.doi.org/10.7554/eLife.07000.006
Figure 2.
Figure 2.. dbh mutant larvae are less active and sleep more than sibling controls.
Representative activity (A), waking activity (B) and sleep (C) traces of dbh+/+ (blue) dbh+/ (cyan) and dbh−/ (red) zebrafish larvae. Bar graphs show mean ± s.e.m. activity (D), waking activity (E), sleep (F), sleep bout number (G), sleep bout length (H) and sleep latency (I) from seven combined experiments (n > 250 for each genotype). n indicates number of larvae. ***, p < 0.0001 and ns, not significant by one-way ANOVA. DOI: http://dx.doi.org/10.7554/eLife.07000.007
Figure 2—figure supplement 1.
Figure 2—figure supplement 1.. Verification of zebrafish dbh mutant.
(A) Alignment of human, mouse, WT zebrafish and mutant zebrafish DBH amino acid sequences. The coding sequence of the mutant allele terminates before the conserved active site residue (asterisk). (B) ELISA quantification of NE levels in WT and dbh−/ zebrafish larvae. Mean ± s.e.m. is shown. ***, p < 0.0001 by one-way ANOVA. (C) RNA in situ hybridization (ISH) for dbh in dbh+/ (C′) and dbh−/ (C′′) sibling larvae in the LC, indicated by white arrows. Larvae were obtained from a dbh+/ to dbh−/ mating and were genotyped after imaging. Schematic diagram indicates the brain region (box) containing the LC (green) that is shown in the ISH images. a = anterior, p = posterior. Scale bar = 50 μm. DOI: http://dx.doi.org/10.7554/eLife.07000.008
Figure 2—figure supplement 2.
Figure 2—figure supplement 2.. Treatment of dbh−/− fish with prazosin does not alter sleep/wake behavior.
Representative activity (A), waking activity (B) and sleep (C) traces of vehicle (blue) and prazosin (red) treated zebrafish dbh−/ larvae. Bar graphs of activity (D), waking activity (E) and sleep (F) from two combined experiments (n > 45 for each condition). Bars represent mean ± s.e.m. n indicates number of larvae. DOI: http://dx.doi.org/10.7554/eLife.07000.009
Figure 3.
Figure 3.. dbh mutants and bopindolol-treated WT larave exhibit lower arousal threshold.
Stimulus-response curves generated by a tapping assay for dbh−/ and sibling control larvae (A), and bopindolol and DMSO treated WT larvae (B). Thirty trials were performed at each stimulus intensity, with a 1 min inter-trial interval. Each data point indicates mean ± s.e.m. Stimulus-response curves were constructed using the non-linear variable slope module in Prism and fitted using ordinary least squares. Dashed lines mark the ETP50 values for different genotypes and drug treatments. dbh−/ have an ETP50 value of 2.1 vs 3.1 for sibling controls (32% decrease, p < 0.0001 by extra sum-of-squares F test) (A), and bopindolol treated animals have an ETP50 value of 2.6 vs 5.7 for sibling controls (54% decrease, p < 0.0001 by extra sum-of-squares F test) (B). n indicates number of larvae. DOI: http://dx.doi.org/10.7554/eLife.07000.010
Figure 4.
Figure 4.. Reduced sleep at night due to Hcrt overexpression is suppressed in dbh mutants.
(A, C) Sleep traces from a single representative experiment; yellow region indicates time of heat shock (HS) during day 6. (B, D) Bar graphs show mean ± s.e.m. percentage change in sleep during night 6 compared to night 5 from four combined experiments. (B) In the absence of the hsp:Hcrt transgene, HS during day 6 has no significant effect on dbh−/ larvae compared to dbh+/ larvae. (D) The reduced sleep induced by Hcrt overexpression is significantly diminished in dbh−/ larvae compared to dbh+/ sibling controls. n indicates number of larvae. ***, p < 0.0001 and ns, not significant by one-way ANOVA. DOI: http://dx.doi.org/10.7554/eLife.07000.011
Figure 4—figure supplement 1.
Figure 4—figure supplement 1.. Hcrt neurons project to dbh expressing cells.
Hcrt neurons (red) project to dbh expressing cells (green) in the LC. (A) Dorsal-ventral maximum intensity projection, (B) lateral maximal intensity projection (dorsal to the right). Boxed regions are shown at higher magnification in (A′, A′′, B′). (C) Projections from Hcrt neurons to dbh-expressing neurons in the medulla oblongata (MO). A dorsal-ventral maximum intensity projection is shown. Single optical sections of the boxed regions are shown at higher magnification in (C′, C′′). Schematic diagrams indicate brain regions shown in the confocal images. a = anterior, p = posterior, d = dorsal. Scale bars = 50 μm. DOI: http://dx.doi.org/10.7554/eLife.07000.012
Figure 4—figure supplement 2.
Figure 4—figure supplement 2.. Reduced sleep at night following Hcrt overexpression requires the hcrtr.
(A, C) Sleep traces from a single representative experiment; yellow region indicates time of HS during day 6. (B, D) Bar graphs show mean ± s.e.m. percentage change in sleep during night 6 compared to night 5 from four combined experiments. (B) In the absence of the hsp:Hcrt transgene, HS during day 6 has no significant effect on hcrtr−/− larvae compared to hcrtr+/− larvae. (D) The reduced sleep induced by Hcrt overexpression is significantly diminished in hcrtr−/− larvae compared to hcrtr+/− sibling controls. n indicates number of larvae. ***, p < 0.0001 and ns, not significant by one-way ANOVA. We note that zebrafish hcrtr−/− larvae have been shown to exhibit normal baseline locomotor activity and sleep levels (Appelbaum et al., 2009), similar to mouse hcrt and hcrt receptor 2 mutants (Willie et al., 2003; Mochizuki et al., 2011). DOI: http://dx.doi.org/10.7554/eLife.07000.013
Figure 4—figure supplement 3.
Figure 4—figure supplement 3.. Reduced sleep at night due to Hcrt overexpression is suppressed by prazosin.
(A, C) Sleep traces from a single representative experiment; yellow region indicates time of HS during day 6. (B, D) Bar graphs show mean ± s.e.m. percentage change in sleep during night 6 compared to night 5 from two combined experiments. (B) In the absence of the hsp:Hcrt transgene, HS during day 6 has no significant effect on the Sleep Night 6/Night 5 ratio, whether the animals are treated with prazosin or vehicle. (D) The reduced sleep induced by Hcrt overexpression is significantly diminished by prazosin. n indicates number of larvae. **, p < 0.01 and ns, not significant by one-way ANOVA. DOI: http://dx.doi.org/10.7554/eLife.07000.014
Figure 4—figure supplement 4.
Figure 4—figure supplement 4.. The heat shock promoter is not suppressed in hcrtr or dbh mutants.
Representative images of brains from larvae that do not (A) or do (B) contain the hsp:Hcrt transgene, fixed 30 min after HS, and processed for ISH using a hcrt-specific probe. hcrt overexpression levels are similar for hcrtr+/− (B), hcrtr−/− (B′), dbh+/ (B′′) and dbh−/ (B′′′) animals. Larvae were generated by crossing homozygous to heterozygous mutant animals, and brains were genotyped after imaging. Dark spots in (AA′′′) are pigment cells. Endogenous hcrt expression is not observed in (AA′′′) because ISH development was stopped before endogenous hcrt is detectable. DOI: http://dx.doi.org/10.7554/eLife.07000.015
Figure 5.
Figure 5.. Optogenetic activation of Hcrt neurons increases locomotor activity.
(A) Representative images of Hcrt neurons co-labeled with EYFP or EGFP (green) and c-fos (red). Scale bar = 10 μm. (B) Mean ± s.e.m. percentage of EYFP- or EGFP-expressing neurons that also express c-fos in Tg(hcrt:EGFP) and Tg(hcrt:ChR2-EYFP) larvae. (C) Representative locomotor activity trace during red light exposure. (D) Average locomotor activity relative to WT siblings during red light exposure. Data is pooled from 3 experiments and is represented as mean ± s.e.m. (E) Representative locomotor activity trace during blue light exposure. (F) Average locomotor activity relative to WT siblings during blue light exposure. Data is pooled from 4 experiments and is represented as mean ± s.e.m. Red and blue boxes in (C) and (E) indicate periods of red and blue light illumination. ‘A’ is the maximum activity reached for larvae of a particular genotype and ‘TA’ is the time taken to reach maximum activity A. n indicates number of larvae. ***, p < 0.0001 by one-way ANOVA. DOI: http://dx.doi.org/10.7554/eLife.07000.016
Figure 5—figure supplement 1.
Figure 5—figure supplement 1.. Specific expression of ChR2-EYFP in Hcrt neurons and temporal dynamics of hcrt:ChR2-EYFP induced locomotor activity.
(A) Representative image from a Tg(hcrt:ChR2-EYFP) larval brain showing Hcrt (red) and EYFP (green) immunoreactivity, and merged images (yellow). Arrow indicates a neuron that is shown at higher magnification in the inset images. Schematic diagram indicates the brain region shown in the images. a = anterior, p = posterior. Scale bar = 20 μm. (B). Activation of Hcrt neurons using ChR2 changes the dynamics of locomotor activity. Tg(hcrt:ChR2-EYFP) larvae reach a higher maximum level of locomotor activity (B), and they do so faster (C), than their non-transgenic siblings. ‘A’ is the maximum activity reached for larvae of a particular genotype and ‘TA’ is the time taken to reach maximum activity, as diagrammed in Figure 5. Data represent mean ± s.e.m. n indicates number of larvae. *, p < 0.05 by one-way ANOVA. DOI: http://dx.doi.org/10.7554/eLife.07000.017
Figure 6.
Figure 6.. The hcrtr is required for Hcrt neuron-induced increased locomotor activity.
(A, C) Representative locomotor activity traces for hcrtr−/− and sibling controls without (A) and with (C) the hcrt:ChR2-EYFP transgene during blue light exposure. (B, D) Average locomotor activity relative to sibling controls. Data is pooled from 3 experiments in both cases. Data is represented as mean ± s.e.m. and is plotted as percentage of hcrtr+/+ (B) or hcrt:ChR2-EYFP; hcrtr+/+ (D). n indicates number of larvae. ***, p < 0.0001 and ns, not significant by one-way ANOVA followed by Tukey's test to correct for multiple comparisons. DOI: http://dx.doi.org/10.7554/eLife.07000.018
Figure 6—figure supplement 1.
Figure 6—figure supplement 1.. Hcrt signaling is required for Hcrt neuron-induced increased locomotor activity.
In this experiment, larvae of all six genotypes were tested in the same behavioral plates. Tg(hcrt:ChR2-EYFP);hcrtr+/+ larvae (blue stripes) showed a significant increase in locomotor activity compared to hcrtr+/+ larvae (blue). A similar increase was observed for Tg(hcrt:ChR2-EYFP);hcrtr+/− larvae (cyan stripes) compared to hcrtr+/− larvae (cyan), although the difference was smaller than for hcrtr+/+ larvae, suggesting a dosage effect. Tg(hcrt:ChR2-EYFP);hcrtr−/− larvae (red stripes) were also more active than hcrtr−/− larvae (red), although the difference was much smaller than for Tg(hcrt:ChR2-EYFP);hcrtr+/+ larvae (blue stripes) compared to hcrtr+/+ larvae (blue). Tg(hcrt:ChR2-EFYP);hcrtr+/+ larvae (blue stripes) were also significantly more active than Tg(hcrt:ChR2-EYFP);hcrtr−/− larvae (red stripes). These results suggest that most, but not all, of the effect of stimulating Hcrt neurons on locomotor activity is due to Hcrt signaling. Data is pooled from 3 experiments. Data is represented as mean ± s.e.m. and is plotted as percentage of hcrtr+/+. n indicates number of larvae. *, p < 0.05; **p < 0.01; ***, p < 0.0001 by Steel–Dwass test and correction for multiple comparisons. DOI: http://dx.doi.org/10.7554/eLife.07000.019
Figure 7.
Figure 7.. Optogenetic stimulation of Hcrt neurons activates LC neurons.
(A) Schematic representation of areas stimulated (Hcrt, yellow) and imaged (LC, green). a = anterior, p = posterior. (B, C) Representative images of a LC cell expressing GCaMP6s in a Tg(hcrt:EGFP) (B) or Tg(hcrt:ChR2-EYFP) (C) larva before (B, C) and immediately after (B′, C′) stimulation of Hcrt neuron region. (D) GCaMP6s fluorescence intensity for a representative LC neuron in a Tg(hcrt:EGFP) (top) and a Tg(hcrt:ChR2-EYFP) (bottom) larva. Single-trial (gray) and average (black) responses are shown. (E) Mean ± s.e.m. ∆F/F (%) values averaged for all trials. n indicates number of trials for 5 Tg(hcrt:EGFP) and 4 Tg(hcrt:ChR2-EYFP) larvae. ***, p < 0.001 by one-way ANOVA. See Videos 1 and 2 for examples of GCaMP6s imaging. DOI: http://dx.doi.org/10.7554/eLife.07000.020
Figure 8.
Figure 8.. dbh is required for Hcrt neuron-induced increased locomotor activity.
(A, C) Representative locomotor activity traces for dbh−/ and sibling control larvae without (A) and with (C) the hcrt:ChR2-EYFP transgene during blue light exposure. (B, D) Average locomotor activity relative to sibling controls. Data is pooled from 2 (B) or 3 (D) experiments. Data is represented as mean ± s.e.m. and is plotted as percentage of dbh+/+ (B) or hcrt:ChR2-EYFP; dbh+/+ (D). n indicates number of larvae. *, p < 0.05 and ***, p < 0.0001 by one-way ANOVA followed by Tukey's test to correct for multiple comparisons. DOI: http://dx.doi.org/10.7554/eLife.07000.023

Similar articles

Cited by

References

    1. Adamantidis AR, Zhang F, Aravanis AM, Deisseroth K, de Lecea L. Neural substrates of awakening probed with optogenetic control of hypocretin neurons. Nature. 2007;450:420–424. doi: 10.1038/nature06310. - DOI - PMC - PubMed
    1. Alexandre C, Andermann ML, Scammell TE. Control of arousal by the orexin neurons. Current Opinion in Neurobiology. 2013;23:752–759. doi: 10.1016/j.conb.2013.04.008. - DOI - PMC - PubMed
    1. Allada R, Siegel JM. Unearthing the phylogenetic roots of sleep. Current Biology. 2008;18:R670–R679. doi: 10.1016/j.cub.2008.06.033. - DOI - PMC - PubMed
    1. Appelbaum L, Wang GX, Maro GS, Mori R, Tovin A, Marin W, Yokogawa T, Kawakami K, Smith SJ, Gothilf Y, Mignot E, Mourrain P. Sleep-wake regulation and hypocretin-melatonin interaction in zebrafish. Proceedings of the National Academy of Sciences of USA. 2009;106:21942–21947. doi: 10.1073/pnas.906637106. - DOI - PMC - PubMed
    1. Berridge CW, Schmeichel BE, Espana RA. Noradrenergic modulation of wakefulness/arousal. Sleep Medicine Reviews. 2012;16:187–197. doi: 10.1016/j.smrv.2011.12.003. - DOI - PMC - PubMed

Publication types

MeSH terms

Supplementary concepts

LinkOut - more resources