. 2015 Sep 24;525(7570):528-32.
doi: 10.1038/nature15367. Epub 2015 Sep 16.

Neutrophil ageing is regulated by the microbiome

Affiliations

Neutrophil ageing is regulated by the microbiome

Dachuan Zhang et al. Nature. .

Abstract

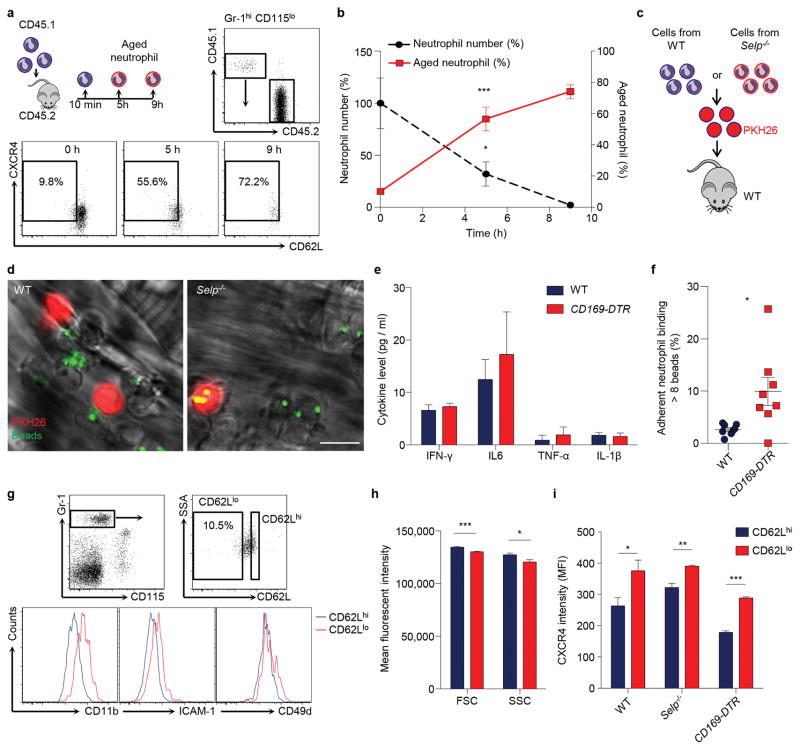
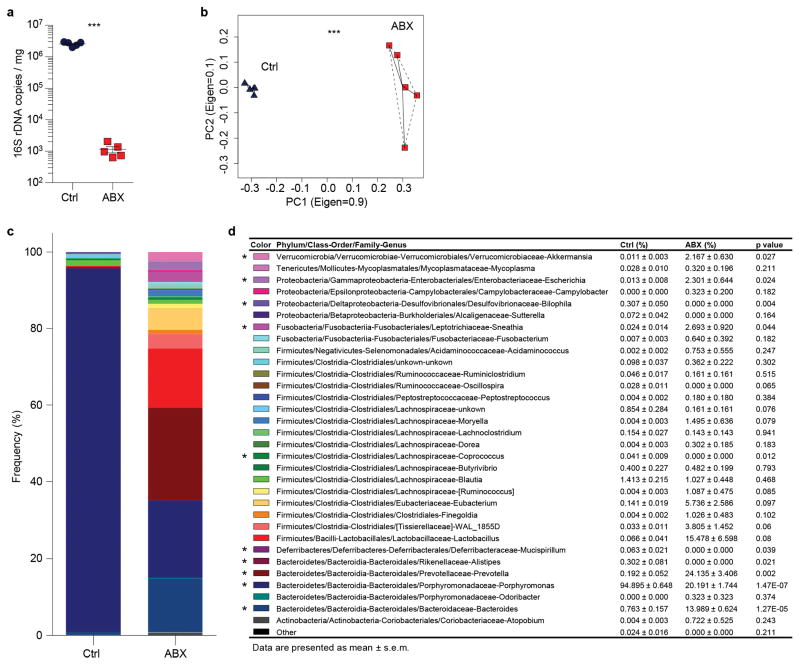
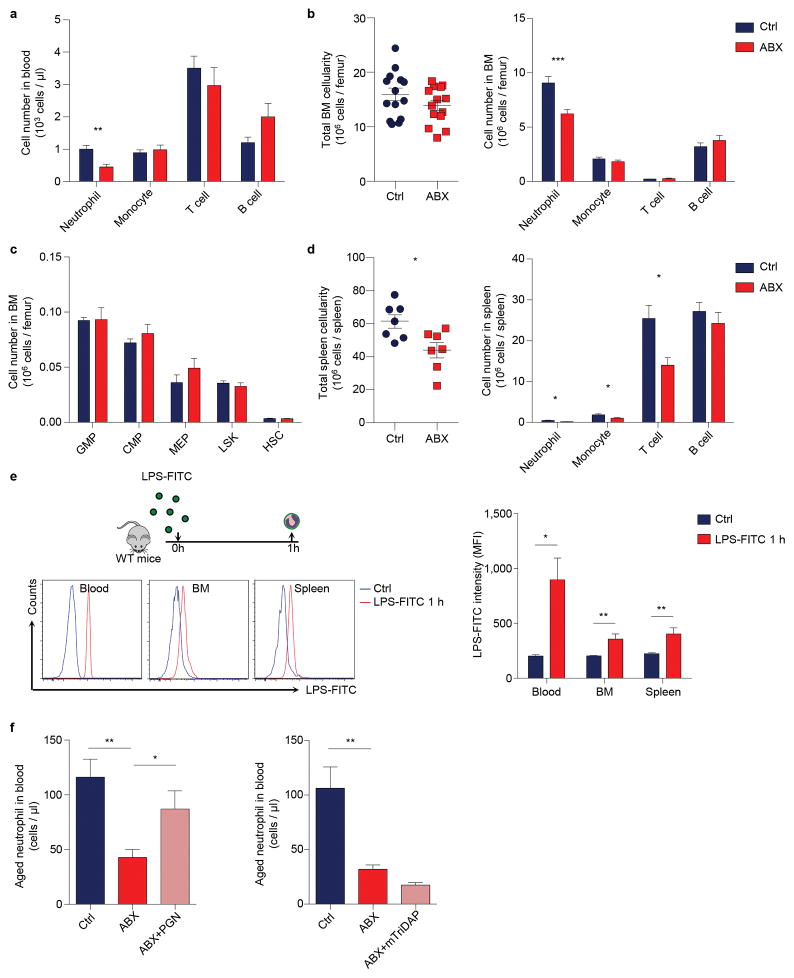
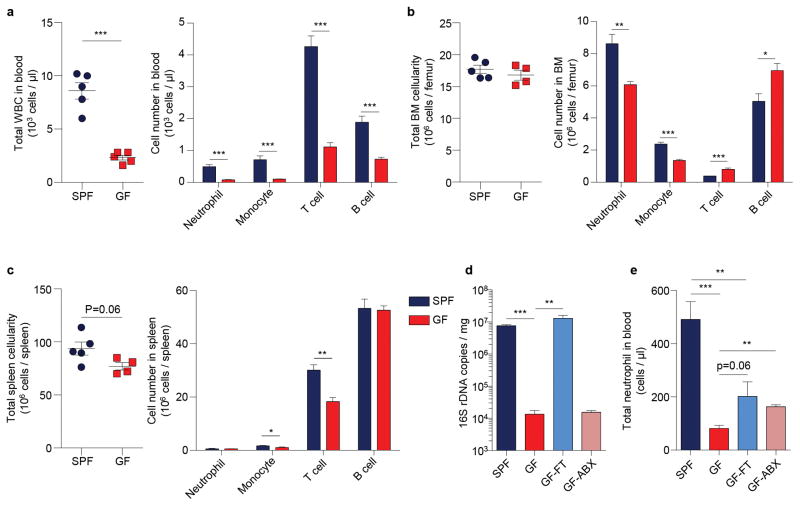
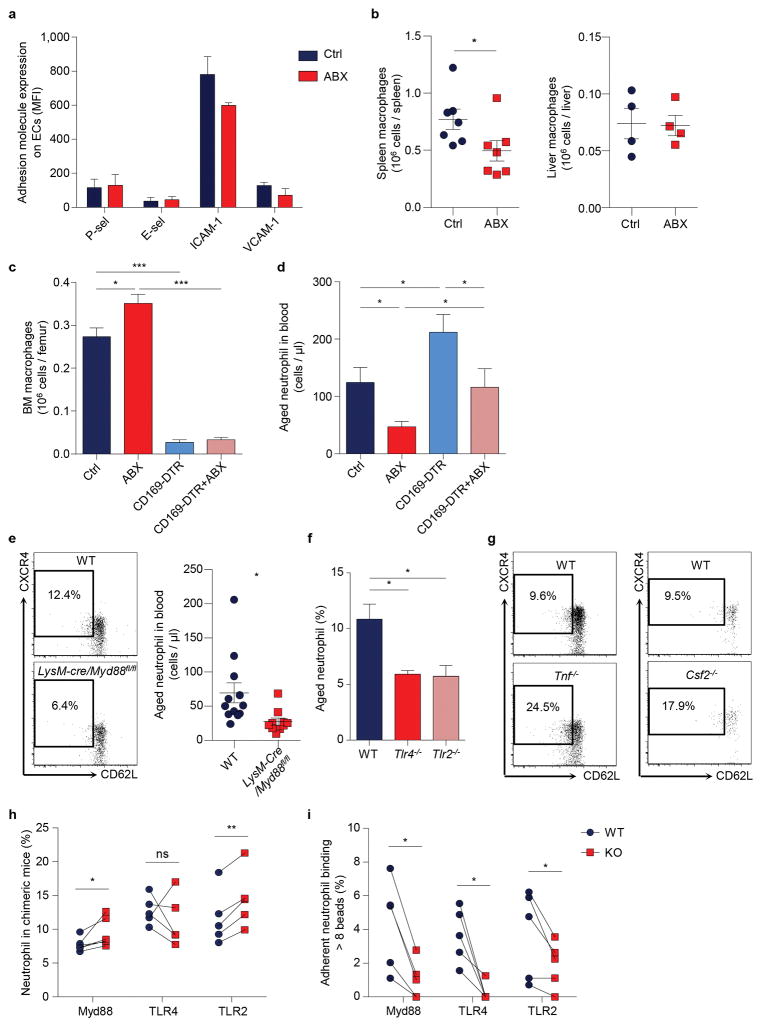
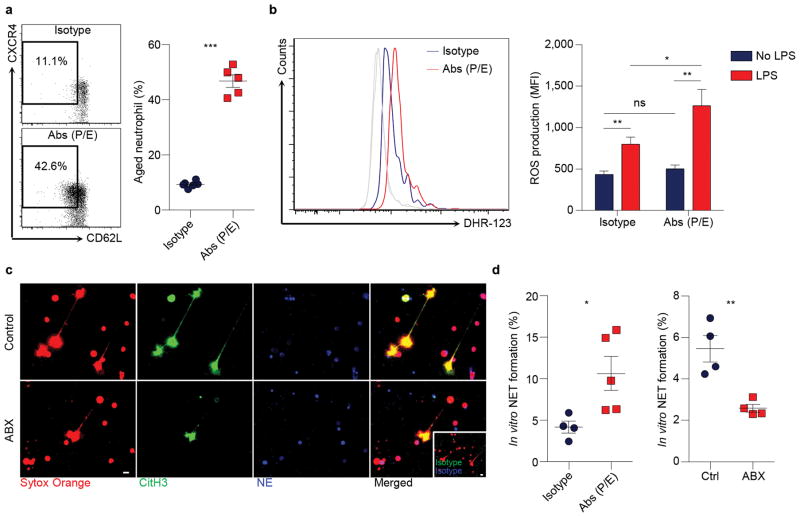
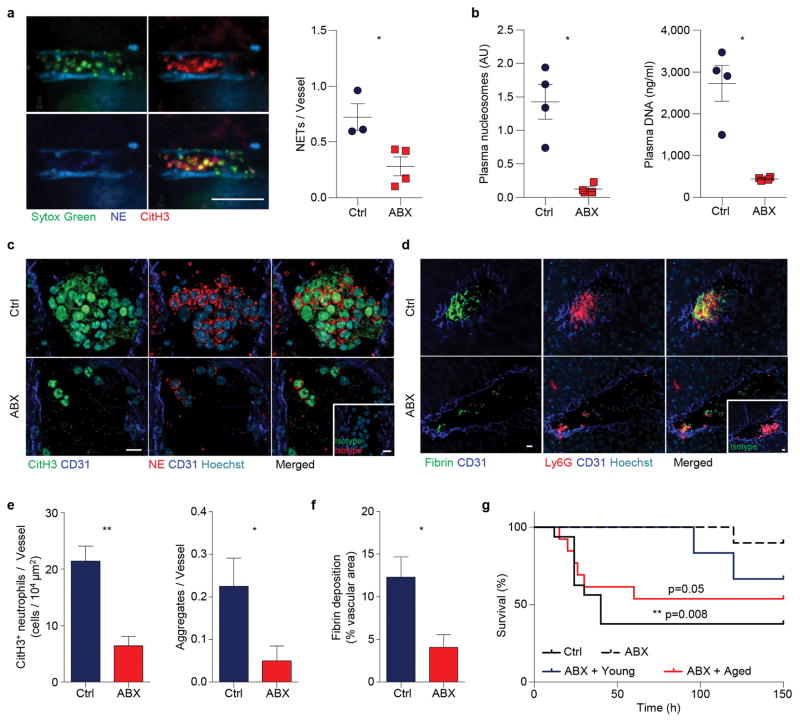
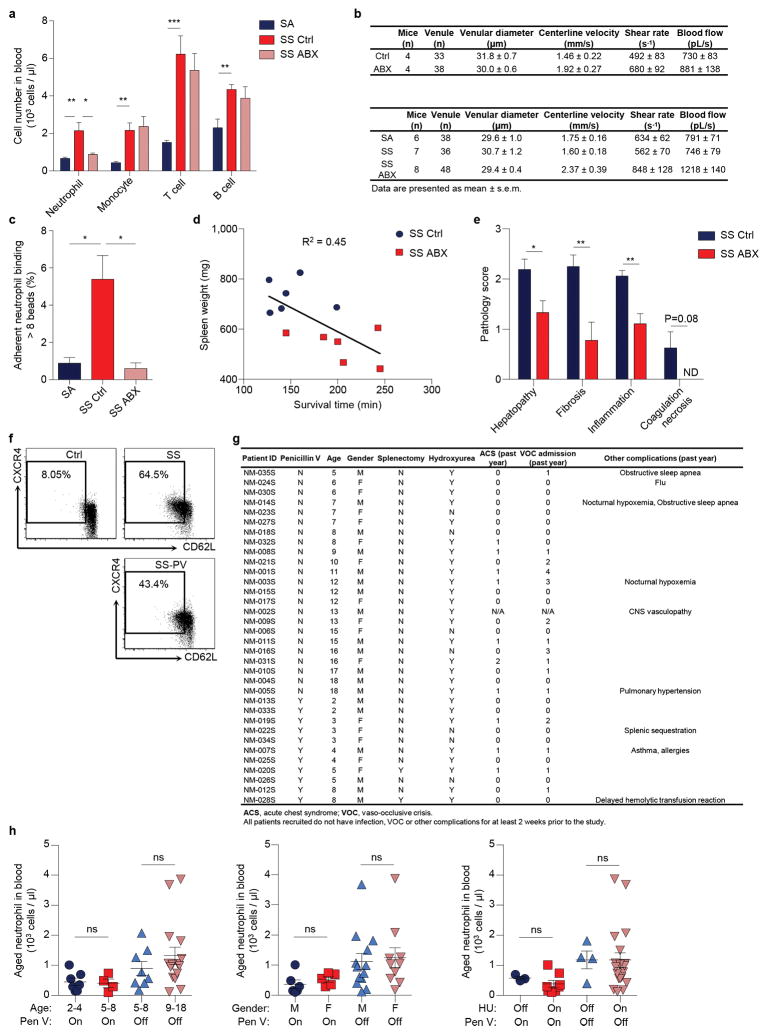
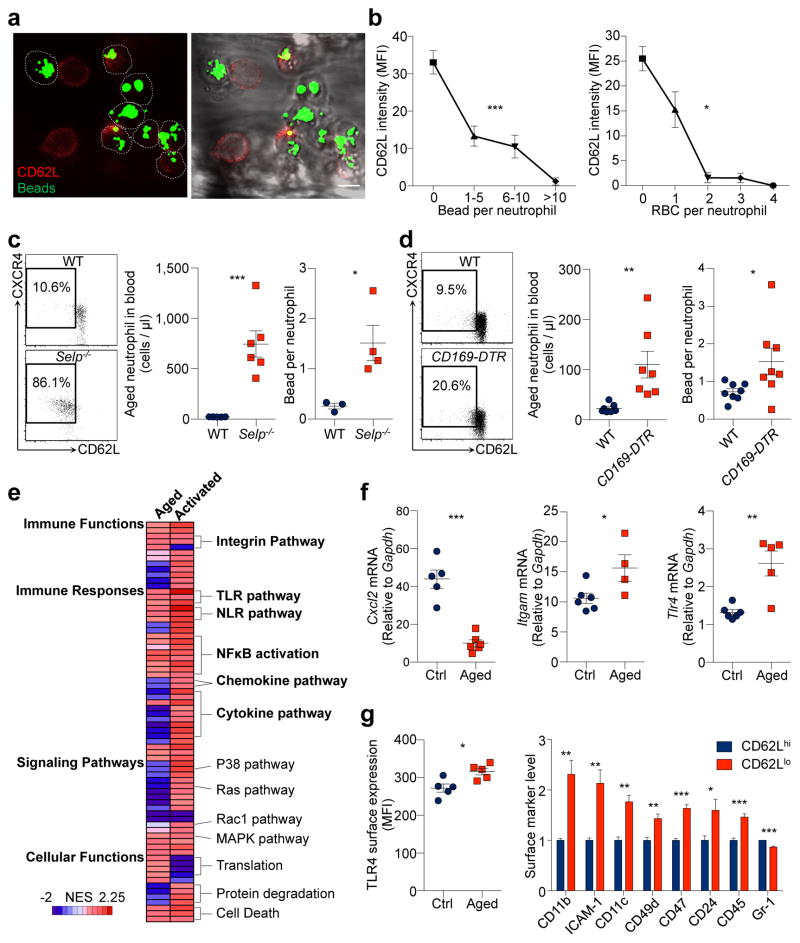
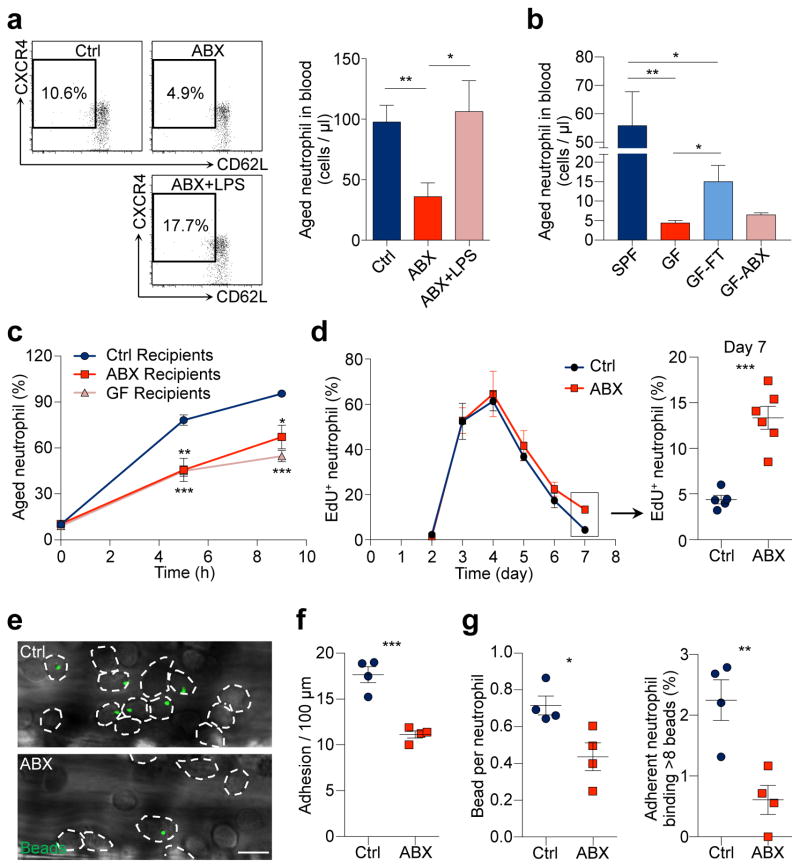
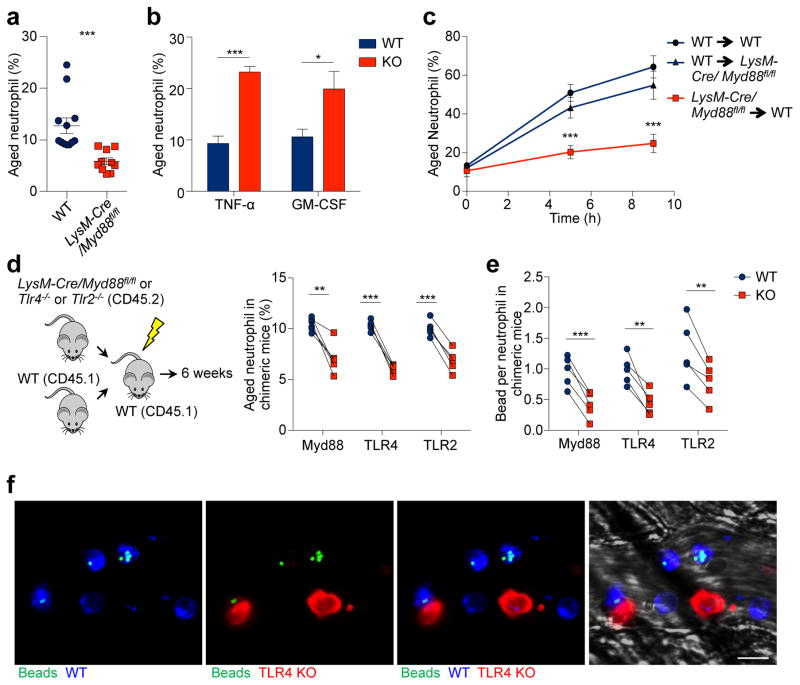
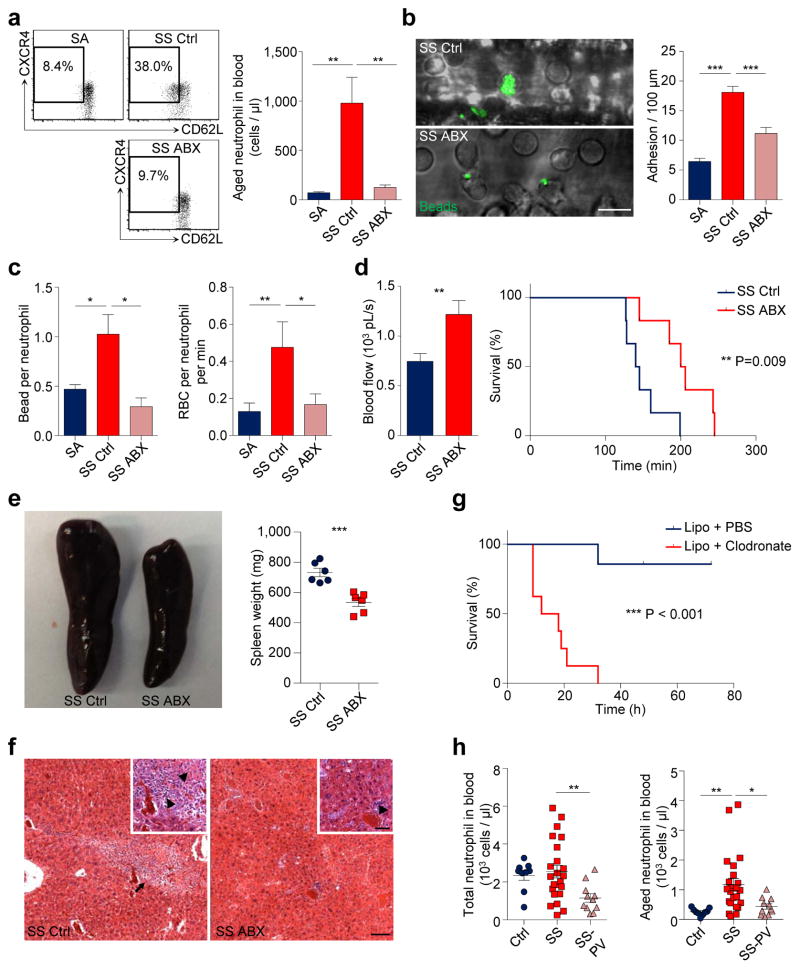
Blood polymorphonuclear neutrophils provide immune protection against pathogens, but may also promote tissue injury in inflammatory diseases. Although neutrophils are generally considered to be a relatively homogeneous population, evidence for heterogeneity is emerging. Under steady-state conditions, neutrophil heterogeneity may arise from ageing and replenishment by newly released neutrophils from the bone marrow. Aged neutrophils upregulate CXCR4, a receptor allowing their clearance in the bone marrow, with feedback inhibition of neutrophil production via the IL-17/G-CSF axis, and rhythmic modulation of the haematopoietic stem-cell niche. The aged subset also expresses low levels of L-selectin. Previous studies have suggested that in vitro-aged neutrophils exhibit impaired migration and reduced pro-inflammatory properties. Here, using in vivo ageing analyses in mice, we show that neutrophil pro-inflammatory activity correlates positively with their ageing whilst in circulation. Aged neutrophils represent an overly active subset exhibiting enhanced αMβ2 integrin activation and neutrophil extracellular trap formation under inflammatory conditions. Neutrophil ageing is driven by the microbiota via Toll-like receptor and myeloid differentiation factor 88-mediated signalling pathways. Depletion of the microbiota significantly reduces the number of circulating aged neutrophils and dramatically improves the pathogenesis and inflammation-related organ damage in models of sickle-cell disease or endotoxin-induced septic shock. These results identify a role for the microbiota in regulating a disease-promoting neutrophil subset.


Conflict of interest statement

The authors declare no competing financial interests.

Figures

Extended Data Figure 1
Extended Data Figure 1. Phenotypic and functional characterization of aged neutrophils
a, Flow cytometry analysis of donor neutrophil ageing after adoptive transfer into recipients. Donor neutrophils gated by CD45.1+ and aged neutrophils gated by CD62LloCXCR4hi. b, Ageing and clearance kinetics of donor neutrophils after adoptive transfer into recipients (n = 3 mice). Left y-axis, donor neutrophil number relative to the initial number of neutrophils transferred (black dash line); right y-axis, percentage of the aged subset in donor neutrophils (red line). c–d, MFIM analysis of Mac-1 activation of neutrophils harvested from WT or Selp−/− mice, labelled by PKH26 (red) and transferred into WT recipients. Scale bar, 10 μm. e, Plasma cytokine levels in WT and CD169-DTR mice 5 days after DT treatment (n = 5 mice). f, Percentages of adherent neutrophils that capture > 8 beads in diphtheria toxin (DT)-treated WT and CD169-DTR mice (n = 8 mice). g–h, Flow cytometry analysis of surface marker expressions (g), cell size (FSC) and granularity (SSC; h; n = 7 mice) on CD62Lhi young and CD62Llo aged neutrophils. i, CXCR4 expression levels on CD62Lhi young and CD62Llo aged neutrophils in WT, Selp−/−, and CD169-DTR mice (WT: n = 13 mice; Selp−/−: n = 4 mice; CD169-DTR: n = 5 mice). Error bars, mean ± s.e.m. * P < 0.05, ** P < 0.01, *** P < 0.001, data representing ≥2 independent experiments analysed with one-way ANOVA (b) or unpaired Student’s t-test (e–i).
Extended Data Figure 2
Extended Data Figure 2. Antibiotic treatment efficiently depletes and alters the composition of the microbiota
a, Copy numbers of 16S ribosomal DNA in feces from control and antibiotics (ABX)-treated mice (n = 5 mice). b, Principal component analysis of the microbiome composition in control and ABX-treated mice (n = 5 mice). c–d, Percentage of each bacteria genus in total microbiome (n = 5 mice). Error bars, mean ± s.e.m. * P < 0.05, *** P < 0.001, data representing ≥2 independent experiments analysed with unpaired Student’s t-test (a, d) or permutational multivariate ANOVA (b).
Extended Data Figure 3
Extended Data Figure 3. Microbiota-derived molecules regulate neutrophil homeostasis and ageing
a, Numbers of circulating leukocyte subsets in control and antibiotics (ABX)-treated mice (n = 9 mice). b, Bone marrow cellularity and numbers of leukocyte subsets in the bone marrow of control and ABX-treated mice (n = 14 mice). c, Numbers of bone marrow hematopoietic stem and progenitor cells in control and ABX-treated mice (n = 9 mice). d, Spleen cellularity and numbers of leukocyte subsets in the spleen of control and ABX-treated mice (n = 7 mice). e, Flow cytometry analysis of neutrophil-LPS interactions in blood, bone marrow and spleen 1 hour after LPS-FITC gavage (Ctrl: n = 4 mice; LPS-FITC: n = 5 mice). Histogram showing fluorescence intensity on neutrophils gated by Gr-1hi CD115lo SSAhi. f, Numbers of circulating aged neutrophils in control, ABX-treated, and ABX-treated mice fed with peptidoglycan (PGN) or mTriDAP (left, n = 11,9,9 mice; right, n = 10,10,5 mice). Error bars, mean ± s.e.m. * P < 0.05, ** P < 0.01, *** P < 0.001, data representing ≥2 independent experiments analysed with unpaired Student’s t-test.
Extended Data Figure 4
Extended Data Figure 4. Neutrophil homeostasis is altered in germ-free mice
a, Total WBC counts and numbers of leukocyte subsets in blood of specific pathogen free (SPF) and germ-free (GF) mice (n = 5 mice). b, Total BM cellularity and numbers of leukocyte subsets in the BM of SPF and GF mice (SPF: n = 5 mice; GF: n = 4 mice). c, Total spleen cellularity and numbers of leukocyte subsets in the spleen of SPF and GF mice (SPF: n = 5 mice; GF: n = 4 mice). d, Copy numbers of 16S ribosomal DNA in feces from SPF mice, GF mice, GF mice reconstituted by fecal transplantation (GF-FT), and antibiotics-treated GF mice (GF-ABX; n = 5,5,5,4 mice). e, Numbers of total circulating neutrophils in SPF, GF, GF-FT, and GF-ABX mice (n = 5,5,5,3 mice). Error bars, mean ± s.e.m. * P < 0.05, ** P < 0.01, *** P < 0.001, data representing ≥2 independent experiments analysed with unpaired Student’s t-test.
Extended Data Figure 5
Extended Data Figure 5. Microbiota-driven neutrophil ageing is independent of clearance mechanisms, and mediated by TLRs and Myd88 signalling
a, Adhesion molecule expression on endothelial cells in control and antibiotics (ABX)-treated mice (n = 4 mice). b, Numbers of spleen, and liver macrophages in control and ABX-treated mice (left, n = 7 mice; right, n = 4 mice). c–d, Numbers of BM macrophages (c; n = 19,19,10,10 mice) and circulating aged neutrophils (d; n = 12,11,10,9 mice) in diphtheria toxin (DT)-treated control, ABX-treated mice, CD169-DTR, and ABX-treated CD169-DTR mice. e, Flow cytometry analysis of aged neutrophils in WT and LysM-cre/Myd88fl/fl mice (n = 12,10 mice). f, Percentages of aged neutrophils in WT, Tlr4−/− and Tlr2−/− mice (n = 10,10,12 mice). g, Flow cytometry analysis of aged neutrophils in WT and Tnf−/− or Csf2−/− mice. h, Percentages of WT and LysM-cre/Myd88fl/fl or Tlr4−/− or Tlr2−/− neutrophils in total leukocyte population in chimeric mice (n = 5 mice). i, Percentages of WT and LysM-cre/Myd88fl/fl or Tlr4−/− or Tlr2−/− neutrophils that capture > 8 beads in chimeric mice (n = 5 mice). Error bars, mean ± s.e.m. * P < 0.05, ** P < 0.01, *** P < 0.001, data representing ≥2 independent experiments analysed with unpaired Student’s t-test (a–f) or paired Student’s t-test (h, i).
Extended Data Figure 6
Extended Data Figure 6. Microbiota depletion inhibits NET formation
a, Flow cytometry analysis of aged neutrophils in isotype and anti-P/E-selectin antibody-treated mice (n = 6,5 mice). b, ROS production of neutrophils from isotype and anti-P/E-selectin antibody-treated mice, as analysed by flow cytometry using Dihydrorhodamine 123 (DHR-123; Isotype: n = 10; Abs (P/E): n = 11 mice). Grey lines, background fluorescence of neutrophils from both groups without LPS stimulation. c, LPS-induced NET formation of neutrophils from control and antibiotics (ABX)-treated mice, as analysed by immunofluorescence staining of DNA (sytox orange), neutrophil elastase (NE) and citrullinated histone 3 (CitH3). Inset, isotype control. Scale bars, 10 μm. d, Quantification of NET formation of neutrophils from isotype and anti-P/E-selectin antibody-treated mice, or from control and ABX-treated mice (left, n = 4,5 mice; right, n = 4 mice). Error bars, mean ± s.e.m. * P < 0.05, ** P < 0.01, *** P < 0.001, data representing ≥2 independent experiments analysed with unpaired Student’s t-test.
Extended Data Figure 7
Extended Data Figure 7. Microbiota depletion benefits endotoxin-induced septic shock
a, Representative images and quantification of in vivo NET formation in liver vasculature of control and antibiotics (ABX)-treated mice challenged with 30mg/kg LPS (n = 3,4 mice). Scale bar, 10 μm. b, Quantification of NET biomarkers, plasma nucleosome and DNA, in septic control and ABX-treated animals (n = 4 mice). c–d, Representative images showing CitH3+ neutrophil aggregates (c) and fibrin deposition associated with neutrophil aggregates (d) in septic liver of control and ABX-treated mice. Arrows, diffusive CitH3 and NE proteins. Insets, isotype controls. Scale bars, 10 μm. e–f, Numbers of CitH3+ neutrophils and neutrophil aggregates (e; left: n = 4 mice; right: n = 40 vessels from 4 mice) and quantification of fibrin deposition (f; n = 4,3 mice) in septic liver of control and ABX-treated mice. g, Survival time of control, ABX-treated mice, and ABX-treated mice infused with 2×10⁶ aged or young neutrophils in septic shock induced by 30mg/kg LPS (n = 16,10,13,6 mice). Error bars, mean ± s.e.m. * P < 0.05, ** P < 0.01, data representing ≥2 independent experiments analysed with unpaired Student’s t-test (a, e(left), f), Mann-Whitney test (b, e(right)) or Log-rank test (g).
Extended Data Figure 8
Extended Data Figure 8. Microbiota depletion affects disease progression in sickle cell disease
a, Numbers of circulating leukocyte subsets in hemizygous control (SA), control SCD (SS Ctrl) and antibiotics-treated SCD (SS ABX) mice (SA: n = 8 mice; SS Ctrl: n = 9 mice; SS ABX: n = 9 mice). b, Hemodynamic parameters of mice analysed for neutrophil adhesion and integrin activation. c, Percentages of adherent neutrophils that capture > 8 beads in SA, SS Ctrl and SS ABX mice (n = 4,3,3 mice). d, Correlation between the survival times of SS ctrl and SS ABX mice in acute vaso-occlusive crisis and their spleen weights. R square = 0.45. e, Scoring of liver damage, liver fibrosis, inflammation and necrosis in SS Ctrl and SS ABX (n = 8,9 mice). f, Flow cytometry analysis of aged neutrophils in healthy controls, SCD patients (SS), and SCD patients on penicillin V prophylaxis (SS-PV). g, Demographics of human subjects analysed for aged neutrophil numbers. h, Aged neutrophil numbers in SCD patients grouped by age, gender, hydroxyurea (HU) and penicillin V (Pen V) treatment (Ctrl: n = 9 subjects; SS: n = 23 subjects; SS-PV: n = 11 subjects). Error bars, mean ± s.e.m. * P < 0.05, ** P < 0.01, *** P < 0.001, data representing ≥2 independent experiments analysed with unpaired Student’s t-test (a, c, h) or Mann-Whitney test (e).
Figure 1
Figure 1. Aged neutrophils represent an overly active subset of neutrophils
a, Multi-channel fluorescence intravital microscopy (MFIM) analysis of CD62L expression (red) and Mac-1 specific albumin-coated fluorescent microsphere beads (green) captured by adherent neutrophils (dashed lines). Left, fluorescence channel; right, fluorescence combined with brightfield channels. Scale bar, 10 μm. b, Correlation between CD62L expression and bead capture or neutrophil-RBC interaction (n = 126 cells from 3 mice). c–d, Flow cytometry analysis of CD62LloCXCR4hi aged neutrophils and MFIM analysis of Mac-1 activation on neutrophils from WT and Selp−/− mice (c; middle: n = 5,6 mice; right: n = 3,4 mice), or in diphtheria toxin (DT)-treated WT and CD169-DTR mice (d; middle: n = 7 mice; right: n = 8 mice). e, Heat map of normalised enrichment scores (NES) for selected pathways in aged and TNF-α activated neutrophils, as compared to control neutrophils (n = 3 mice). Red, up-regulation; blue, down-regulation. f–g, Cxcl2, Itgam, and Tlr4 mRNA expression levels by Q-PCR in control and aged neutrophils (f; left: n = 5,6 mice; middle: n = 6,4 mice; right: n = 6,5 mice), and surface expression levels of TLR4 and selected adhesion molecules by flow cytometry on CD62Llo aged and CD62Lhi young neutrophils (g; left: n = 5 mice; right: n = 4 mice). Error bars, mean ± s.e.m. * P < 0.05, ** P < 0.01, *** P < 0.001, data representing ≥2 independent experiments analysed with one-way ANOVA (b) or unpaired Student’s t-test (c, d, f, g).
Figure 2
Figure 2. Neutrophil ageing is driven by the microbiota
a, Flow cytometry analysis of aged neutrophils in control, antibiotics (ABX)-treated mice and ABX-treated mice fed with LPS (n = 12,7,5 mice). b, Numbers of aged neutrophils in specific pathogen free (SPF) mice, Germ-free (GF) mice, GF mice reconstituted by fecal transplantation (GF-FT), and GF mice treated with antibiotics (GF-ABX; n = 5,5,5,3 mice). c, Ageing kinetics of donor neutrophils after adoptive transfer into control, ABX-treated or GF recipients (n = 4 mice). d, EdU pulse-chase analysis of neutrophil release-clearance kinetics in control and ABX-treated mice (Ctrl: n = 5,5,6,8,5 mice; ABX: n = 5,5,5,6,6 mice for day 3,4,5,6,7). e–g, Representative images (e) and quantification of neutrophil adhesion (dotted lines; f) and Mac-1 activation on adherent neutrophils (g) in control and ABX-treated mice (n = 4 mice). Scale bar, 10 μm. Error bars, mean ± s.e.m. * P < 0.05, ** P < 0.01, *** P < 0.001, data representing ≥2 independent experiments analysed with unpaired Student’s t-test.
Figure 3
Figure 3. Microbiota-driven neutrophil ageing is mediated by neutrophil TLRs and Myd88 signalling
a, Percentages of aged neutrophils in WT and LysM-cre/Myd88fl/fl mice, as analysed by flow cytometry (n = 12,10 mice). b, Percentages of aged neutrophils in WT and Tnf−/− or Csf2−/− mice (n = 5 mice). c, Ageing kinetics of donor neutrophils after adoptive transfer from either WT or LysM-cre/Myd88fl/fl mice into WT or LysM-cre/Myd88fl/fl recipients (n = 6 mice). d, Percentages of the aged subset in WT and LysM-cre/Myd88fl/fl, Tlr4−/− or Tlr2−/− neutrophils in chimeric mice (n = 5 mice). e, MFIM analysis of Mac-1 activation on WT and LysM-cre/Myd88fl/fl, Tlr4−/− or Tlr2−/− neutrophils in chimeric mice (n = 5 mice). f, Representative images showing WT (CD45.1+, blue) and Tlr4−/− (CD45.2+, red) neutrophils and beads (green) captured. Scale bar, 10 μm. Error bars, mean ± s.e.m. * P < 0.05, ** P < 0.01, *** P < 0.001, data representing ≥2 independent experiments analysed with unpaired Student’s t-test (a–c) or paired Student’s t-test (d–e).
Figure 4
Figure 4. Microbiota depletion reduces vaso-occlusive events in sickle cell disease
a, Flow cytometry analysis of aged neutrophils in hemizygous control (SA), control SCD (SS Ctrl) and antibiotics-treated SCD (SS ABX) mice (n = 8,9,9 mice). b, MFIM analysis of neutrophil adhesion and Mac-1 activation on adherent neutrophils in SA, SS Ctrl and SS ABX mice (n = 6,8,10 mice). Scale bar, 10 μm. c, Mac-1 activation on adherent neutrophils and neutrophil-RBC interaction in SA, SS Ctrl and SS ABX mice (left, n = 4,3,3 mice; right, n = 69,42,54 vessels from 6,7,7 mice). d, Blood flow and survival time of SS Ctrl and SS ABX mice in acute vaso-occlusive crisis (left, n = 36,48 vessels from 7,8 mice; right, n = 6 mice). e, Representative images and weights of spleen in SS Ctrl and SS ABX mice (n = 6 mice). f, Hematoxylin and eosin (H&E) staining showing liver damage in SS Ctrl and SS ABX mice. Arrow, liver fibrosis; arrowheads, necrosis and inflammation. Scale bars, 50 μm. g, Survival time of SS mice treated with PBS- or clodronate-encapsulated liposome (n = 7,8 mice). h, Numbers of total and aged neutrophils in healthy controls, SCD patients (SS), and SCD patients on penicillin V prophylaxis (SS-PV; n = 9,23,11 subjects). Error bars, mean ± s.e.m. * P < 0.05, ** P < 0.01, *** P < 0.001, data representing ≥2 independent experiments analysed with unpaired Student’s t-test (a–d(left), e, h) or Log-rank test (d(right), g).

Comment in

References

    1. Nauseef WM, Borregaard N. Neutrophils at work. Nature immunology. 2014;15:602–611. - PubMed
    1. Mayadas TN, Cullere X, Lowell CA. The multifaceted functions of neutrophils. Annual review of pathology. 2014;9:181–218. - PMC - PubMed
    1. Taylor PR, et al. Activation of neutrophils by autocrine IL-17A-IL-17RC interactions during fungal infection is regulated by IL-6, IL-23, RORgammat and dectin-2. Nature immunology. 2014;15:143–151. - PMC - PubMed
    1. Woodfin A, et al. The junctional adhesion molecule JAM-C regulates polarized transendothelial migration of neutrophils in vivo. Nature immunology. 2011;12:761–769. - PMC - PubMed
    1. Casanova-Acebes M, et al. Rhythmic Modulation of the Hematopoietic Niche through Neutrophil Clearance. Cell. 2013;153:1025–1035. - PMC - PubMed

Publication types

MeSH terms

Associated data