. 2015 Nov 12;527(7577):192-7.
doi: 10.1038/nature15521. Epub 2015 Sep 16.

BCL11A enhancer dissection by Cas9-mediated in situ saturating mutagenesis

Affiliations

BCL11A enhancer dissection by Cas9-mediated in situ saturating mutagenesis

Matthew C Canver et al. Nature. .

Abstract

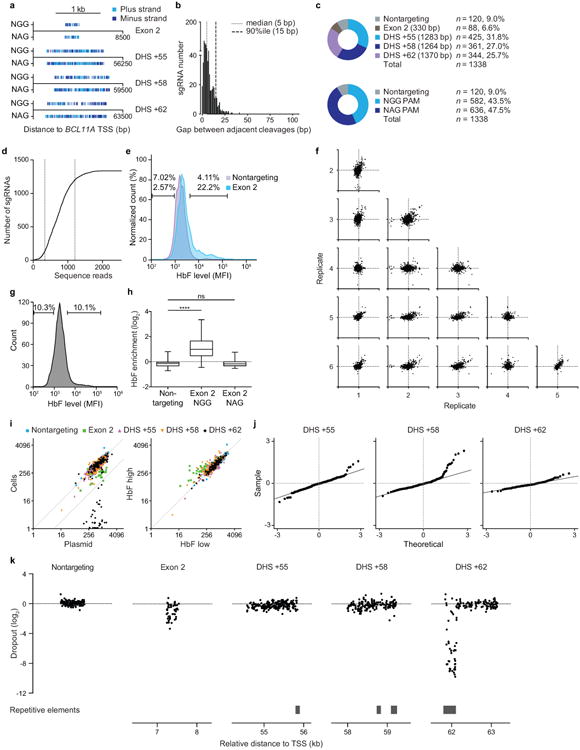
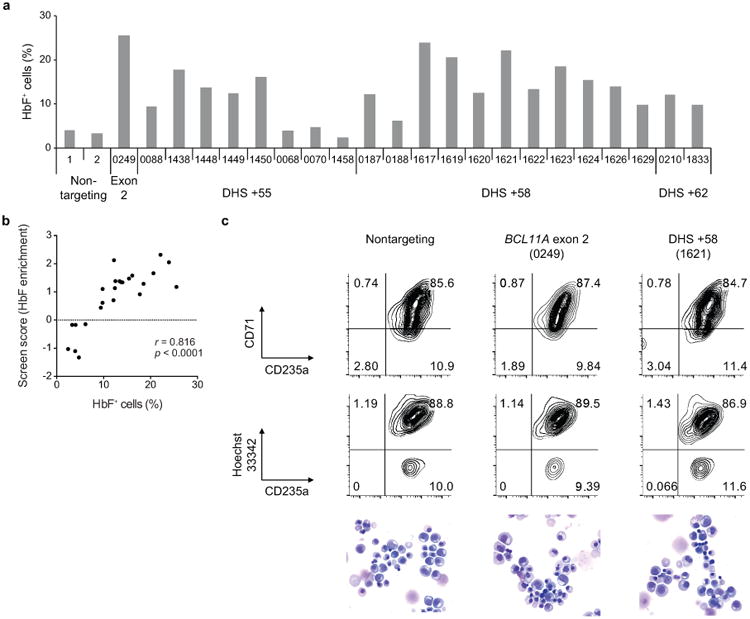
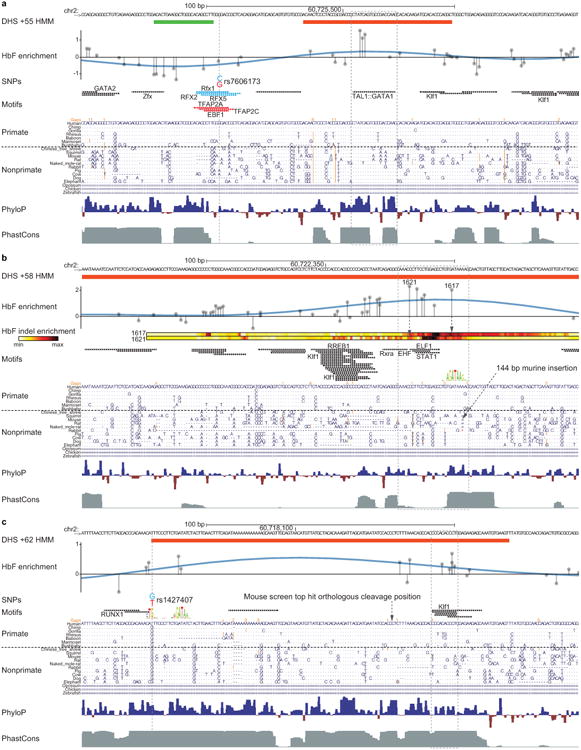
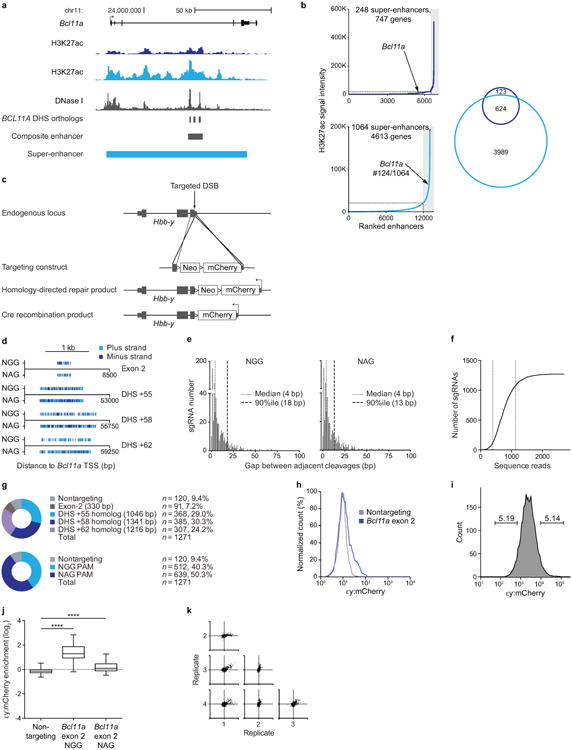
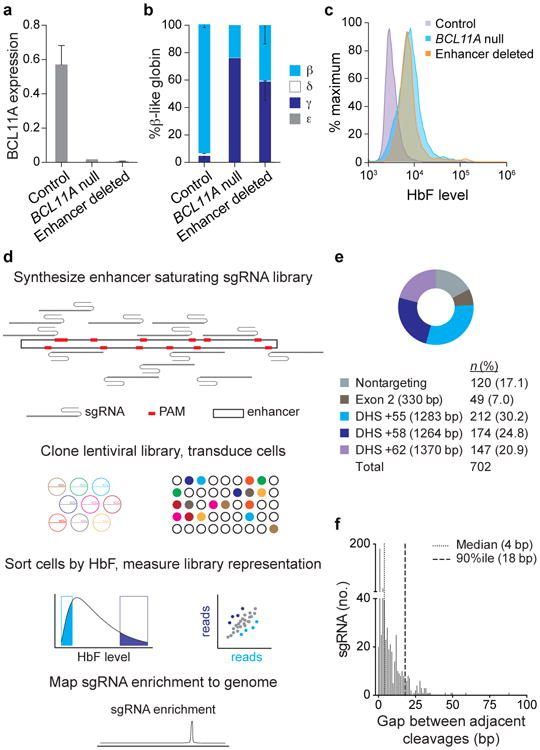
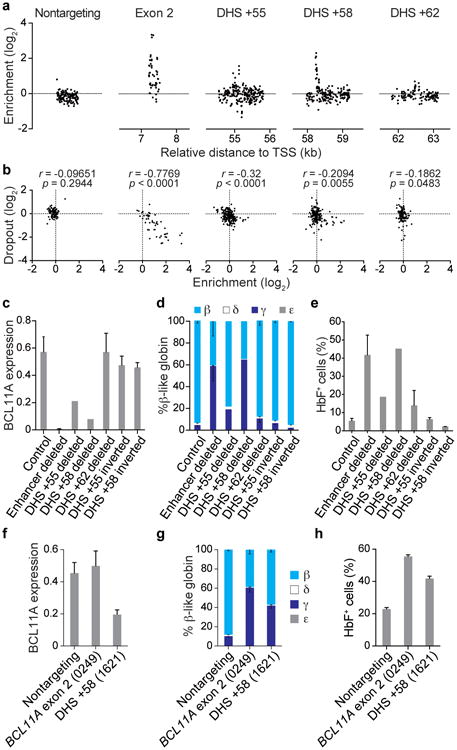
Enhancers, critical determinants of cellular identity, are commonly recognized by correlative chromatin marks and gain-of-function potential, although only loss-of-function studies can demonstrate their requirement in the native genomic context. Previously, we identified an erythroid enhancer of human BCL11A, subject to common genetic variation associated with the fetal haemoglobin level, the mouse orthologue of which is necessary for erythroid BCL11A expression. Here we develop pooled clustered regularly interspaced palindromic repeat (CRISPR)-Cas9 guide RNA libraries to perform in situ saturating mutagenesis of the human and mouse enhancers. This approach reveals critical minimal features and discrete vulnerabilities of these enhancers. Despite conserved function of the composite enhancers, their architecture diverges. The crucial human sequences appear to be primate-specific. Through editing of primary human progenitors and mouse transgenesis, we validate the BCL11A erythroid enhancer as a target for fetal haemoglobin reinduction. The detailed enhancer map will inform therapeutic genome editing, and the screening approach described here is generally applicable to functional interrogation of non-coding genomic elements.


Figures

Extended Data Figure 1
Extended Data Figure 1. Human BCL11A locus
a, Schematic of the human BCL11A locus (hg19, transcription from right to left) with erythroid chromatin marks and trait-associated haplotype denoted, and composite enhancer as previously defined. b, Ranked enhancers in primary human adult erythroid precursors by H3K27ac signal intensity, with super-enhancers shaded, and super-enhancer associated genes indicated.
Extended Data Figure 2
Extended Data Figure 2. Tiled pooled in situ CRISPR-Cas9 BCL11A enhancer screen
a, Distribution of NGG and NAG PAM sgRNAs mapped to genomic cleavage position. The vertical lines represent cleavage sites for sgRNAs mapped to plus and minus strands. b, Gap distance between adjacent genomic cleavage position for NAG PAM sgRNAs. c, Library composition by target sequence and PAM restriction. d. Representation of both NGG and NAG sgRNA (1,338 sgRNAs in total) within the plasmid pool by deep-sequencing. The median was 718 normalized reads and the 10th and 90th percentiles (indicated by the vertical dotted lines) ranged from 337 to 1,205 normalized reads. e, HbF distribution in HUDEP-2 cells transduced with Cas9 and individual sgRNAs, either nontargeting or targeting BCL11A exon 2. f, HbF enrichment scores of NGG sgRNAs in six biological replicates. g, Sort of library-transduced cells into HbF-high and HbF-low pools. h, Control sgRNA enrichment. Boxes demonstrate 25th, median, and 75th percentiles and whiskers minimum and maximum values. **** P < 0.0001, ns non-significant. i, NGG sgRNA representation in plasmid pool and cells at conclusion of experiment (left), and in HbF-high and HbF-low pools (right), with dotted lines at x=y and x=8y. j, Quantile-quantile plots of NGG sgRNA enrichment scores. k, Cellular dropout scores of NGG sgRNAs relative to genomic cleavage position and repetitive elements. Nontargeting sgRNAs pseudo-mapped with 5 bp spacing.
Extended Data Figure 3
Extended Data Figure 3. Validation of enhancer screen
a, HbF+ fraction in HUDEP-2 cells transduced in arrayed format with 24 sgRNAs from all 5 mapping categories with enrichment scores ranging from the highest to the lowest in the screen. b, Correlation between HbF enrichment score from pooled sgRNA screen and HbF+ fraction by arrayed validation of individual sgRNAs in HUDEP-2 cells. c, Erythroid differentiation of primary human erythroid precursors evaluated by CD71 and CD235a surface markers, enucleation frequency (CD235a+ Hoescht33342-), and morphology by May-Grünwald-Giemsa staining.
Extended Data Figure 4
Extended Data Figure 4. Functional assessment of enhancer sequences
a, Topology of the Hidden Markov model (HMM) used to infer the three functional enhancer states (Active, Repressive, and Neutral). The emission probabilities of HbF enrichment scores from each state were modeled as Gaussian distributions (the values of μ and σ2 are shown). The transition probabilities (arrows) are displayed. b, Frequency distribution of indels from HUDEP-2 cells exposed to Cas9 and individual sgRNAs, sorted into HbF-high and -low pools, and subjected to deep sequencing of the target site. Indels calculated on a per nucleotide basis throughout an amplicon surrounding the sgRNA-1617 and -1621 cleavage sites (dotted lines). An indel enrichment ratio was calculated by dividing normalized indel frequencies in the HbF-high pool by those in the HbF-low pool.
Extended Data Figure 5
Extended Data Figure 5. Functional cores of the BCL11A enhancer
a-c, 200 bps at the functional cores of DHSs h+55, h+58, and h+62 defined by HMM states (Active red, Repressive green). HbF enrichment scores shown by gray lines and circles. HbF indel enrichment per nucleotide based on amplicon genomic sequencing of sorted cells exposed to either sgRNA-1617 (top) or -1621 (bottom). Common SNPs (MAF>1%) shown with dotted lines with HbF-low allele in blue and HbF-high allele in red; no common SNPs present at h+58 region. JASPAR motifs (P < 10-4) depicted in black except for those with allele-specific significance depicted by allelic color. Selected motifs annotated by TF based on known erythroid-specific function or genomic position. Motif LOGOs at key positions with motif scores P < 10-3 as described in text. Dotted boxes show regions of highest HbF enrichment score at each core with underlying predicted motifs. Orthologous sequences listed from representative primates and nonprimates of distributed phylogeny. PhyloP (scale from -4.5 to 4.88) and PhastCons (from 0 to 1) estimates of evolutionary conservation among 100 vertebrates. An arrow indicates a 144 bp insertion in the mouse genome relative to the human reference adjacent to the orthologous GATA1 motif at h+58.
Extended Data Figure 6
Extended Data Figure 6. Tiled pooled in situ CRISPR-Cas9 Bcl11a enhancer screen
a, Schematic of the mouse Bcl11a locus (mm9, transcription from left to right) with erythroid chromatin marks (top, dark blue H3K27ac from Kowalczyk et al, middle, light blue H3K27ac from Dogan et al, and bottom, black DNase I from Bauer et al) and regions of primary sequence homology to the human DHSs displayed. Y-axes for H3K27ac tracks are both scaled to maximum 3.5 reads per million. Composite enhancer as previously defined. b, Ranked enhancers in mouse erythroid precursors by H3K27ac signal intensity,, with super-enhancers shaded. Super-enhancer associated genes indicated by Venn diagram. c, Strategy to knock-in by homology-directed repair the fluorescent protein mCherry into the mouse embryonic globin Hbb-y locus (encoding the εy embryonic globin chain). d, Distribution of NGG and NAG PAM sgRNAs mapped to genomic cleavage position with vertical lines representing cleavage sites for sgRNAs mapped to plus and minus strands. e, Distance to adjacent genomic cleavage position for NGG (left) and NAG (right) PAM sgRNAs. f, Representation of the 1,271 NGG and NAG sgRNAs within the plasmid pool by deep-sequencing. The median was 735 normalized reads and the 10th and 90th percentiles (indicated by the vertical dotted lines) ranged from 393 to 1,240 normalized reads. g, Library composition by target sequence and PAM restriction. h, mCherry expression upon exposure to Cas9 and an individual NGG sgRNA targeting Bcl11a exon 2 in MEL εy:mCherry reporter cells. i, εy:mCherry sort of library transduced cells. j, Control sgRNA enrichment. Boxes demonstrate 25th, median, and 75th percentiles and whiskers minimum and maximum values. **** P < 0.0001. k, Enrichment scores of NGG sgRNAs between four biological replicates.
Extended Data Figure 7
Extended Data Figure 7. Bcl11a enhancer screen analyses
a, NGG sgRNA representation in plasmid pool and cells at conclusion of experiment (left), and in εy:mCherry-high and εy:mCherry-low pools (right), with dotted lines at x=y and x=8y. b, Quantile-quantile plots of NGG sgRNA εy enrichment scores. c, Cellular dropout scores of NGG sgRNAs relative to genomic cleavage position and repetitive elements. Nontargeting sgRNAs pseudo-mapped with 5 bp spacing. d, Correlation between cellular dropout and εy enrichment scores.
Extended Data Figure 8
Extended Data Figure 8. Functional sequences at the Bcl11a erythroid enhancer
a-c, HMM segmentation of active functional states at m+55, m+58, and m+62 orthologs. HbF enrichment scores shown as gray lines and circles with blue line representing smoothed enrichment score. DNase I sequencing from mouse fetal liver erythroid precursors. PhyloP (scale from -3.3 to 2.1) and PhastCons (from 0 to 1) estimates of evolutionary conservation among 30 vertebrates. d, Top, BCL11A expression determined by RT-qPCR displayed as a heatmap in 108 hemizygous m+62 ortholog deletion clones ordered by genomic position of deletion midpoint. Each bar demonstrates the genomic position of the deletion breakpoints and the associated color demonstrates the level of BCL11A expression. Bottom, BCL11A expression determined by RT-qPCR in 108 hemizygous m+62 ortholog deletion clones. Per nucleotide mean effect size was calculated as the mean fold change in BCL11A expression from all clones in which that nucleotide was deleted. Gray shading represents one s.d. The BCL11A expression data are shown with same x-axis as in Extended Data Fig. 8c immediately above.
Extended Data Figure 9
Extended Data Figure 9. Evaluation of the m+62 functional core
200 bp at the functional core of the m+62 ortholog defined by HMM state. Enrichment scores shown as gray lines and circles with blue line representing smoothed enrichment score. JASPAR motifs (P < 10-4) depicted with selected motifs annotated by TF name based on known erythroid-specific function or genomic position. Orthologous human sequences listed. PhyloP (scale from -3.3 to 2.1) and PhastCons (from 0 to 1) estimates of evolutionary conservation among 30 vertebrates. Individual numbered hemizygous deletion clones with indicated breakpoints were evaluated by BCL11A immunoblot (C, control). Clones 9 and 10 encompass the entire m+62 ortholog.
Extended Data Figure 10
Extended Data Figure 10. Requirement of Bcl11a erythroid enhancer during murine ontogeny
a, Progeny of heterozygous Bcl11a m+62 ortholog deletion intercrosses as compared to expected Mendelian ratio. b, Fraction of fetal liver comprised of B cell progenitors at E16.5 from various genotypes. c, Peripheral blood analysis from 4 week old mice to examine the frequency of various circulating hematopoietic lineages in Bcl11a m+62 ortholog deletion wild-type, heterozygous, and homozygous mice. d, BCL11A expression in β-YAC/+62 deletion mice (each symbol represents the mean expression from technical replicates from an individual mouse). * P < 0.05, error bars represent s.e.m.
Figure 1
Figure 1. Tiled pooled in situ CRISPR-Cas9 BCL11A enhancer screen
a-c, Deletion of the human composite BCL11A enhancer in HUDEP-2 cells demonstrates its necessity for BCL11A expression (normalized to GAPDH), repression of γ-globin mRNA, and repression of HbF; control clones, n = 4; BCL11A null, n = 1; enhancer deleted, n = 3; error bars show s.e.m. d, Workflow of CRISPR-Cas9 enhancer screen showing library synthesis, delivery, and analysis. e, Human NGG PAM sgRNA library distribution. f, Gaps between adjacent genomic cleavages for NGG PAM sgRNAs targeting BCL11A exon-2, h+55, h+58, and h+62.
Figure 2
Figure 2. Functional mapping of the BCL11A enhancer
a, Mapping sgRNA HbF enrichment scores relative to genomic cleavage positions. Nontargeting sgRNAs pseudo-mapped with 5 bp spacing. b, Correlation between cellular dropout and HbF enrichment scores. c-e, BCL11A expression normalized to GAPDH, β-like globin expression, and HbF+ fraction in HUDEP-2 cells with deletion or inversion of individual DHSs; control clones, n = 4; enhancer deleted, n = 3; +55 deleted, n = 1; +58 deleted, n = 1; +62 deleted, n = 5; +55 inverted, n = 3; +58 inverted, n = 2. f-h, BCL11A expression normalized to GAPDH, β-like globin expression, and HbF+ fraction in primary human erythroid precursors transduced with Cas9 and individual sgRNAs; n = 3. Error bars represent s.e.m. (c, d, f, g) or s.d. (e, h).
Figure 3
Figure 3. Inferred functional enhancer states relative to genomic features
a-c, Hidden Markov model segmentation of functional enhancer states. HbF enrichment scores shown throughout DHSs h+55, h+58, h+62 by gray lines and circles with blue line representing smoothed enrichment score. DNase I sequencing from primary human erythroblasts. PhyloP (scale from -4.5 to 4.88) and PhastCons (from 0 to 1) estimates of evolutionary conservation among 100 vertebrates. Positions of SNPs rs7606173 and rs1427407 denoted which together define the haplotype most highly associated to HbF level.
Figure 4
Figure 4. Primate-specific BCL11A enhancer functional core
DHS h+58 functional core defined by maximal HbF enrichment score and Active HMM state. HbF enrichment scores shown by gray lines and circles. HbF indel enrichment per nucleotide based on amplicon genomic sequencing of sorted cells exposed to either sgRNA-1617 or -1621. No common SNPs (MAF>1%) present at this region. JASPAR motifs (P < 10-4) depicted in black with selected motifs annotated by TF based on known erythroid-specific function or genomic position. Gata1 motif LOGO at sgRNA-1617 cleavage position as described in text. Orthologous sequences listed from representative primates and nonprimates of distributed phylogeny. PhyloP (scale from -4.5 to 4.88) and PhastCons (from 0 to 1) estimates of evolutionary conservation among 100 vertebrates.
Figure 5
Figure 5. Functional sequence requirement at the mouse Bcl11a erythroid enhancer for in vivo hemoglobin switching
a, Mapping sgRNA εy enrichment scores to genomic cleavage positions. Nontargeting sgRNAs pseudo-mapped with 5 bp spacing. b, BCL11A expression in mouse erythroid clones with deletion or inversion of individual DHSs relative to nondeleted controls. c, Transgenic human β-like globin expression in β-YAC/+62 deletion mice. For +/+, +/Δ, and Δ/Δ: at E12.5, n = 5, 11, and 3 embryos respectively; at E14.5, n = 2, 3, and 4; at E16.5, n = 2, 4, and 1; at E18.5, n = 3, 1, and 3. Error bars represent s.e.m.

References

    1. Banerji J, Rusconi S, Schaffner W. Expression of a β-globin gene is enhanced by remote SV40 DNA sequences. Cell. 1981;27:299–308. - PubMed
    1. Visel A, et al. ChIP-seq accurately predicts tissue-specific activity of enhancers. Nature. 2009;457:854–858. - PMC - PubMed
    1. Thurman RE, et al. The accessible chromatin landscape of the human genome. Nature. 2012;488:75–82. - PMC - PubMed
    1. Andersson R, et al. An atlas of active enhancers across human cell types and tissues. Nature. 2014;507:455–61. - PMC - PubMed
    1. Heintzman ND, et al. Histone modifications at human enhancers reflect global cell-type-specific gene expression. Nature. 2009;459:108–112. - PMC - PubMed

Publication types

MeSH terms