

Characterisation and imaging of cortical impedance changes during interictal and ictal activity in the anaesthetised rat
- PMID: 26375207
- PMCID: PMC4655942
- DOI: 10.1016/j.neuroimage.2015.09.015
Characterisation and imaging of cortical impedance changes during interictal and ictal activity in the anaesthetised rat
Abstract
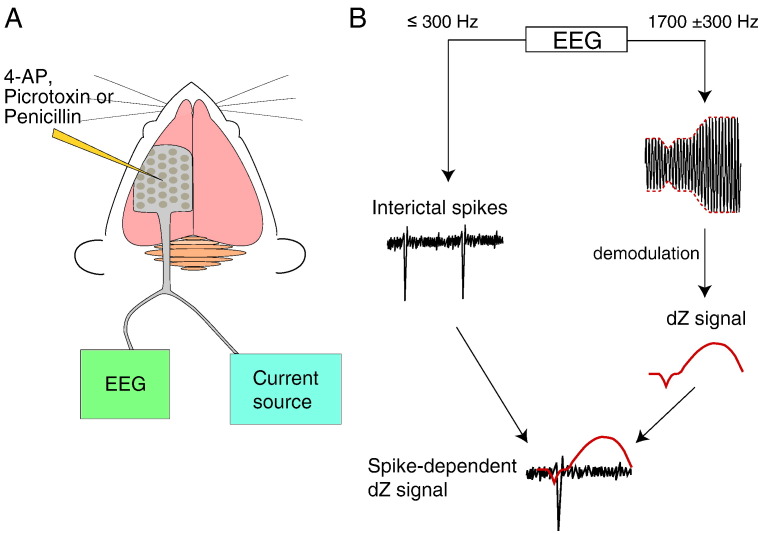
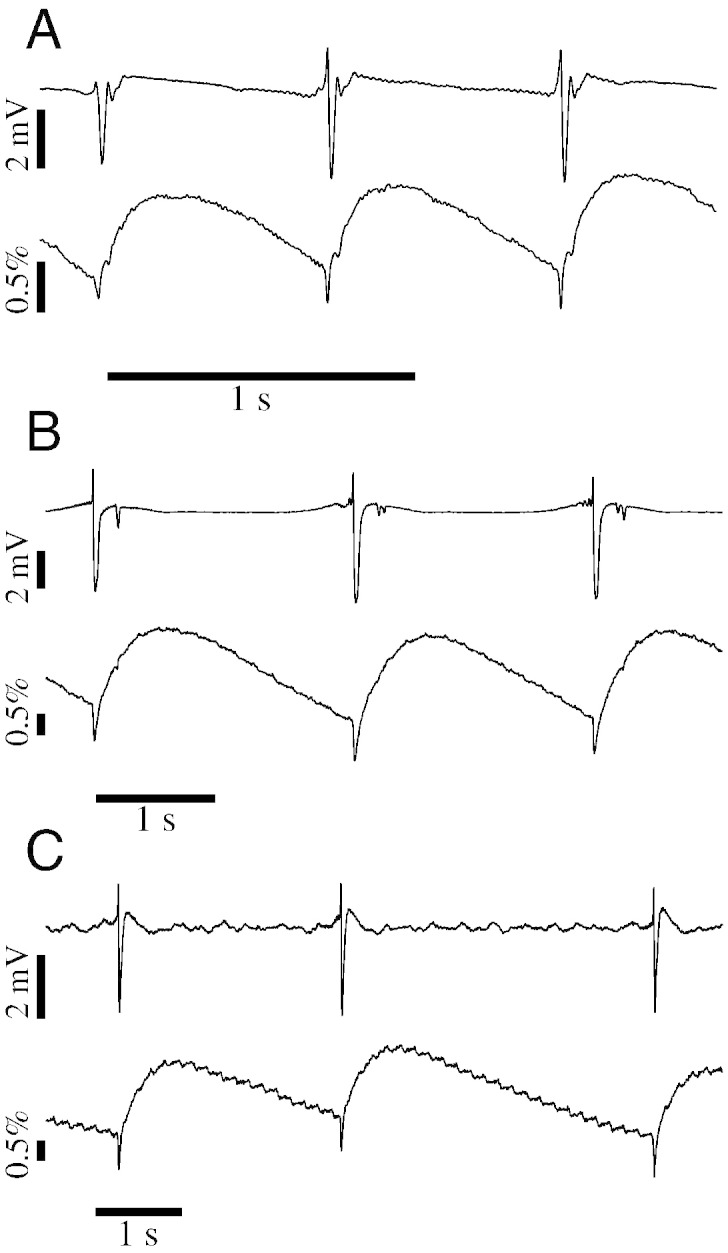
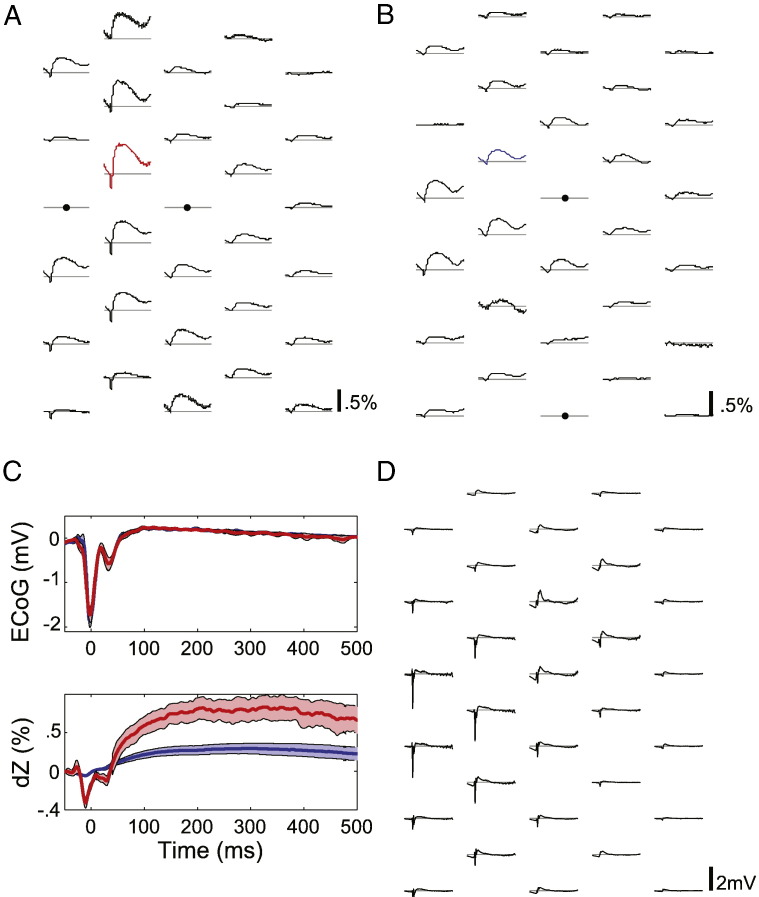
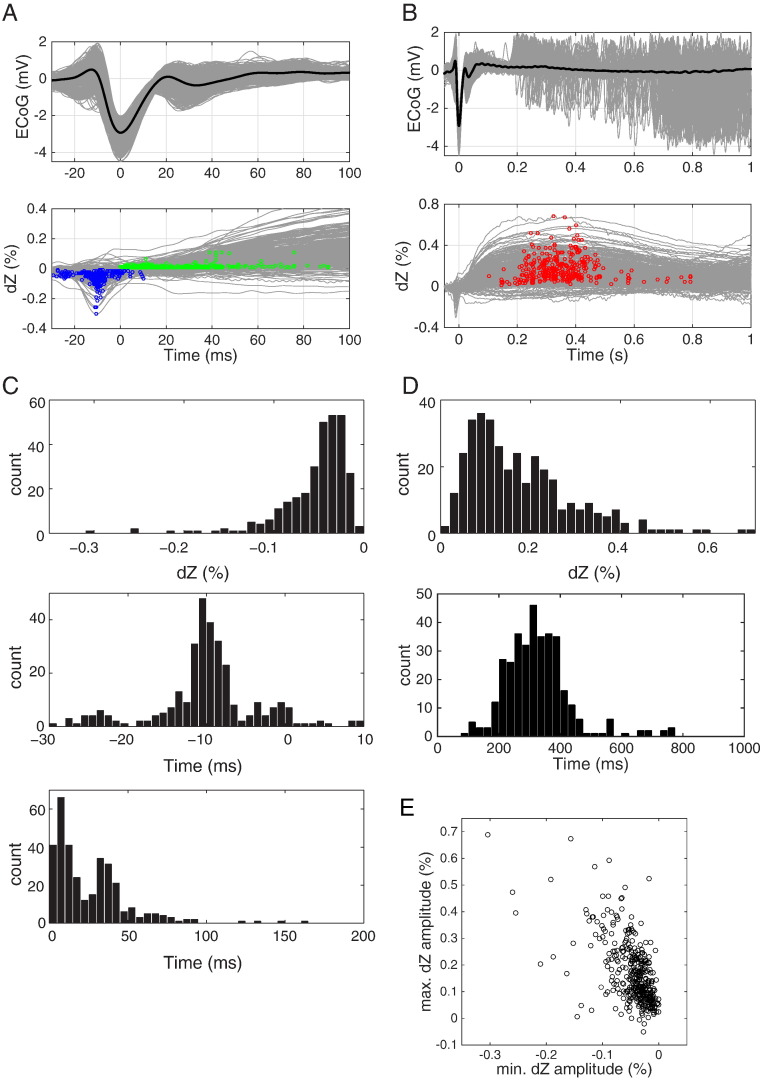
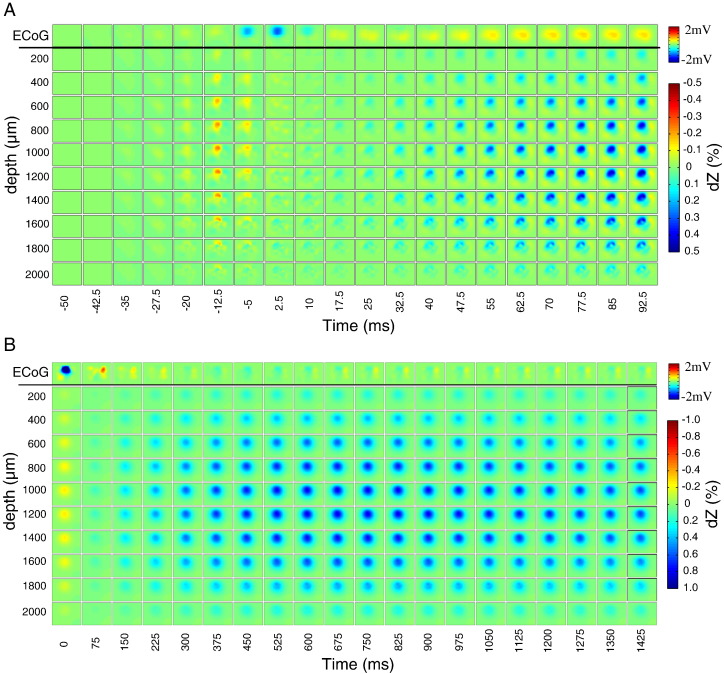
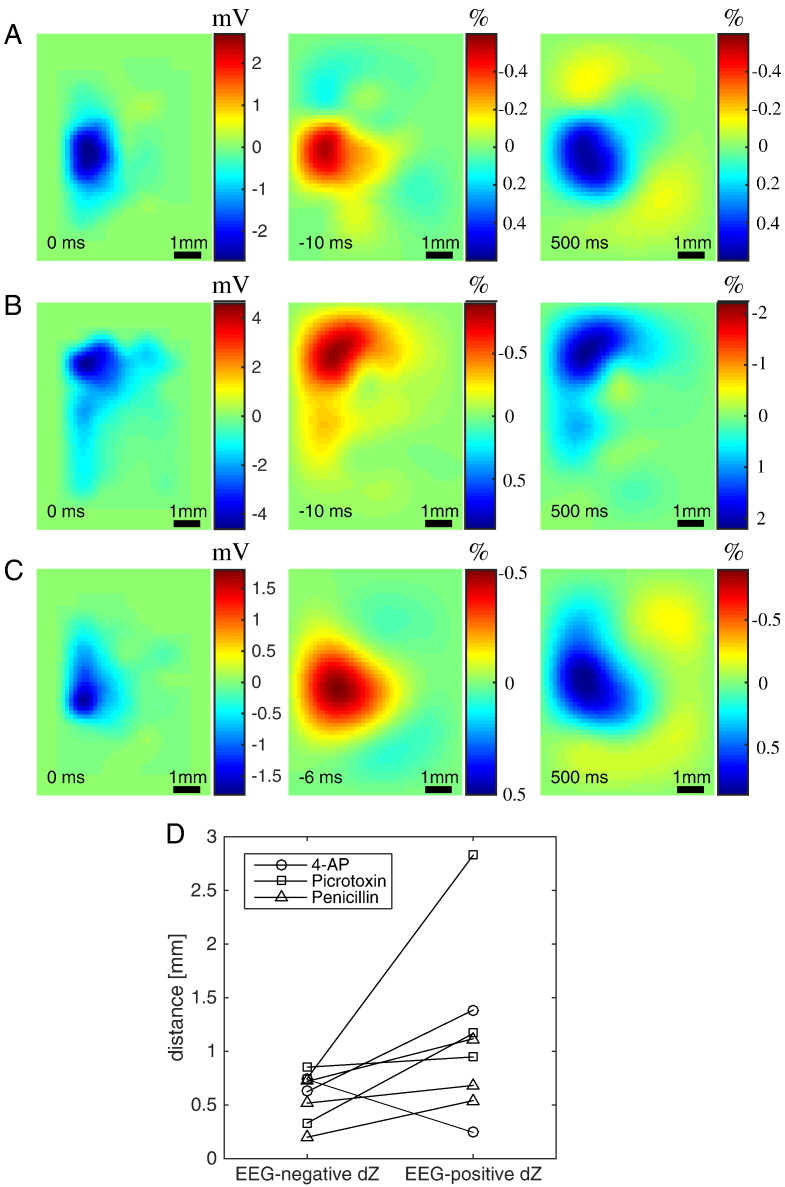
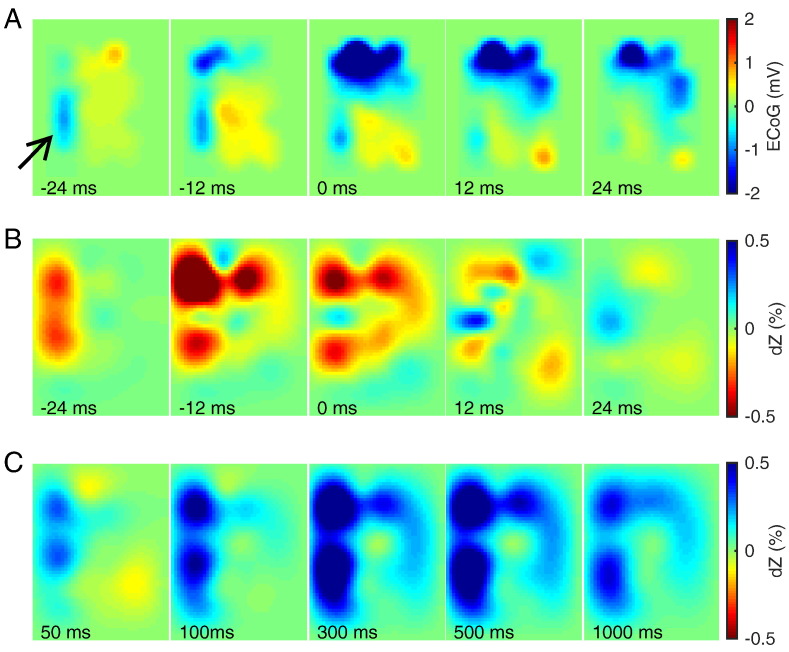
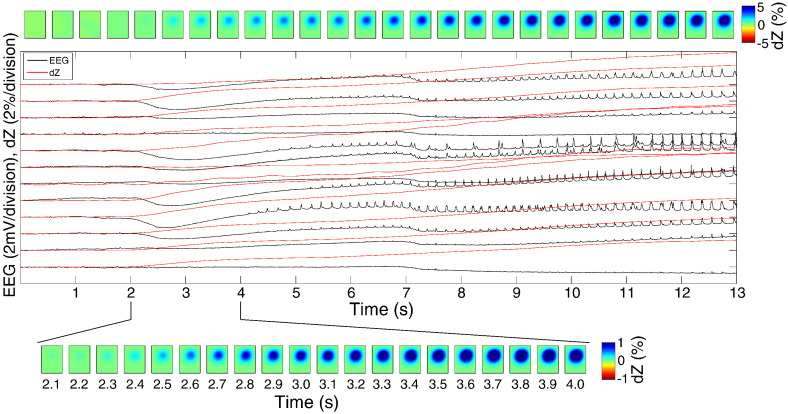
Epilepsy affects approximately 50 million people worldwide, and 20-30% of these cases are refractory to antiepileptic drugs. Many patients with intractable epilepsy can benefit from surgical resection of the tissue generating the seizures; however, difficulty in precisely localising seizure foci has limited the number of patients undergoing surgery as well as potentially lowered its effectiveness. Here we demonstrate a novel imaging method for monitoring rapid changes in cerebral tissue impedance occurring during interictal and ictal activity, and show that it can reveal the propagation of pathological activity in the cortex. Cortical impedance was recorded simultaneously to ECoG using a 30-contact electrode mat placed on the exposed cortex of anaesthetised rats, in which interictal spikes (IISs) and seizures were induced by cortical injection of 4-aminopyridine (4-AP), picrotoxin or penicillin. We characterised the tissue impedance responses during IISs and seizures, and imaged these responses in the cortex using Electrical Impedance Tomography (EIT). We found a fast, transient drop in impedance occurring as early as 12ms prior to the IISs, followed by a steep rise in impedance within ~120ms of the IIS. EIT images of these impedance changes showed that they were co-localised and centred at a depth of 1mm in the cortex, and that they closely followed the activity propagation observed in the surface ECoG signals. The fast, pre-IIS impedance drop most likely reflects synchronised depolarisation in a localised network of neurons, and the post-IIS impedance increase reflects the subsequent shrinkage of extracellular space caused by the intense activity. EIT could also be used to picture a steady rise in tissue impedance during seizure activity, which has been previously described. Thus, our results demonstrate that EIT can detect and localise different physiological changes during interictal and ictal activity and, in conjunction with ECoG, may in future improve the localisation of seizure foci in the clinical setting.
Keywords: EIT; Epilepsy; Imaging; Interictal spike; Seizure; Tissue impedance.
Copyright © 2015 The Authors. Published by Elsevier Inc. All rights reserved.
Figures
Similar articles
-
Real-time imaging of epileptic seizures in rats using electrical impedance tomography.Neuroreport. 2017 Aug 2;28(11):689-693. doi: 10.1097/WNR.0000000000000823. Neuroreport. 2017. PMID: 28628556 Free PMC article.
-
In vivo imaging of deep neural activity from the cortical surface during hippocampal epileptiform events in the rat brain using electrical impedance tomography.Neuroimage. 2020 Apr 1;209:116525. doi: 10.1016/j.neuroimage.2020.116525. Epub 2020 Jan 8. Neuroimage. 2020. PMID: 31923606
-
Frequency-dependent characterisation of impedance changes during epileptiform activity in a rat model of epilepsy.Physiol Meas. 2018 Aug 20;39(8):085003. doi: 10.1088/1361-6579/aad5f4. Physiol Meas. 2018. PMID: 30047486
-
Animal models for epileptic foci localization, seizure detection, and prediction by electrical impedance tomography.Wiley Interdiscip Rev Cogn Sci. 2022 Nov;13(6):e1619. doi: 10.1002/wcs.1619. Epub 2022 Sep 12. Wiley Interdiscip Rev Cogn Sci. 2022. PMID: 36093634 Review.
-
Neuronuclear assessment of patients with epilepsy.Semin Nucl Med. 2008 Jul;38(4):227-39. doi: 10.1053/j.semnuclmed.2008.02.004. Semin Nucl Med. 2008. PMID: 18514079 Review.
Cited by
-
Imaging fast electrical activity in the brain during ictal epileptiform discharges with electrical impedance tomography.Neuroimage Clin. 2018;20:674-684. doi: 10.1016/j.nicl.2018.09.004. Epub 2018 Sep 5. Neuroimage Clin. 2018. PMID: 30218899 Free PMC article.
-
Advances in electrical impedance tomography-based brain imaging.Mil Med Res. 2022 Feb 28;9(1):10. doi: 10.1186/s40779-022-00370-7. Mil Med Res. 2022. PMID: 35227324 Free PMC article. Review.
-
A Versatile and Reproducible Multi-Frequency Electrical Impedance Tomography System.Sensors (Basel). 2017 Jan 31;17(2):280. doi: 10.3390/s17020280. Sensors (Basel). 2017. PMID: 28146122 Free PMC article.
-
Imaging of focal seizures with Electrical Impedance Tomography and depth electrodes in real time.Neuroimage. 2021 Jul 1;234:117972. doi: 10.1016/j.neuroimage.2021.117972. Epub 2021 Mar 20. Neuroimage. 2021. PMID: 33757909 Free PMC article.
-
Applications of Electrical Impedance Tomography in Neurology.Basic Clin Neurosci. 2022 Sep-Oct;13(5):595-608. doi: 10.32598/bcn.2021.3087.1. Epub 2022 Sep 1. Basic Clin Neurosci. 2022. PMID: 37313030 Free PMC article. Review.
References
-
- Adler A., Lionheart W.R. Uses and abuses of EIDORS: an extensible software base for EIT. Physiol. Meas. 2006;27(5):S25–S42. - PubMed
-
- Aristovich K. 15th International Conference on Biomedical Applications of Electrical Impedanec Tomography. 2014. High-resolution imaging of fast neural activity in the brain with electrical impedance tomography.
-
- Aristovich K.Y. A method for reconstructing tomographic images of evoked neural activity with electrical impedance tomography using intracranial planar arrays. Physiol. Meas. 2014;35(6):1095–1109. - PubMed
MeSH terms
Substances
LinkOut - more resources
Full Text Sources
Other Literature Sources
Medical
