. 2015 Nov 3;6(34):36522-34.
doi: 10.18632/oncotarget.5204.

RD3 loss dictates high-risk aggressive neuroblastoma and poor clinical outcomes

Affiliations

RD3 loss dictates high-risk aggressive neuroblastoma and poor clinical outcomes

Faizan H Khan et al. Oncotarget. .

Abstract

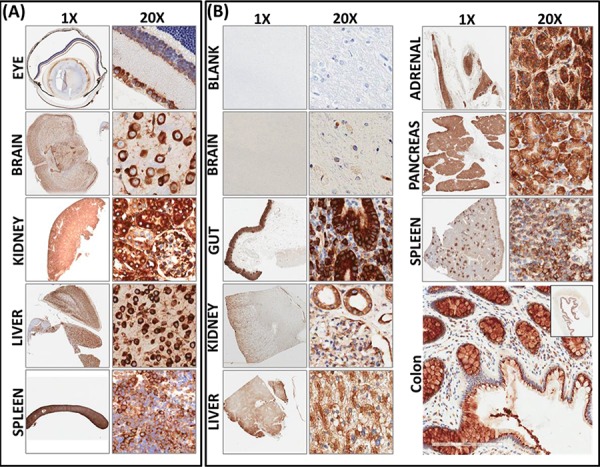
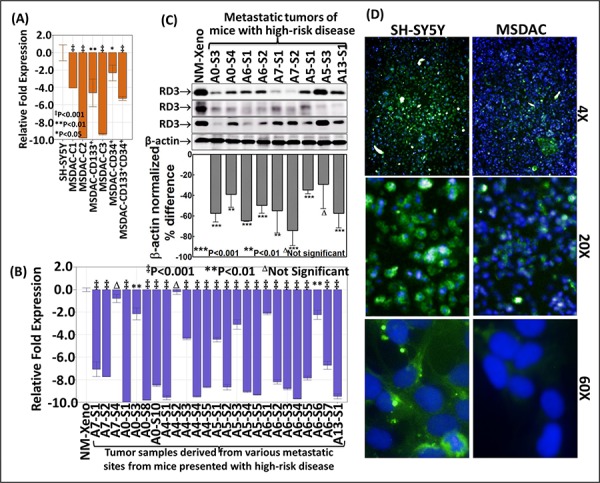
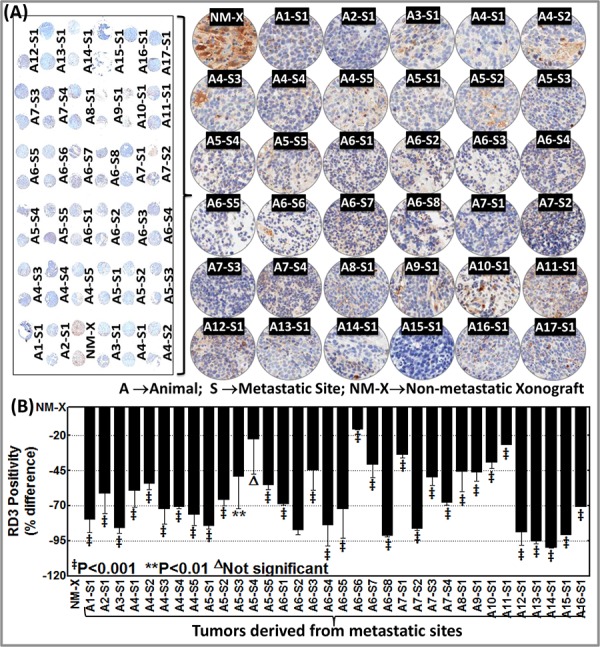
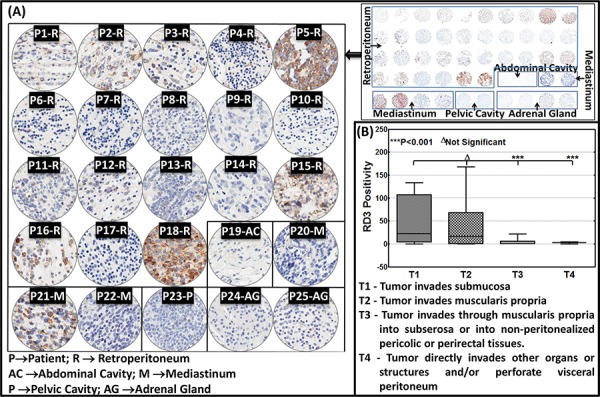
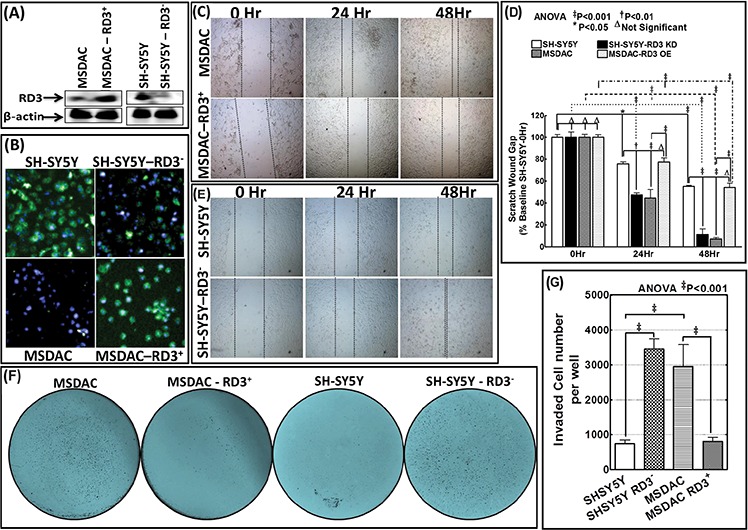
Clinical outcomes for high-risk neuroblastoma patients remains poor, with only 40-50% 5-Year overall survival (OS) and <10% long-term survival. The ongoing acquisition of genetic/molecular rearrangements in undifferentiated neural crest cells may endorse neuroblastoma progression. This study recognized the loss of Retinal Degeneration protein 3, RD3 in aggressive neuroblastoma, and identified its influence in better clinical outcomes and defined its novel metastasis suppressor function. The results showed ubiquitous expression of RD3 in healthy tissues, complete-loss and significant TNM-stage association of RD3 in clinical samples. RD3-loss was intrinsically associated with reduced OS, abridged relapse-free survival, aggressive stage etc., in neuroblastoma patient cohorts. RD3 was transcriptionally and translationally regulated in metastatic site-derived aggressive (MSDAC) cells (regardless of CSC status) ex vivo and in tumor manifolds from metastatic sites in reproducible aggressive disease models in vivo. Re-expressing RD3 in MSDACs reverted their metastatic potential both in vitro and in vivo. Conversely muting RD3 in neuroblastoma cells not only heightened invasion/migration but also dictated aggressive disease with metastasis. These results demonstrate the loss of RD3 in high-risk neuroblastoma, its novel, thus-far unrecognized metastasis suppressor function and further imply that RD3-loss may directly relate to tumor aggressiveness and poor clinical outcomes.

Keywords: RD3; high-risk aggressive neuroblastoma; metastasis; neuroblastoma; tumor suppressor.


Conflict of interest statement

CONFLICTS OF INTEREST

The authors declare no competing financial interests.

Figures

Figure 1
Figure 1. Constitutive expression and localization of RD3 in normal mouse and human tissues
A. Representative photomicrographs (1x and 20X) showing RD3 localization and expression in healthy mouse tissues. Tissue macroarray constructed with healthy mouse eye, brain, kidney, liver and spleen tissues coupled with automated IHC showing strong positivity of RD3 expression localized in perinuclear, cytoplasmic, and nuclear regions. B. RD3 localization and expression in normal human tissues. Corresponding section with no-primary antibody IHC(s) serves as the negative control. RD3 is ubiquitously expressed in in normal human brain, gut, kidney liver, pancreas, adrenal gland, spleen and colon tissues and highly localized in perinuclear regions, with some positivity in nuclear and cytoplasmic regions. Enlarged photomicrograph of colon depicts RD3 cellular localization.
Figure 2
Figure 2. Transcriptional and translational loss of RD3 in high-risk aggressive neuroblastoma
A. Histograms from QPCR analysis showing complete suppression of RD3-transcription in the clones of CD34CD133, CD133+CD34, CD133CD34+ or CD133+CD34+ MSDACs grown ex vivo. B. RD3-QPCR analysis in the manifold of tumor tissues from metastatic high-risk aggressive disease and non-metastatic xenografts. Compared to the non-metastatic primary xenografts, RD3-transcription was completely suppressed in every metastatic tumor. C. Representative immunoblots showing marked loss of RD3 in tumor tissues from metastatic sites. RD3 loss was examined with antibody from three different sources. Densitometry analyses was performed using Quantity One Image analysis software and are compared using GraphPad PRISM software D. High-content confocal imaging showing the cellular localization (60X) and the variation in RD3 levels in parental SH-SY5Y and MSDACs. RD3 is lost in MSDACs. Cellular localization and expression of RD3 in SH-SY5Y and MSDACs were examined using Operetta high content and quantitative confocal imaging using Alexa Fluor 488 fluorochrome conjugated anti-mouse secondary antibodies. The nucleus was counter-labeled with DAPI. Plates were analyzed in Operetta with atleast eight fields/well and three wells/clone with a minimum of 21-Z planes. Unstained controls were included for both cell lines.
Figure 3
Figure 3. Customized tissue microarray analysis and automated RD3 IHC recognizes complete loss of RD3 in animal model of spontaneous and reproduced high-risk aggressive neuroblastoma
A. Thumbnail and constructed images (20X) of tissue micro array (TMA) showing RD3 levels in non-metastatic primary xenograft (NM-X) and manifold of metastasized tumors from animals with spontaneous (developed from parental SH-SY5Y cells, A1–A12) and reproduced (developed from MSDACs, A13–A17) high-risk aggressive neuroblastoma. Tumor tissues from non-metastatic xenograft-bearing animals and from multiple metastatic sites from high-risk aggressive disease-bearing animals were printed in duplicate and examined for RD3 positivity and expression using automated IHC. B. Aperio image analysis coupled with GraphPad PRISM statistical analysis showing significant and consistent loss of RD3 across the manifold of metastasized tumors from animals with spontaneous and reproduced high-risk aggressive neuroblastoma when compared with non-metastatic primary xenograft. The slides were micro-digitally scanned using an Aperio Scanscope slide scanner and analyzed using integrated Spectrum software.
Figure 4
Figure 4. RD3 loss associates with the advanced tumor stage in neuroblastoma patients
A. Thumbnail and constructed images (20X) of human neuroblastoma TMA showing RD3 levels in neuroblastoma samples (n = 25). TMA comprising human neuroblastoma tissues derived from the retroperitoneal, abdominal, and pelvic cavities, the mediastinum, and the adrenal glands subjected to automated RD3-IHC analysis revealed a significant correlation of the RD3 positivity with its expression decreased per increased tumor invasive potential, with complete loss in highly invasive T4 tumors to the TNM stages. TNM classification includes: Tumor invades submucosa (T1, n = 5); Tumor invades muscularis propria (T2, n = 8); Tumor invades through muscularis propria into subserosa or into non-peritonealized pericolic or perirectal tissues (T3, n = 10), and; Tumor directly invades other organs or structures and/or perforates visceral peritoneum (T4, n = 2). B. Aperio TMA image analysis of RD3 positivity identifies significant correlation of RD3 expression with TNM disease stage. Group-wise comparisons were performed with one-way ANOVA using GraphPad Prism.
Figure 5
Figure 5. RD3 regulates tumor cell migration and invasion
A. Representative immunoblots showing the re-expression of RD3 in MSDACs and silencing of RD3 in SH-SY5Y cells. Expression of GFP-tagged RD3 (Origene) was carried out by using TurboFectin 8.0 and RD3 silencing with shRNA (MISSION® shRNA, Sigma-Aldrich) following standard protocols. B. Representative microphotographs acquired from Operetta high-content confocal immunofluorescence imaging validate RD3 silencing in SH-SY5Y cells and RD3 re-expression in MSDACs. C. Scratch-wound-assay showing the cell-migration patterns of MSDACs and RD3-re-expressed MSDACs under proliferation controlled conditions at 0, 24 and 48 h after wound initiation. MSDACs exhibits robust cell migrations with significant wound closure after 48 h, while re-expression of RD3 in MSDACs significantly inhibited their migration. D. Histograms of scratch wound gap measurements (mean and SD) showing the cell migration patterns of MSDACs with and without RD3 re-expression and parental SH-SY5Y cells with and without RD3 silencing examined at 0, 24 and 48 h after wound initiation. Group-wise comparisons were examined by two-way ANOVA with Bonferroni's post-hoc test made using GraphPad PRISM software and a P value of < 0.05 is considered significant. E. Scratch-wound-assay showing the cell-migration patterns of SH-SY5Y cells and RD3-silenced SH-SY5Y cells under proliferation controlled conditions at 0, 24 and 48 h after wound initiation. SH-SY5Y cells exhibited only base-line migrations after 48 h, while silencing RD3 in SH-SY5Y cells consistently increased their migration with significant wound closure. F. Representative microphotographs of matrigel invasion assay showing robust invasion of MSDACs, completely alleviated invasion in RD3-re-expressed MSDACs and profound increase in invasive potential of RD3-silenced SH-SY5Y cells. Invasion assays are performed using BD Matrigel invasion assay following standard protocols. G. Histograms of matrigel invaded cells (mean and SD) showing complete inhibition of MSDACs' invasion potential with RD3 re-expression and significant increase in the invasiveness of RD3-silenced SH-SY5Y cells. Quantification of invaded cells was performed using Image Quant colony count analysis software and the group-wise comparisons were examined by ANOVA with Bonferroni's post-hoc corrections using GraphPad PRISM software. A P value of < 0.05 is considered significant.
Figure 6
Figure 6. RD3 regulates metastatic potential of neuroblastoma cells
A. Representative immunoblots showing RD3 knocked down in human SH-SY5Y cells stably transfected with RD3 shRNA (MISSION® shRNA, Sigma-Aldrich) with puromycin mammalian selection and re-expression of RD3 in MSDACs that were stably transfected with RD3 (GFP-tagged - Human retinal degeneration 3, transcript variant 1, Origene Technologies) with neomycin mammalian selection. The stable transfection was carried out using either TurboFectin 8.0 reagent (Origene) or Neon electroporation transfection system (Life Technologies). Representative photomicrograph showing cells stably transfected with GFP tagged RD3 construct showing the expression of GFP. B. Representative phase contrast photomicrographs showing tumorosphere forming capabilities of SH-SY5Y (vc), RD3 stably silenced SH-SY5Y cells, MSDACs (vc) and RD3 stably re-expressed MSDACs maintained in serum free stem cell culture conditions. C. Schematic representation and representative mouse images showing relative tumorigenic capacity and aggressive disease formation of RD3 stably expressing MSDACs. RD3 stably expressing MSDACs resulted in the development of relatively small xenograft (~250 mm3) without metastatic tumors compared with the large xenografts with multiple metastasis in mice that received MSDACs (vc). Vertical Box and Whiskers plot showing mean number of metastatic tumors observed in animals that received MSDACs and RD3 re-expressed MSDACs.

References

    1. Marc TG, Gurney JG, Smith MA, Olshan AF. Cancer Incidence and Survival among Children and Adolescents: United States SEER Program 1975–1995. National Cancer Institute; Bethesda, MD: 1999. Sympathetic Nervous System Tumors; pp. 65–72. NIH Pub. No. 99-4649(ICCC IV)
    1. Gurney JG, Smith MA, Ross JA. Cancer Incidence and Survival among Children and Adolescents: United States SEER Program 1975–1995. National Cancer Institute; Bethesda, MD: 1999. Cancer Among Infants; pp. 149–156. NIH Pub. No. 99–4649 (XII)
    1. Morgenstern DA, Baruchel S, Irwin MS. Current and future strategies for relapsed neuroblastoma: challenges on the road to precision therapy. Journal of pediatric hematology/oncology. 2013;35:337–347. - PubMed
    1. American-Cancer-Society . Cancer Facts & Figures. Atlanta: American Cancer Society; 2013. pp. 1–64.
    1. Smith MA, Seibel NL, Altekruse SF, Ries LA, Melbert DL, O'Leary M, Smith FO, Reaman GH. Outcomes for children and adolescents with cancer: challenges for the twenty-first century. J Clin Oncol. 2010;28:2625–2634. - PMC - PubMed

Publication types