. 2015 Oct 6;6(30):30035-56.
doi: 10.18632/oncotarget.5046.

Automated tracking of tumor-stroma morphology in microtissues identifies functional targets within the tumor microenvironment for therapeutic intervention

Affiliations

Automated tracking of tumor-stroma morphology in microtissues identifies functional targets within the tumor microenvironment for therapeutic intervention

Malin Åkerfelt et al. Oncotarget. .

Abstract

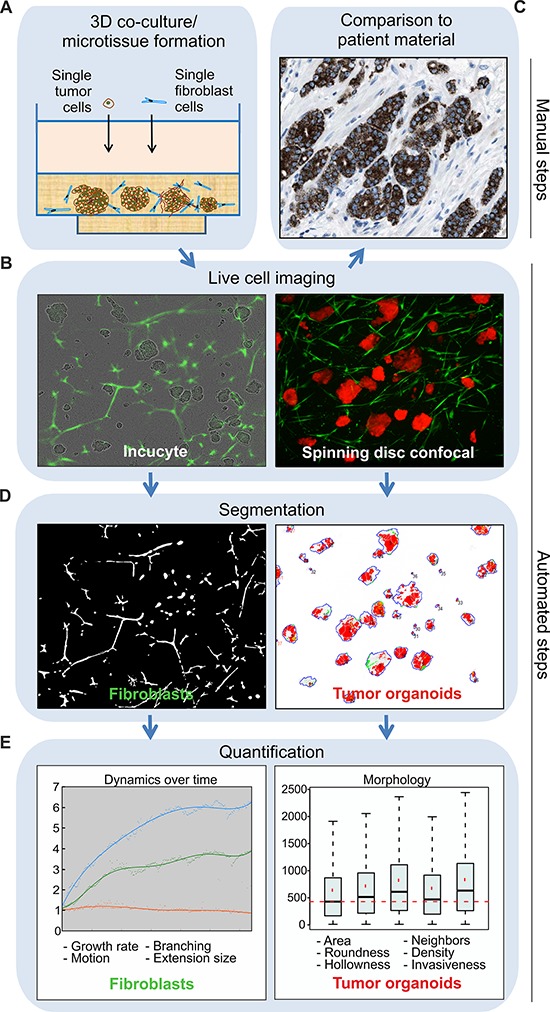
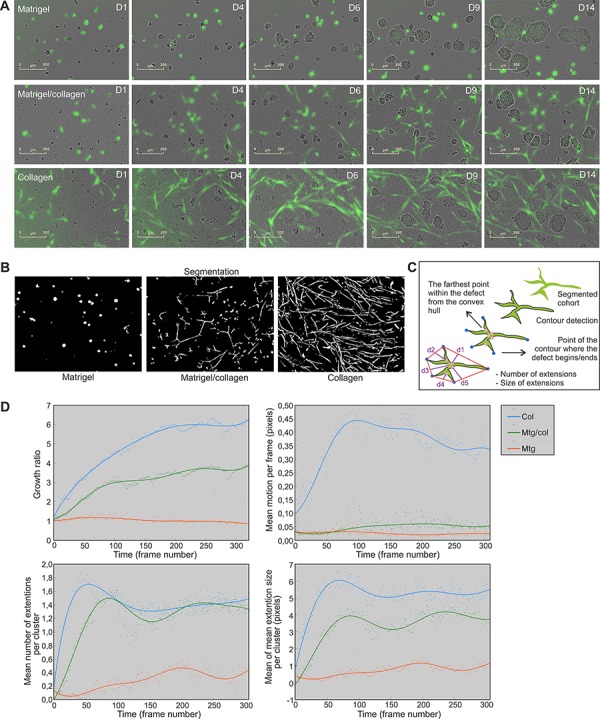
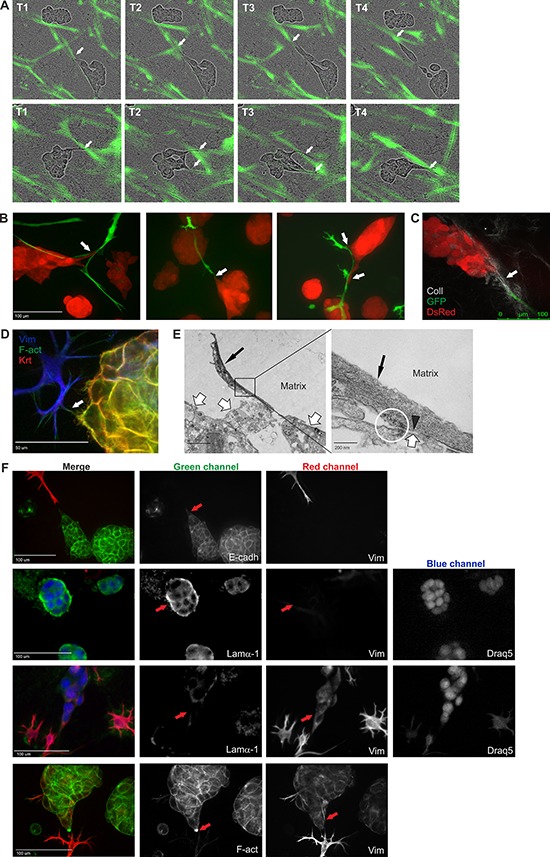
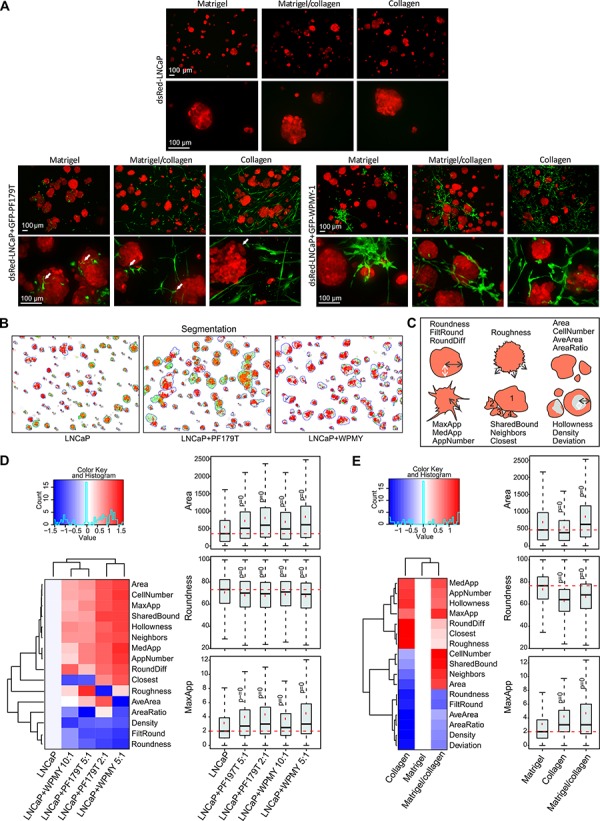
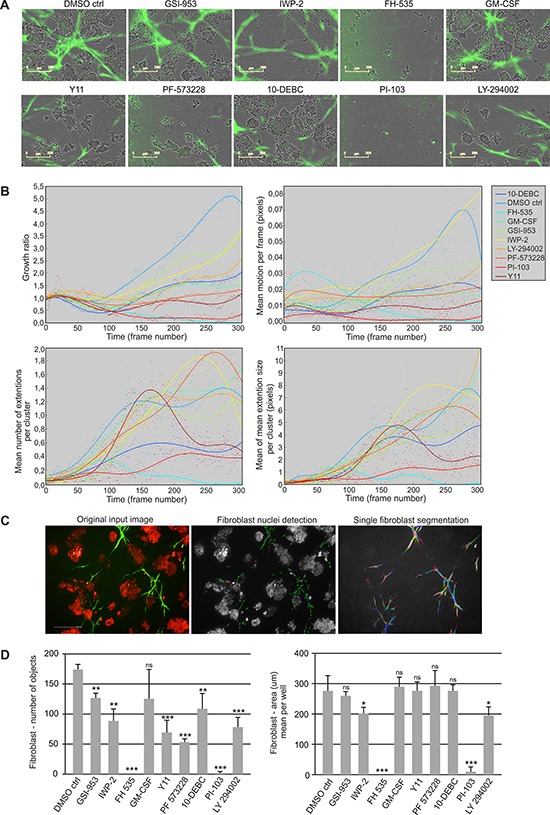
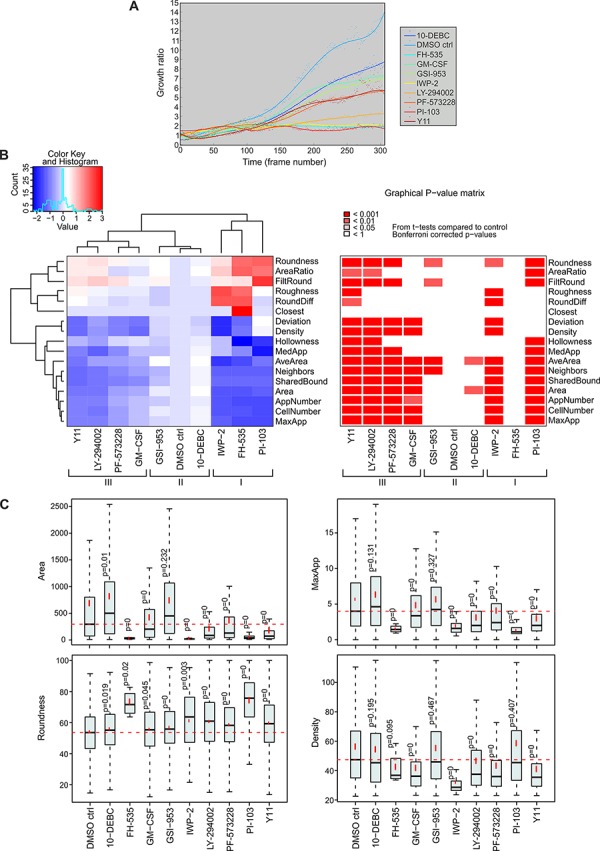
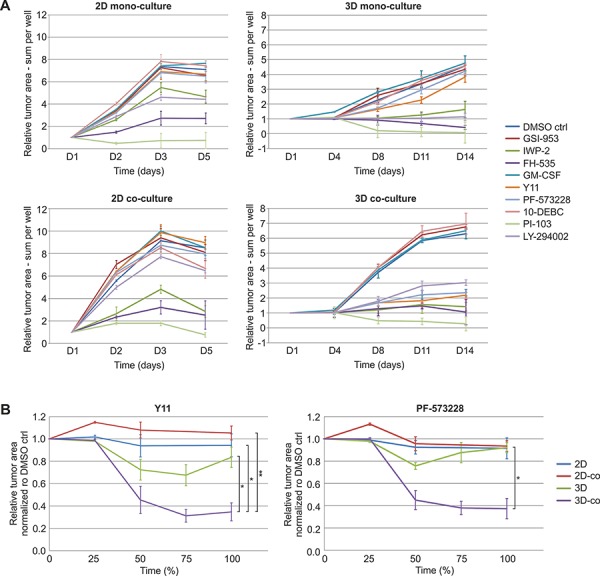
Cancer-associated fibroblasts (CAFs) constitute an important part of the tumor microenvironment and promote invasion via paracrine functions and physical impact on the tumor. Although the importance of including CAFs into three-dimensional (3D) cell cultures has been acknowledged, computational support for quantitative live-cell measurements of complex cell cultures has been lacking. Here, we have developed a novel automated pipeline to model tumor-stroma interplay, track motility and quantify morphological changes of 3D co-cultures, in real-time live-cell settings. The platform consists of microtissues from prostate cancer cells, combined with CAFs in extracellular matrix that allows biochemical perturbation. Tracking of fibroblast dynamics revealed that CAFs guided the way for tumor cells to invade and increased the growth and invasiveness of tumor organoids. We utilized the platform to determine the efficacy of inhibitors in prostate cancer and the associated tumor microenvironment as a functional unit. Interestingly, certain inhibitors selectively disrupted tumor-CAF interactions, e.g. focal adhesion kinase (FAK) inhibitors specifically blocked tumor growth and invasion concurrently with fibroblast spreading and motility. This complex phenotype was not detected in other standard in vitro models. These results highlight the advantage of our approach, which recapitulates tumor histology and can significantly improve cancer target validation in vitro.

Keywords: 3D co-culture; cancer associated fibroblast (CAF); focal adhesion kinase (FAK); invasion; phenotypic screening.


Conflict of interest statement

CONFLICTS OF INTEREST

The authors declare that they have no competing interest.

Figures

Figure 1
Figure 1. Tracking of tumor-stroma morphology and dynamics in microtissues by automated image analysis
Schematic presentation of the computational analysis pipeline on example image data. A. Manual establishment of tumor-fibroblast co-cultures generated from traceable cell lines in the standardized and miniaturized experimental platform, allowing cells to be embedded in a narrow focal plane of ECM. B. Real-time live-cell imaging is employed by continuous monitoring for up to several weeks. Incucyte FLR phase contrast and green fluorescent images are captured, ideal for investigations of long dose-responses and time-course experiments of fibroblast dynamics in the co-cultures (left panel). Spinning disc confocal microscopic fluorescent live-cell images of tumor cells together with fibroblasts are used for detailed examination of tumor organoid morphology (right panel). C. The tissue architecture of the resulting microtissues can be empirically compared to clinical samples, in order to assess how consistently in vivo tumor morphology observed in patients is recapitulated. This reference image displays alpha-methylacyl-CoA racemase (AMACR) antibody staining of PrCa tissue (www.proteinatlas.org), which is a widely used biomarker in PrCa. D. Incucyte FLR images sequences are used for fibroblast segmentation, achieved by local adaptive thresholding (left panel). Confocal microscopy images are used for segmentation of tumor organoids carried out by AMIDA (right panel). E. Final quantification is based on dual segmentation of tumor and fibroblast cells. Growth, motion and shape analyzes of fibroblasts are performed over time. In addition, detailed morphological measurements of tumor organoids are performed at the end-point. Example graphs are displayed.
Figure 2
Figure 2. Collagen is required for CAF cohort growth, movement and branching in 3D co-cultures
A. Incucyte FLR real-time live-cell imaging of LNCaP organoids (phase contrast) and PF179T CAFs (green) co-cultured for 14 days in Matrigel, Matrigel/collagen mixture and collagen. Scale bar: 200 μm. B. Fibroblast morphology and dynamics was analyzed from the time-lapse images in an automated fashion. CAF cohort segmentation was performed by local adaptive thresholding and example images of segmented CAFs in three matrices are described. C. Schematic drawing depicts how branching of each CAF cohort was assessed by extracting the closed contour and detecting the convex hull of the contour as well as contour convexity defects. D. Quantification of fibroblast growth rate (area), motion per frame, number of extensions per cluster and extension size per cluster, is shown over time. Every dot represents a value per each time frame of the image sequence. Segmented real-time live-cell image sequences from three different ECMs were used for quantification. Col: collagen, Mtg/col: Matrigel/collagen 1:1 mixture, Mtg: Matrigel.
Figure 3
Figure 3. CAFs remodel the ECM and facilitate tumor cell invasion
A. Two example sequences of Incucyte FLR real-time live-cell imaging of LNCaP cells (phase contrast) and PF179T CAFs (green), co-cultured in Matrigel/collagen mixture. CAFs appear to pull the matrix and lead the way for tumor cells to invade. White arrows depict tumor-stroma interaction. T: timepoints, captured with 4 h intervals. B. Confocal live-cell images of tumor stroma interactions. Tumor cells follow the fibroblast tracks. Red: dsRed-LNCaP, green: GFP-PF179T CAFs. White arrows depict tumor-stroma interaction. Scale bar: 100 μm. C. Second-harmonic generation microscopy image of collagen-mediated tumor-CAF connection. Red: dsRed-LNCaP, green: GFP-PF179T CAFs, grey: collagen fibers. Scale bar: 100 μm. D. IF staining implying direct contact between tumor and stromal cells. Arrow depicts tumor-stroma interaction. Vimentin (Vim): mesenchymal cell marker, Pan-keratin (Krt): epithelial cell marker, F-actin (F-Act). Scale bar: 50 μm. E. Left panel: high-resolution transmission electron microscopy (TEM) images, showing direct tumor and stromal cell contact. Thin black arrow depicts α-smooth muscle actin (α-SMA)-rich CAF, thick white arrow depicts tumor organoid. Scale bar: 2 μm. Right panel: Marked area in the left panel is blown up. Black arrowhead points to α-SMA-rich cytoskeleton in the CAF, directly adjacent to the tumor cell membrane. The circle highlights electron dense material, indicating cortical actin accumulation, a hallmark of cell-cell contacts. Scale bar: 200 nm. For the complete TEM panel, see Supplementary Figure S3. F. Representative IF-stainings displaying CAF-promoted tumor invasion. Tumor cells lose both the E-cadherin expression (panel 1) and the basal lamina (panel 2 and 3) in the organoid protrusion, in response to nearby CAFs starting to pull the matrix. Instead, the tumor protrusion expressed vimentin (panel 3 and 4) and an accumulation of actin is observed in the invasive tip (panel 4). Vimentin (Vim): mesenchymal cell marker, E-cadherin (E-cadh): epithelial cell marker, Laminin-α1 (Lamα1): basal lamina, F-actin (F-Act), Draq5: nuclear stain. Red arrows depict the important details. The separate channels are displayed in black and white. All channels are shown in color in the merged images. Scale bar: 100 μm.
Figure 4
Figure 4. Addition of fibroblasts promote growth and invasiveness of tumor organoids
A. Representative maximum projection confocal images of 3D mono and co-cultures cultured for 14 days in Matrigel, collagen and mixture. Red: dsRed-LNCaP, green: GFP-PF179T (left panel), GFP-WPMY-1 (right panel). White arrows in left, lower panel depict filopodia-like structures of PF179T CAFs interacting with tumor organoids. Scale bar: 100 μm. B. LNCaP organoid segmentation was performed by the automated image data analysis software AMIDA [27], and example images of segmented LNCaP organoids in in Matrigel/collagen 3D mono- or co-culture are described. Red: dsRed LNCaP segmentation, green: overlapping GFP signal. C. Schematic drawing depicts morphological parameters that were analyzed with AMIDA. D. Classification of morphological changes in tumor organoids by addition of different fibroblast ratios (PF179T and WPMY-1), in comparison to LNCaP monoculture. E. Classification of morphological changes in tumor organoids co-cultures in different ECM; collagen and Matrigel/collagen mixture in comparison to Matrigel. (D–E) Heatmaps summarize altered parameters from AMIDA analysis. Values are color-coded as red (increased) versus blue (decreased), relative to the control. For explanation of morphometric parameters, see Supplementary Table S1. Box and whisker plots shown for selected parameters from the heatmap. Area describes the size of the segmented structure in pixels, Roundness is a measure of loss of the round organoid phenotype, and MaxApp is an estimate for the maximum length of appendages (invasive processes) observed in the segmented structure. P-values are Bonferroni-corrected from Mann-Whitney U-test and compared to control. P = 0 indicates P-values < 0.001.
Figure 5
Figure 5. Small molecule inhibitors block growth and dynamics of fibroblasts in 3D co-culture
A. Representative live-cell images of LNCaP (phase contrast) and GFP-PF179T cells (green) co-cultured in Matrigel/collagen mixture, treated with inhibitors (3 μM) or GM-CSF (0.3 ng/ml). For description of perturbants, see Table 1. Scale bar 200 μm. B. Quantification of perturbants’ effects on fibroblast growth rate (area), motion per frame (motility), extension size per cluster and number of extensions per cluster (branching), is shown over time. Segmented real-time live-cell image sequences were used for the quantification. Every dot represents a value per each time frame of the image sequence. C. Segmentation of single fibroblasts using dual labeled, Histone 2B-mCherry/GFP-PF179Ts, together with dsRed-LNCaP cells. All the fibroblast nuclei (green: mCherry) were selected and their surrounding cytoplasm was detected by the overlay of the GFP signal from the fibroblasts (shown in different colors). The segmentation was performed using the PE Harmony software. D. Quantification of the effect of perturbants on single fibroblast number and area. Spinning disc confocal images taken at the end point (day 14) were used for quantification. Error bars depict SD. P-values * P < 0.05, **P < 0.01, *** P < 0.001, ns: not significant, by Student t-test.
Figure 6
Figure 6. Inhibition of cancer-associated molecules affects growth and morphology of tumor organoids in 3D co-culture
A. LNCaP tumor organoid growth was analyzed from Incucyte FLR time-lapse images in an automated fashion. Quantification of tumor fibroblast growth rate (area) is shown over 14 days. B. Classification of morphological changes in tumor organoids by the use of small molecule inhibitors (3 μM) or GM-CSF (0.3 ng/ml). Three distinct groups of tumor phenotypes are marked with roman numerals (I, II and III). Heatmap and graphical P-value matrix summarizes the altered parameters from the AMIDA analysis. Values are color-coded as red (increased) and blue (decreased), relative to the control. For explanation of morphometric parameters, see Supplementary Table S1. P-values are Bonferroni-corrected from t-tests and compared to DMSO control treatment (DMSO ctrl). C. Box and whisker plots of selected parameters from the heatmap. Area describes the size of the segmented structure in pixels, Roundness is a measure of loss of the round organoid phenotype, in percentage, MaxApp is an estimate for the maximum length of appendages of the segmented structure, and Density is measured as the intensity of the red channel for the segmented structure. P = 0 indicates P-values < 0.001.
Figure 7
Figure 7. FAK inhibitors significantly reduce tumor growth when relevant tumor microenvironment is included
A. Comparison of tumor cell/organoid growth in 2D mono- and co-culture as well as 3D mono- and co-culture models treated with small molecule inhibitors. Tumor area (red fluorescence) was segmented and quantified from PE Operetta High Content Imaging System confocal live-cell images (2x) of dsRed-LNCaP and GFP-PF179T cells cultured in different settings and treated with inhibitors (3 μM) or GM-CSF (0.3 ng/ml). Segmentation was performed by the PE Harmony software, to generate comparable growth curves. D: days in culture. B. Tumor growth curves for different culture settings treated with FAK inhibitors Y11 and PF-573228. The relative tumor area measures of compound treatments were normalized to DMSO control. To compare the different time frames of the 2D and the 3D experiments, the final time point for all experiments was set to 100%. Error bars depict SEM. P-values are * P < 0.05, ** P < 0.01, by Student t-test.

References

    1. Forde PM, Rudin CM. Crizotinib in the treatment of non-small-cell lung cancer. Expert Opin Pharmacother. 2012;13:1195–1201. - PubMed
    1. Härmä V, Virtanen J, Mäkela R, Happonen A, Mpindi JP, Knuuttila M, Kohonen P, Lötjönen J, Kallioniemi O, Nees M. A comprehensive panel of three-dimensional models for studies of prostate cancer growth, invasion and drug responses. PLoS One. 2010;5:e10431. - PMC - PubMed
    1. Weigelt B, Ghajar CM, Bissell MJ. The need for complex 3D culture models to unravel novel pathways and identify accurate biomarkers in breast cancer. Adv Drug Deliv Rev. 2014;69-70:42–51. - PMC - PubMed
    1. Subramanian B, Rudym D, Cannizzaro C, Perrone R, Zhou J, Kaplan DL. Tissue-engineered three-dimensional in vitro models for normal and diseased kidney. Tissue Eng Part A. 2010;16:2821–2831. - PMC - PubMed
    1. Abbott BL. ABCG2 (BCRP) expression in normal and malignant hematopoietic cells. Hematol Oncol. 2003;21:115–130. - PubMed

Publication types

MeSH terms

Substances

LinkOut - more resources