

An elaboration of theory about preventing outbreaks in homogeneous populations to include heterogeneity or preferential mixing
- PMID: 26375548
- PMCID: PMC5723926
- DOI: 10.1016/j.jtbi.2015.09.006
An elaboration of theory about preventing outbreaks in homogeneous populations to include heterogeneity or preferential mixing
Abstract
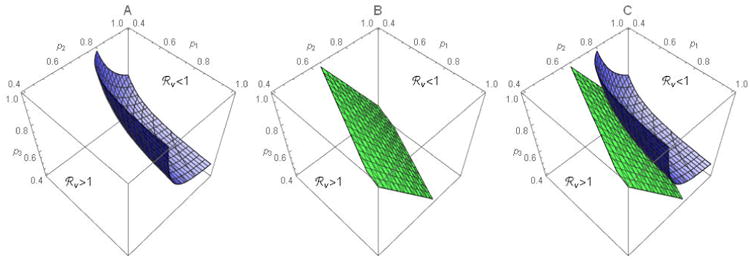
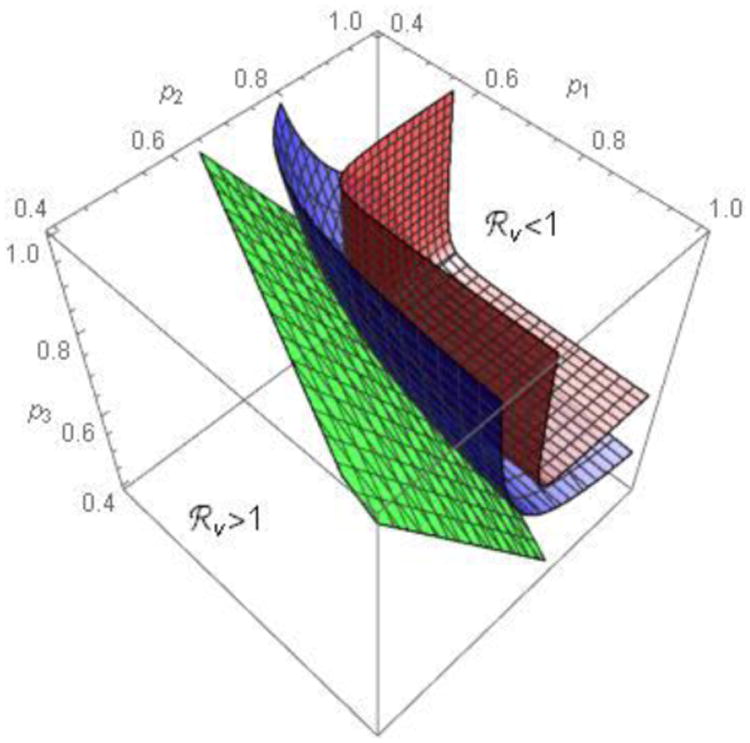
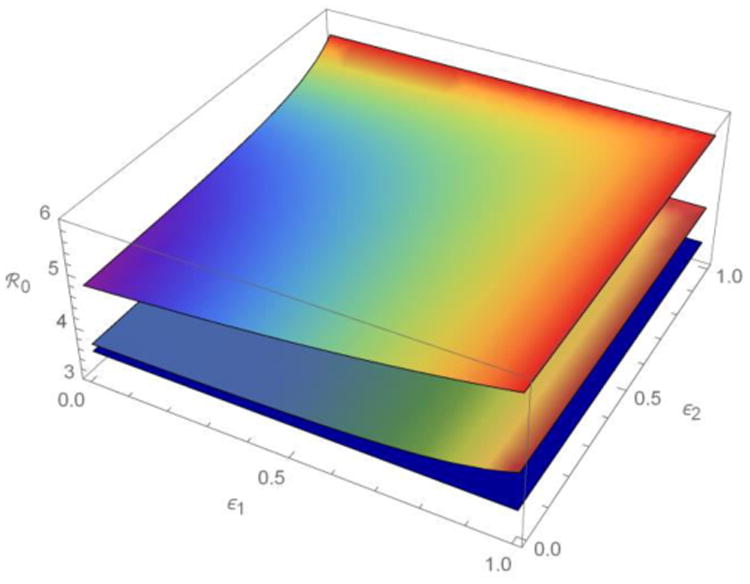
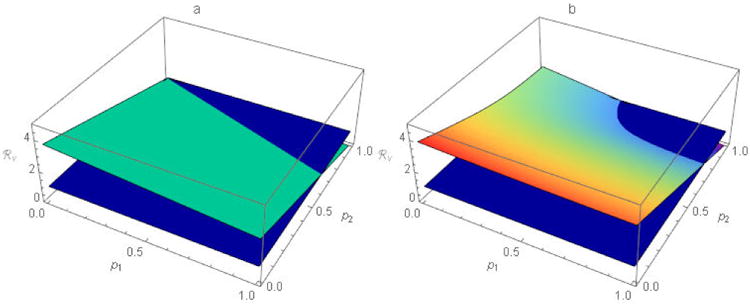
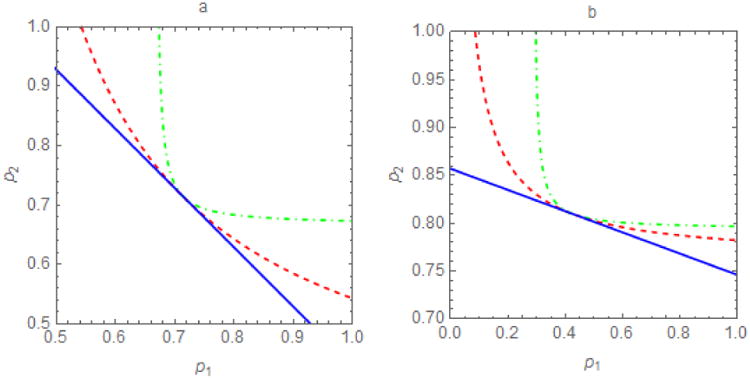
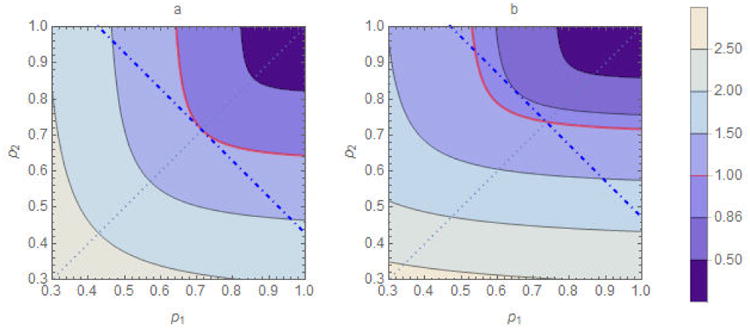
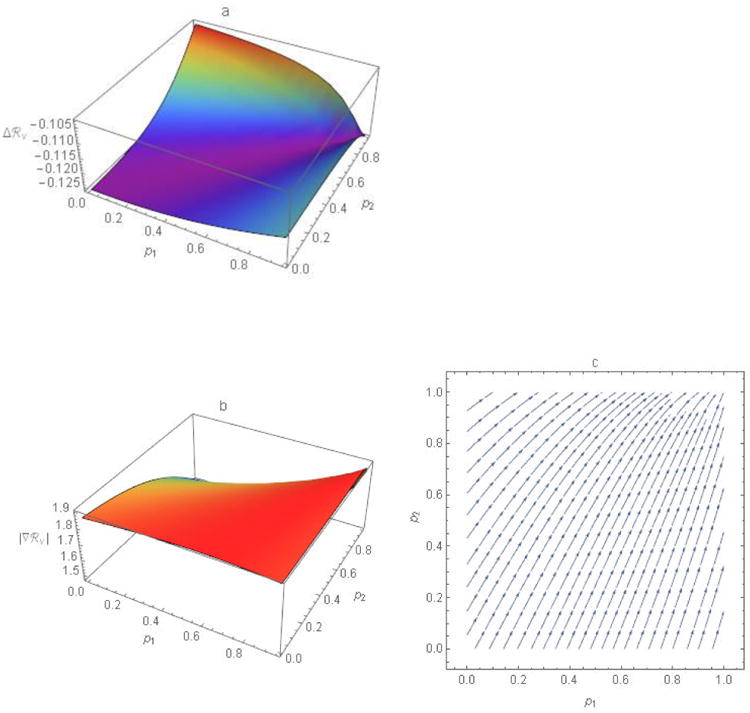
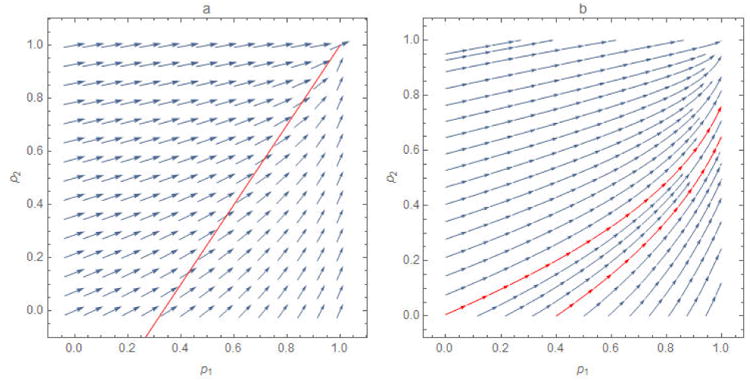
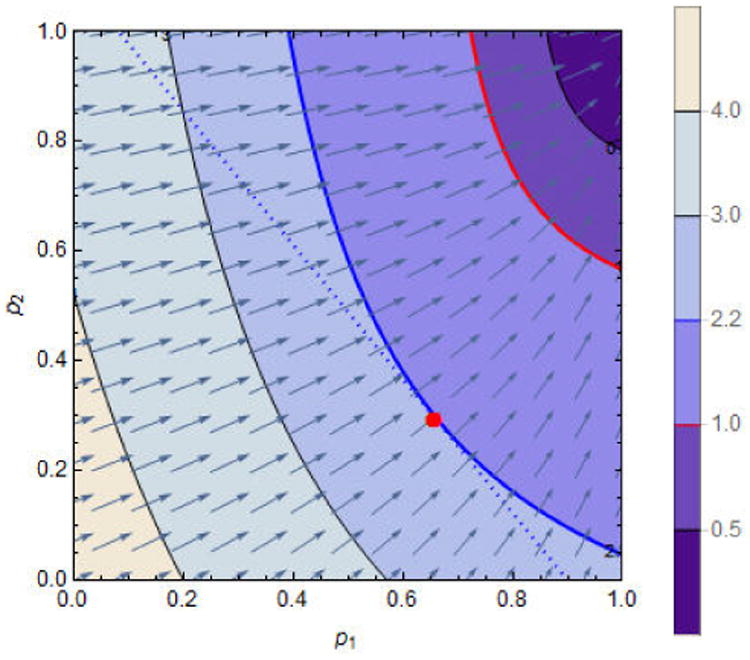
The goal of many vaccination programs is to attain the population immunity above which pathogens introduced by infectious people (e.g., travelers from endemic areas) will not cause outbreaks. Using a simple meta-population model, we demonstrate that, if sub-populations either differ in characteristics affecting their basic reproduction numbers or if their members mix preferentially, weighted average sub-population immunities cannot be compared with the proportionally-mixing homogeneous population-immunity threshold, as public health practitioners are wont to do. Then we review the effect of heterogeneity in average per capita contact rates on the basic meta-population reproduction number. To the extent that population density affects contacts, for example, rates might differ in urban and rural sub-populations. Other differences among sub-populations in characteristics affecting their basic reproduction numbers would contribute similarly. In agreement with more recent results, we show that heterogeneous preferential mixing among sub-populations increases the basic meta-population reproduction number more than homogeneous preferential mixing does. Next we refine earlier results on the effects of heterogeneity in sub-population immunities and preferential mixing on the effective meta-population reproduction number. Finally, we propose the vector of partial derivatives of this reproduction number with respect to the sub-population immunities as a fundamentally new tool for targeting vaccination efforts.
Keywords: Heterogeneity; Population-immunity threshold; Vaccine coverage.
Published by Elsevier Ltd.
Conflict of interest statement
Conflicts: The authors declare that they have no conflicts of interest.
Figures
Similar articles
-
Implications for infectious disease models of heterogeneous mixing on control thresholds.J Math Biol. 2023 Mar 8;86(4):53. doi: 10.1007/s00285-023-01886-9. J Math Biol. 2023. PMID: 36884154 Free PMC article.
-
The effect of heterogeneity in uptake of the measles, mumps, and rubella vaccine on the potential for outbreaks of measles: a modelling study.Lancet Infect Dis. 2016 May;16(5):599-605. doi: 10.1016/S1473-3099(16)00004-9. Epub 2016 Feb 5. Lancet Infect Dis. 2016. PMID: 26852723 Free PMC article.
-
Constrained minimization problems for the reproduction number in meta-population models.J Math Biol. 2018 Dec;77(6-7):1795-1831. doi: 10.1007/s00285-018-1216-z. Epub 2018 Feb 14. J Math Biol. 2018. PMID: 29445854 Free PMC article.
-
Folic acid supplementation and malaria susceptibility and severity among people taking antifolate antimalarial drugs in endemic areas.Cochrane Database Syst Rev. 2022 Feb 1;2(2022):CD014217. doi: 10.1002/14651858.CD014217. Cochrane Database Syst Rev. 2022. PMID: 36321557 Free PMC article.
-
The estimation of the basic reproduction number for infectious diseases.Stat Methods Med Res. 1993;2(1):23-41. doi: 10.1177/096228029300200103. Stat Methods Med Res. 1993. PMID: 8261248 Review.
Cited by
-
Analysis of serological surveys of antibodies to SARS-CoV-2 in the United States to estimate parameters needed for transmission modeling and to evaluate and improve the accuracy of predictions.J Theor Biol. 2023 Jan 7;556:111296. doi: 10.1016/j.jtbi.2022.111296. Epub 2022 Oct 5. J Theor Biol. 2023. PMID: 36208669 Free PMC article.
-
The heterogeneous mixing model of COVID-19 with interventions.J Theor Biol. 2022 Nov 21;553:111258. doi: 10.1016/j.jtbi.2022.111258. Epub 2022 Aug 28. J Theor Biol. 2022. PMID: 36041504 Free PMC article.
-
Effect of Timing of and Adherence to Social Distancing Measures on COVID-19 Burden in the United States : A Simulation Modeling Approach.Ann Intern Med. 2021 Jan;174(1):50-57. doi: 10.7326/M20-4096. Epub 2020 Oct 27. Ann Intern Med. 2021. PMID: 33105091 Free PMC article.
-
Optimal vaccination strategies for COVID-19 in population migration between two regions scenario.Hum Vaccin Immunother. 2023 Aug 1;19(2):2223108. doi: 10.1080/21645515.2023.2223108. Epub 2023 Jun 23. Hum Vaccin Immunother. 2023. PMID: 37350470 Free PMC article.
-
COVID-19 Seroprevalence in Canada Modelling Waning and Boosting COVID-19 Immunity in Canada a Canadian Immunization Research Network Study.Vaccines (Basel). 2021 Dec 23;10(1):17. doi: 10.3390/vaccines10010017. Vaccines (Basel). 2021. PMID: 35062678 Free PMC article.
References
-
- Levins R. Some demographic and genetic consequences of environmental heterogeneity for biological control. Bulletin of the Entomological Society of America. 1969;15(3):237–40.
-
- Dietz K. Models for vector-borne parasitic diseases. In: Barigozzi Claudio., editor. Vito Volterra Symposium on Mathematical Models in Biology Lecture Notes in Biomathematics. Vol. 39. 1980. pp. 264–77.
-
- Anderson RM, Medley GF, May RM, et al. A preliminary study of the transmission dynamics of human immunodeficiency virus (HIV), the causative agent of AIDS. IMA J Math Appl Med Biol. 1986;3(4):229–63. - PubMed
-
- May RM, Anderson RM. The transmission dynamics of human immunodeficiency virus (HIV) Phil Trans R Soc Lond B. 1988;321(1207):565–607. - PubMed
Publication types
MeSH terms
Grants and funding
LinkOut - more resources
Full Text Sources
Other Literature Sources
