. 2015 Sep 16;13(9):e1002251.
doi: 10.1371/journal.pbio.1002251. eCollection 2015.

Extremely High Mutation Rate of HIV-1 In Vivo

Affiliations

Extremely High Mutation Rate of HIV-1 In Vivo

José M Cuevas et al. PLoS Biol. .

Abstract

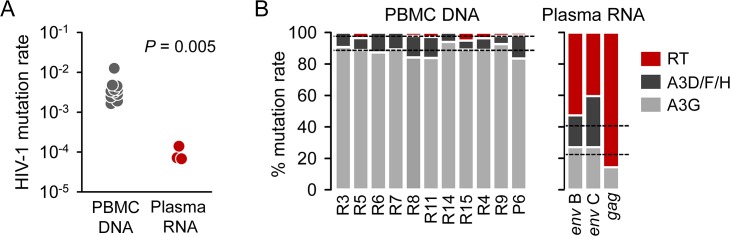
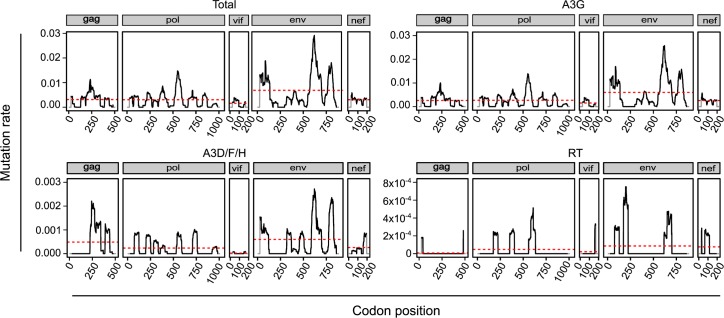
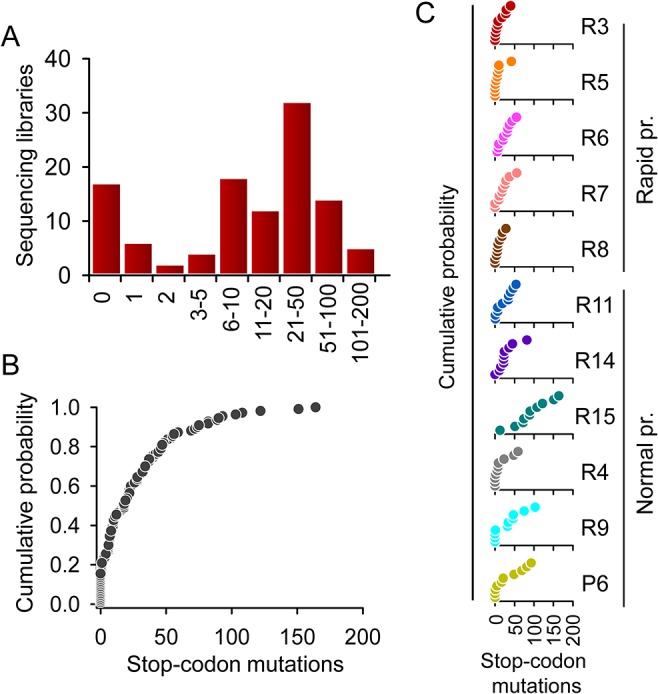
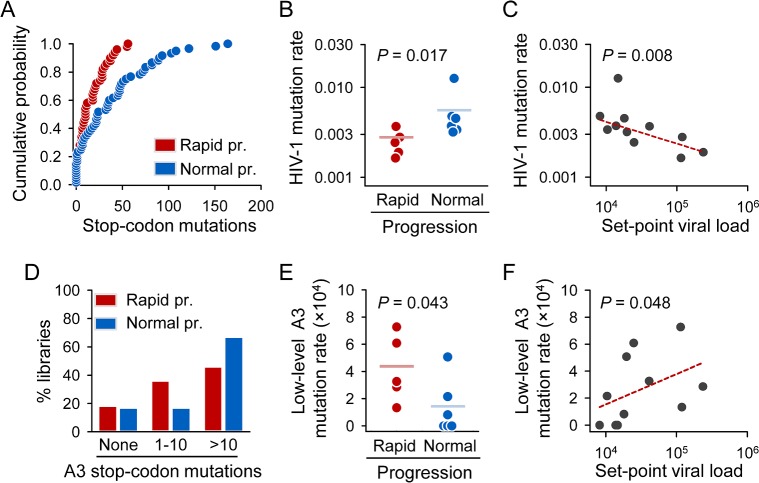
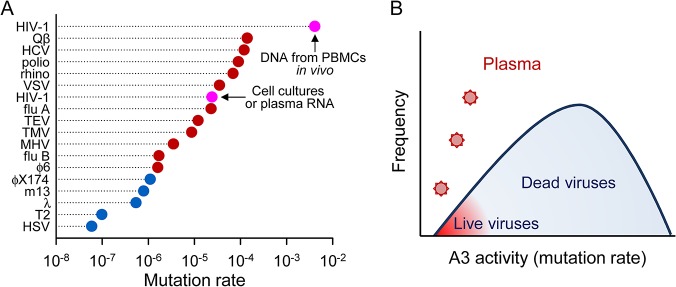
Rates of spontaneous mutation critically determine the genetic diversity and evolution of RNA viruses. Although these rates have been characterized in vitro and in cell culture models, they have seldom been determined in vivo for human viruses. Here, we use the intrapatient frequency of premature stop codons to quantify the HIV-1 genome-wide rate of spontaneous mutation in DNA sequences from peripheral blood mononuclear cells. This reveals an extremely high mutation rate of (4.1 ± 1.7) × 10-3 per base per cell, the highest reported for any biological entity. Sequencing of plasma-derived sequences yielded a mutation frequency 44 times lower, indicating that a large fraction of viral genomes are lethally mutated and fail to reach plasma. We show that the HIV-1 reverse transcriptase contributes only 2% of mutations, whereas 98% result from editing by host cytidine deaminases of the A3 family. Hypermutated viral sequences are less abundant in patients showing rapid disease progression compared to normal progressors, highlighting the antiviral role of A3 proteins. However, the amount of A3-mediated editing varies broadly, and we find that low-edited sequences are more abundant among rapid progressors, suggesting that suboptimal A3 activity might enhance HIV-1 genetic diversity and pathogenesis.


Conflict of interest statement

The authors have declared that no competing interests exist.

Figures

Fig 1
Fig 1. HIV-1 mutation rate and source of mutations in DNA from PBMCs and in RNA from plasma.
A. The mutation rate was inferred from PBMC DNA and from plasma RNA using the lethal mutation method. Each data point represents the average mutation rate obtained for one patient (PBMC DNA) or the average rate calculated from one large publicly available dataset of gag or env sequences (plasma RNA). B. Contribution of A3G, A3D/F/H, and the viral RT to the observed mutation rate in PBMC DNA and plasma RNA sequences. Dotted lines indicate the average contribution of each enzyme. Individual numerical values shown in this Figure are available in Table 1 and in the S1 Data file.
Fig 2
Fig 2. Distribution of mutation rates across HIV-1 genes.
The average total, A3G, A3D/F/H, and RT mutation rate within a sliding window of 50 codons across HIV1 genes (black skyline), and the average mutation rate for each gene (red dashed line) are shown. Stop codon and NSMT counts are represented in S3 Fig, and numerical values are available from the S3 Data file.
Fig 3
Fig 3. Variation in mutation rate among HIV-1 sequences.
A. Histogram showing the distribution of the number of stop codon mutations per sequencing library. B and C. Cumulative probability distribution of the number of stop codon mutations per sequencing library for the entire dataset (B) and for each patient (C). Notice that the number of mutations tends to be higher in normal progressors (bottom) than in rapid progressors (top). Individual numerical values shown in this Figure are available in the S4 Data file.
Fig 4
Fig 4. Association between HIV-1 mutation rate and disease progression markers.
A. Cumulative distribution of the number of stop-codon mutations per sequencing library for rapid and normal progressors. B. Differences in mutation rate between these two patient groups. C. Inverse correlation between the HIV-1 mutation rate and the set-point viral load. The linear regression line obtained after removing the high-mutation outlier patient R15 is shown in red. D. Percent of libraries showing no (0), low-level (1–10), or high-level A3 editing (>10) in rapid and normal progressors. E. Differences in low-level A3 mutation rate (using libraries with 1–10 A3-driven mutations) between normal and rapid progressors. F. Positive correlation between the low-level A3 mutation rate and the set-point viral load. The linear regression line is shown in red. Individual numerical values shown in this Figure are available on Table 1 and in the S1 Data file.
Fig 5
Fig 5. Comparison of viral mutation rates and effect of A3-mediated editing.
A. Mutation rates per base per cell are shown for HIV-1, bacteriophage Qβ, HCV, poliovirus, human rhinovirus 14, vesicular stomatitis virus (VSV), influenza A virus, tobacco etch virus (TEV), tobacco mosaic virus (TMV), murine hepatitis virus (MHV), influenza B virus, bacteriohages ϕ6, ϕX174, m13, λ and T2, and herpes simplex virus 1 (HSV). RNA viruses are shown in red and DNA viruses in blue. Two HIV-1 data points are shown in pink, one obtained from cell culture studies [4] (which is similar to the estimate obtained here using plasma RNA), and the estimate obtained here from PBMC DNA. All other mutation rates were taken from a review [4] except for Qβ [63]. Numerical values can be retrieved from these references. Other reverse-transcribing viruses are believed to exhibit mutation rates similar to those of RNA viruses, but these are not shown because previous work did not address the potentially strong contribution of A3 in vivo. Notice that the mutation rate axis is in log-scale, such that the HIV-1 mutation rate is 37 times higher than the second highest rate, and also substantially higher than the rate obtained from plasma RNA or under cell culture conditions. B. According to our interpretation, this discrepancy occurs because most A3-edited sequences are lethally mutated and are thus unable to reach the plasma. Therefore, analysis of plasma RNA sequences would lead to a gross underestimation of the actual HIV-1 mutation rate.

Comment in

References

    1. Perelson AS. Modelling viral and immune system dynamics. Nat Rev Immunol. 2002;2:28–36. - PubMed
    1. Fraser C, Lythgoe K, Leventhal GE, Shirreff G, Hollingsworth TD, Alizon S, et al. Virulence and pathogenesis of HIV-1 infection: an evolutionary perspective. Science. 2014;343:1243727 10.1126/science.1243727 - DOI - PMC - PubMed
    1. Smyth RP, Davenport MP, Mak J. The origin of genetic diversity in HIV-1. Virus Res. 2012;169:415–29. 10.1016/j.virusres.2012.06.015 - DOI - PubMed
    1. Sanjuán R, Nebot MR, Chirico N, Mansky LM, Belshaw R. Viral mutation rates. J Virol. 2010;84:9733–48. 10.1128/JVI.00694-10 - DOI - PMC - PubMed
    1. Lauring AS, Frydman J, Andino R. The role of mutational robustness in RNA virus evolution. Nat Rev Microbiol. 2013;11:327–36. 10.1038/nrmicro3003 - DOI - PMC - PubMed

Publication types