. 2015;6(8):755-65.
doi: 10.1080/21505594.2015.1043505. Epub 2015 Sep 16.

Helicobacter pylori neutrophil-activating protein induces release of histamine and interleukin-6 through G protein-mediated MAPKs and PI3K/Akt pathways in HMC-1 cells

Affiliations

Helicobacter pylori neutrophil-activating protein induces release of histamine and interleukin-6 through G protein-mediated MAPKs and PI3K/Akt pathways in HMC-1 cells

Chung-Che Tsai et al. Virulence. 2015.

Abstract

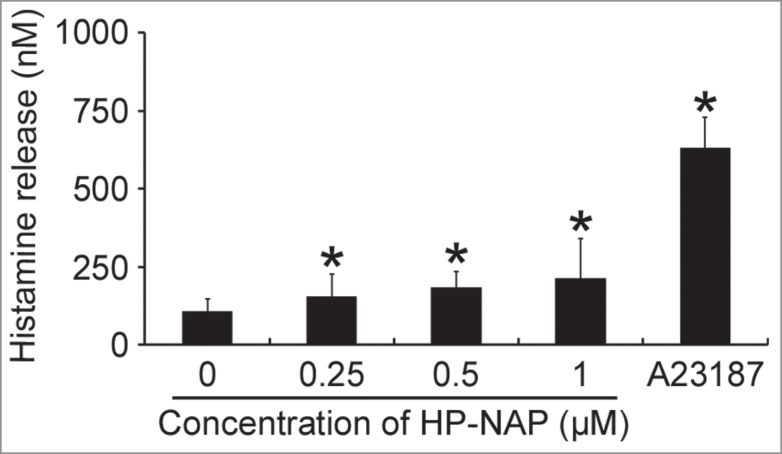
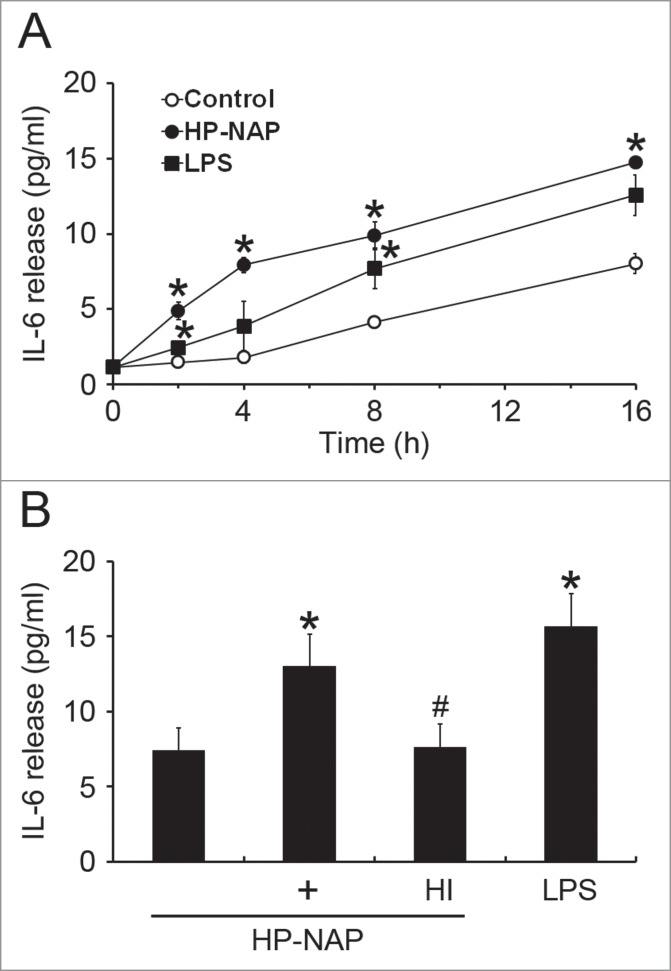
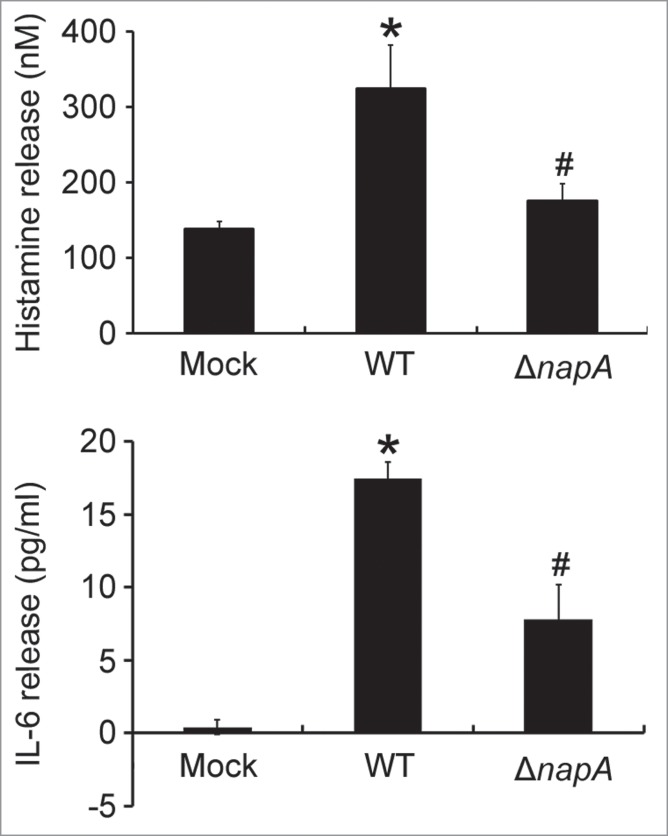
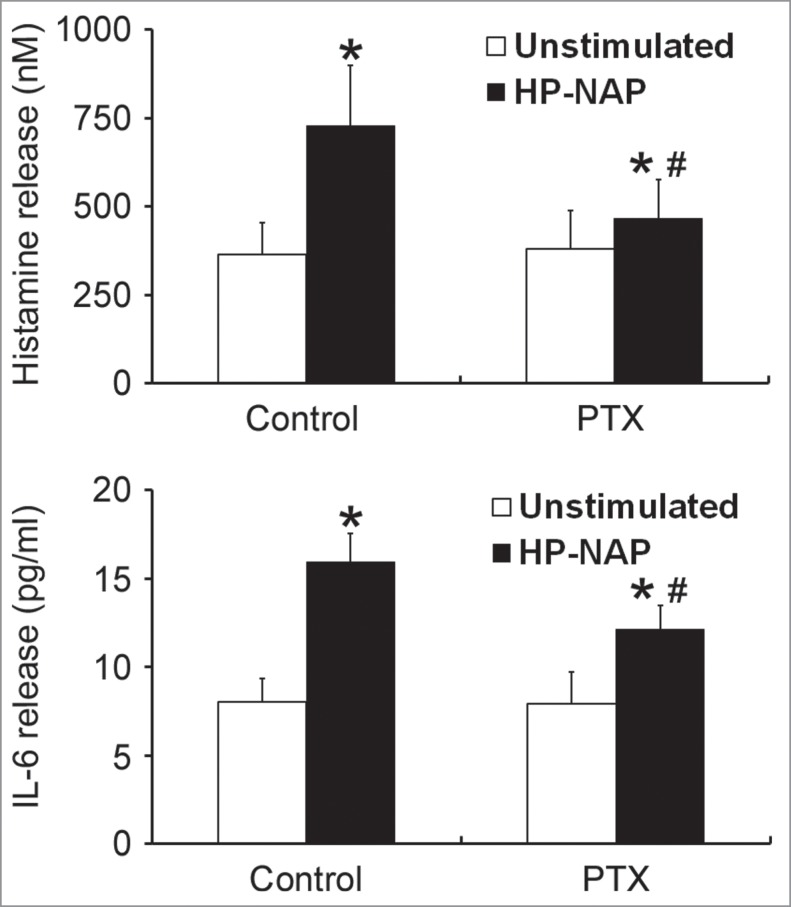
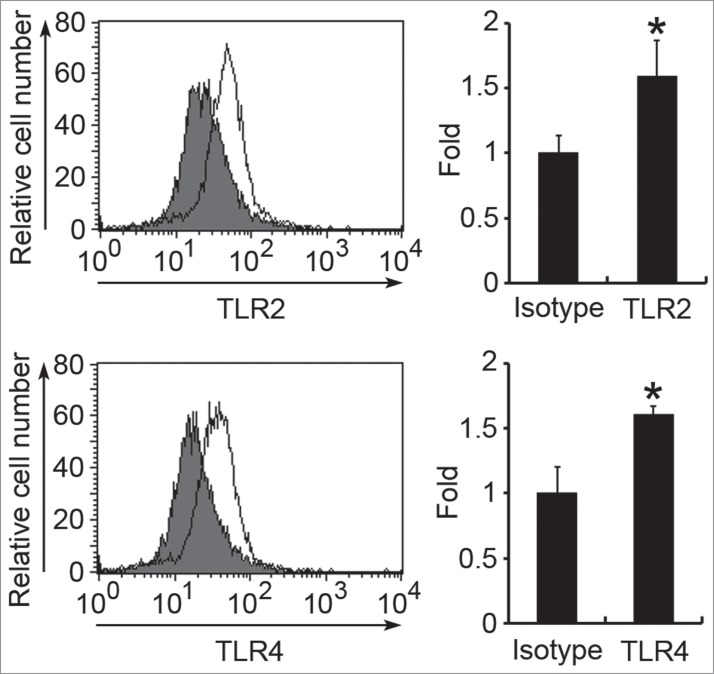
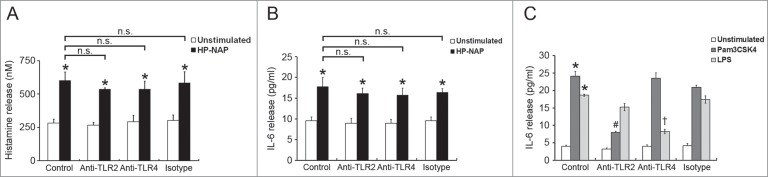
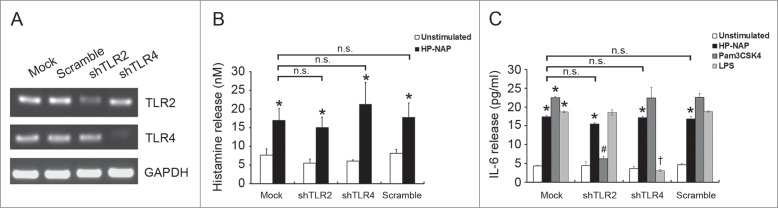
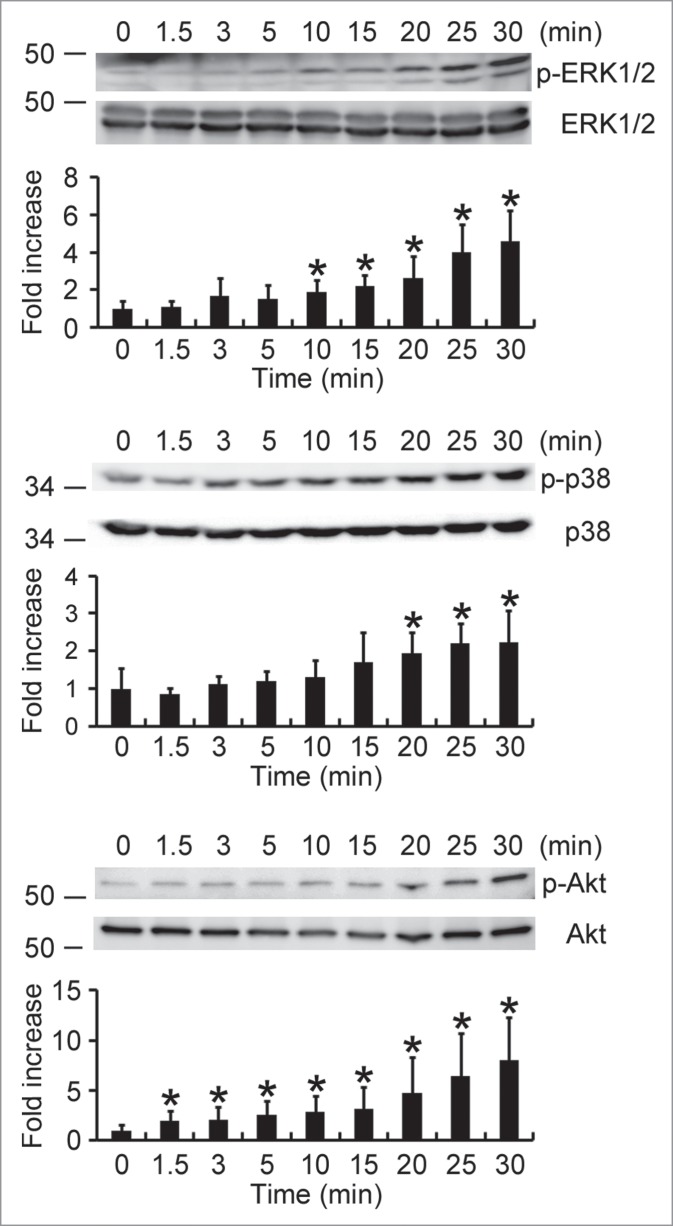
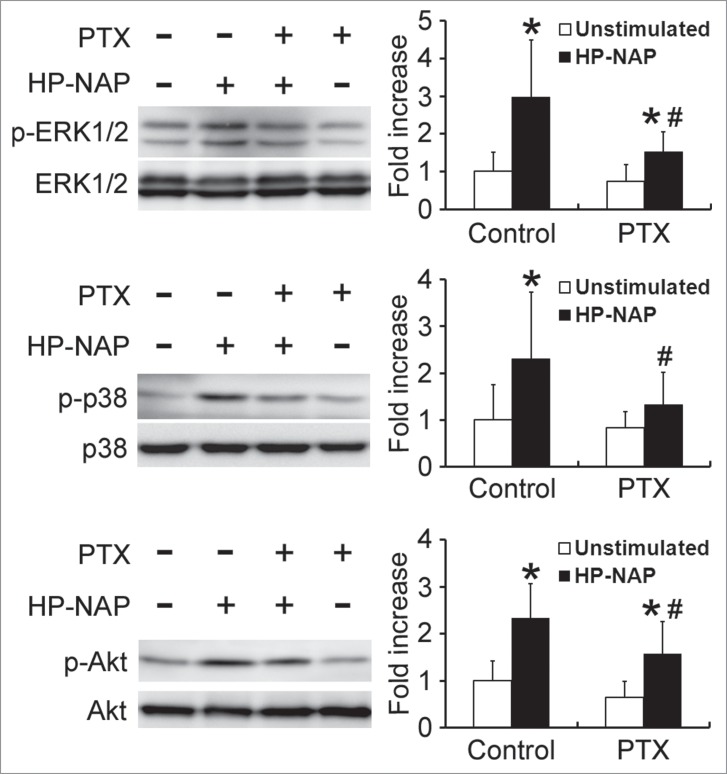
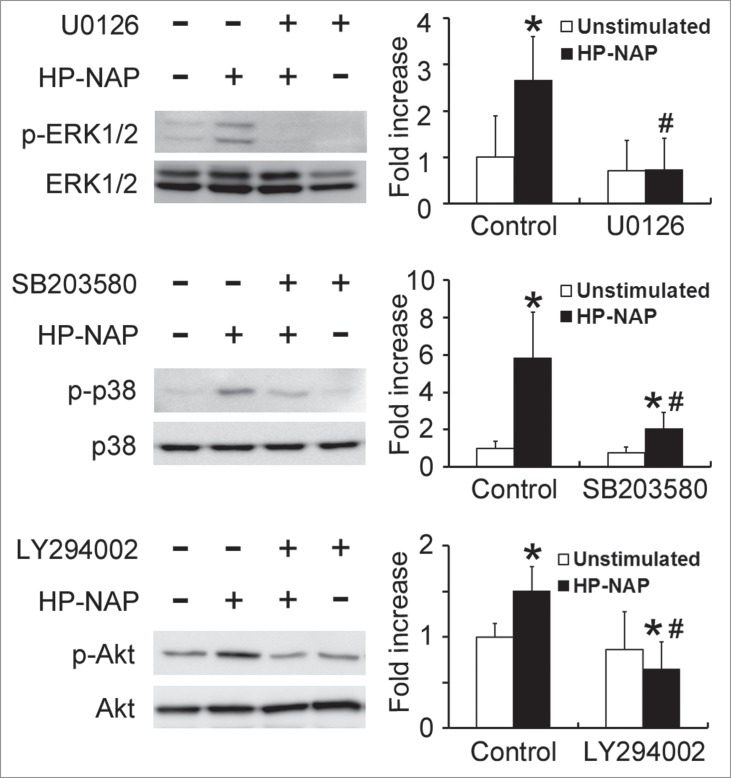
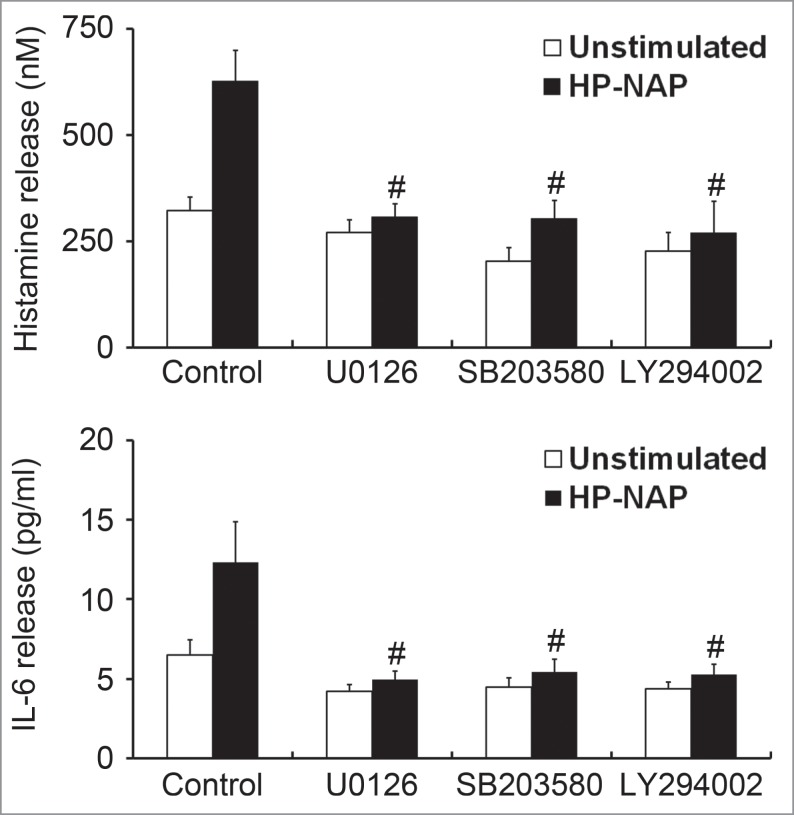
Helicobacter pylori neutrophil-activating protein (HP-NAP) activates several innate leukocytes including neutrophils, monocytes, and mast cells. It has been reported that HP-NAP induces degranulation and interleukin-6 (IL-6) secretion of rat peritoneal mast cells. However, the molecular mechanism is not very clear. Here, we show that HP-NAP activates human mast cell line-1 (HMC-1) cells to secrete histamine and IL-6. The secretion depends on pertussis toxin (PTX)-sensitive heterotrimeric G proteins but not on Toll-like receptor 2. Moreover, HP-NAP induces PTX-sensitive G protein-mediated activation of extracellular signal-regulated kinase 1/2 (ERK1/2), p38-mitogen-activated protein kinase (p38 MAPK), and Akt in HMC-1 cells. Inhibition of ERK1/2, p38 MAPK, or phosphatidylinositol 3-kinase (PI3K) suppresses HP-NAP-induced release of histamine and IL-6 from HMC-1 cells. Thus, the activation of HMC-1 cells by HP-NAP is through Gi-linked G protein-coupled receptor-mediated MAPKs and PI3K/Akt pathways.

Keywords: HP-NAP; Helicobacter pylori neutrophil-activating protein; PTX; TLR2; mast cells.


Figures

Figure 1.
Figure 1.
Induction of histamine release from HMC-1 cells by HP-NAP. HMC-1 cells were left unstimulated or stimulated with indicated concentrations of HP-NAP or 10 μM Ca2+ ionophore A23187 as a positive control at 37°C for 30 min. Histamine release from HMC-1 cells was determined by measuring the concentration of histamine in the cell-free supernatants as described in Materials and Methods. Data were represented as the mean ± SD of 4 independent experiments. *P < 0.05 as compared with unstimulated cells.
Figure 2.
Figure 2.
Induction of IL-6 release from HMC-1 cells by HP-NAP. (A) HMC-1 cells were left unstimulated or stimulated with 1 μM HP-NAP or 10 μg/mL E. coli LPS as a positive control at 37°C for the indicated time. IL-6 release from HMC-1 cells was determined by measuring the concentration of IL-6 in the cell-free supernatants as described in Materials and Methods. Data were represented as the mean ± SD of 3 independent experiments. *P < 0.05 as compared with unstimulated control cells at the same time point. (B) HMC-1 cells were left unstimulated or stimulated with 1 μM HP-NAP, 1 μM heat-inactivated (HI) HP-NAP, or 10 μg/mL E. coli LPS at 37°C for 16 h for measurement of IL-6 release as described in (A). Data were represented as the mean ± SD of 4 independent experiments. *P < 0.05 as compared with unstimulated control cells; #P < 0.05 as compared with HP-NAP-stimulated cells.
Figure 3.
Figure 3.
Induction of histamine and IL-6 release from HMC-1 cells infected with the wild-type H. pylori and isogenic napA knockout H. pylori mutant strains. HMC-1 cells were left uninfected (mock) or infected with wild-type (WT) H. pylori NCTC 11637 strain and its isogenic napA knockout mutant strain (ΔnapA) at 37°C for 30 min or 4 h for measurement of the release of histamine or IL-6, respectively. Release of histamine and IL-6 from HMC-1 cells was determined as described in Figures 1 and 2, respectively. Data were represented as the mean ± SD of 3 independent experiments *P < 0.05 as compared with uninfected mock cells; #P < 0.05 as compared with wild-type H. pylori-infected cells.
Figure 4.
Figure 4.
Inhibition of HP-NAP-induced release of histamine and IL-6 from HMC-1 cells by the treatment with PTX. HMC-1 cells were pretreated with 100 ng/mL PTX at 37°C for 16 h and then stimulated with 1 μM HP-NAP at 37°C for 30 min or 16 h for measurement of the release of histamine or IL-6, respectively. Release of histamine and IL-6 from HMC-1 cells was determined as described in Figure 3. Data were represented as the mean ± SD of 6 independent experiments for histamine release and 5 independent experiments for IL-6 release. *P < 0.05 as compared with unstimulated cells in each group; #P < 0.05 as compared with HP-NAP-stimulated cells in the control group.
Figure 5.
Figure 5.
Surface expression of TLR2 and TLR4 on HMC-1 cells. The surface expression of TLR2 or TLR4 on HMC-1 cells was determined by flow cytometry using anti-TLR2, anti-TLR4, or mouse IgG2a isotype control antibodies. Data in the left panel show the representative histograms. Filled histograms represent isotype control and open histograms represent TLR expression. Data in the right panel show the fold differences of mean fluorescent intensity (MFI) with respect to that of the isotype control and are represented as the mean ± SD of 3 independent experiments. *P < 0.05 as compared with the isotype control.
Figure 6.
Figure 6.
Effect of TLR2 and TLR4 neutralizing antibodies on HP-NAP-induced histamine and IL-6 release from HMC-1. HMC-1 cells were pretreated with 10 μg/mL of either anti-TLR2, anti-TLR4, or mouse IgG2a isotype antibodies at 37°C for 1 h. Then, the cells were stimulated with 1 μM HP-NAP at 37°C for 30 min or 16 h for measurement of histamine release (A) or IL-6 release (B), respectively, or stimulated with 10 μg/mL Pam3CSK4 or 10 μg/mL E. coli LPS at 37°C for 16 h for measurement of IL-6 release (C). Release of histamine and IL-6 from HMC-1 cells was determined as described in Figure 3. Data were represented as the mean ± SD of 3 independent experiments. *P < 0.05 as compared with unstimulated cells in each group; #P < 0.05 as compared with Pam3CSK4-stimulated cells in the isotype control group; P < 0.05 as compared with LPS-stimulated cells in the isotype control group; n.s., non-significant.
Figure 7.
Figure 7.
Effect of knockdown of TLR2 and TLR4 on HP-NAP-induced histamine and IL-6 release from HMC-1. HMC-1 cells were left untransduced (mock) or transduced with lentiviral particles bearing either scramble control shRNA or shRNA specific to TLR2 (shTLR2) or TLR4 (shTLR4) for 2 d. Lentivirally transduced HMC-1 cells were then under puromycin selection for 2 d The mRNA expressions of TLR2, TLR4, and GAPDH, as a loading control, in these cells were analyzed by using RT-PCR (A) as described in Materials and Methods. Untransduced or TLR-specific lentivirally transduced HMC-1 cells were stimulated with 1 μM HP-NAP at 37°C for 30 min for measurement of histamine release (B) or stimulated with 1 μM HP-NAP, 10 μg/mL Pam3CSK4, or 10 μg/mL E. coli LPS at 37°C for 16 h for measurement of IL-6 release (C). Release of histamine and IL-6 from HMC-1 cells were determined as described in Figure 3. Data were represented as the mean ± SD of 3 independent experiments. *P < 0.05 as compared with unstimulated cells in each group; #P < 0.05 as compared with Pam3CSK4-stimulated cells in the scramble control group; P < 0.05 as compared with LPS-stimulated cells in the scramble control group; n.s., non-significant.
Figure 8.
Figure 8.
Activation of ERK1/2, p38 MAPK, and Akt in HMC-1 cells induced by HP-NAP. Serum-starved HMC-1 cells were left unstimulated or stimulated with 1 μM HP-NAP at 37°C for the indicated time and then lysed. Whole cell lysates were subjected to immunoblotting for phospho-ERK1/2, ERK, phospho-p38, p38, phospho-Akt, and Akt. The quantitative results were expressed in fold increase by defining the amounts of the phosphorylated proteins in unstimulated cells as 1 and represented as the mean ± SD of at least 4 independent experiments. *P < 0.05 as compared with unstimulated cells.
Figure 9.
Figure 9.
Inhibition of HP-NAP-induced activation of ERK1/2, p38 MAPK, and Akt in HMC-1 cells by the treatment with PTX. Serum-starved HMC-1 cells were not pretreated (control) or pretreated with 100 ng/mL PTX at 37°C for 16 h and then left unstimulated or stimulated with 1 μM HP-NAP at 37°C for 30 min. Cells were lysed and whole cell lysates were subjected to immunoblotting for phospho-ERK1/2, ERK, phospho-p38, p38, phospho-Akt, and Akt. The quantitative results were expressed in fold increase by defining the amounts of the phosphorylated proteins in cells without any treatment as 1 and represented as the mean ± SD of at least 5 independent experiments. *P < 0.05 as compared with unstimulated cells in each group; #P < 0.05 as compared with HP-NAP-stimulated control cells.
Figure 10.
Figure 10.
Inhibition of HP-NAP-induced activation of ERK1/2, p38 MAPK, and Akt in HMC-1 cells by the treatment with U0126, SB203580, and LY294002. Serum-starved HMC-1 cells were not pretreated (control) or pretreated with 5 μM U0126, a MEK1/2 inhibitor, 10 μM SB203580, a p38 MAPK inhibitor, or 10 μM LY294002, a PI3K inhibitor, at 37°C for 1 h and then left unstimulated or stimulated with 1 μM HP-NAP at 37°C for 30 min. Cells were lysed and whole cell lysates were subjected to immunoblotting for phospho-ERK1/2, ERK, phospho-p38, p38, phospho-Akt, and Akt. The quantitative results were expressed in fold increase by defining the amounts of the phosphorylated proteins in cells without any treatment as 1 and represented as the mean ± SD of 3 independent experiments. *P < 0.05 as compared with unstimulated cells in each group; #P < 0.05 as compared with HP-NAP-stimulated control cells.
Figure 11.
Figure 11.
Inhibition of HP-NAP-induced release of histamine and IL-6 from HMC-1 cells by the treatment with U0126, SB203580, and LY294002. Serum-starved HMC-1 cells were not pretreated (control) or pretreated with 5 μM U0126, a MEK1/2 inhibitor; 10 μM SB203580, a p38-MAPK inhibitor; or 10 μM LY294002, a PI3K inhibitor at 37°C for 1 h and then left unstimulated or stimulated with 1 μM HP-NAP at 37°C for 30 min or 16 h for measurement of the release of histamine or IL-6, respectively. Release of histamine and IL-6 from HMC-1 cells was determined as described in Figure 3. Data were represented as the mean ± SD of 3 independent experiments. *P < 0.05 as compared with unstimulated control cells; #P < 0.05 as compared with HP-NAP-stimulated control cells.

Similar articles

Cited by

References

    1. Dunn BE, Cohen H, Blaser MJ. Helicobacter pylori. Clin Microbiol Rev 1997; 10:720-41; PMID:9336670. - PMC - PubMed
    1. Fu HW. Helicobacter pylori neutrophil-activating protein: from molecular pathogenesis to clinical applications. World J Gastroenterol 2014; 20:5294-301; PMID:24833859; http://dx.doi.org/ 10.3748/wjg.v20.i18.5294. - DOI - PMC - PubMed
    1. Evans DJ Jr., Evans DG, Takemura T, Nakano H, Lampert HC, Graham DY, Granger DN, Kvietys PR. Characterization of a Helicobacter pylori neutrophil-activating protein. Infect Immun 1995; 63:2213-20; PMID:7768601. - PMC - PubMed
    1. Wang CA, Liu YC, Du SY, Lin CW, Fu HW. Helicobacter pylori neutrophil-activating protein promotes myeloperoxidase release from human neutrophils. Biochem Biophys Res Commun 2008; 377:52-6; PMID:18823946; http://dx.doi.org/ 10.1016/j.bbrc.2008.09.072. - DOI - PubMed
    1. Polenghi A, Bossi F, Fischetti F, Durigutto P, Cabrelle A, Tamassia N, Cassatella MA, Montecucco C, Tedesco F, de Bernard M. The neutrophil-activating protein of Helicobacter pylori crosses endothelia to promote neutrophil adhesion in vivo. J Immunol 2007; 178:1312-20; http://dx.doi.org/ 10.4049/jimmunol.178.3.1312. - DOI - PubMed

Publication types

MeSH terms

LinkOut - more resources