. 2015 Oct 28;4(15):2269-80.
doi: 10.1002/adhm.201500441. Epub 2015 Sep 16.

Effect of shape, size, and aspect ratio on nanoparticle penetration and distribution inside solid tissues using 3D spheroid models

Affiliations

Effect of shape, size, and aspect ratio on nanoparticle penetration and distribution inside solid tissues using 3D spheroid models

Rachit Agarwal et al. Adv Healthc Mater. .

Abstract

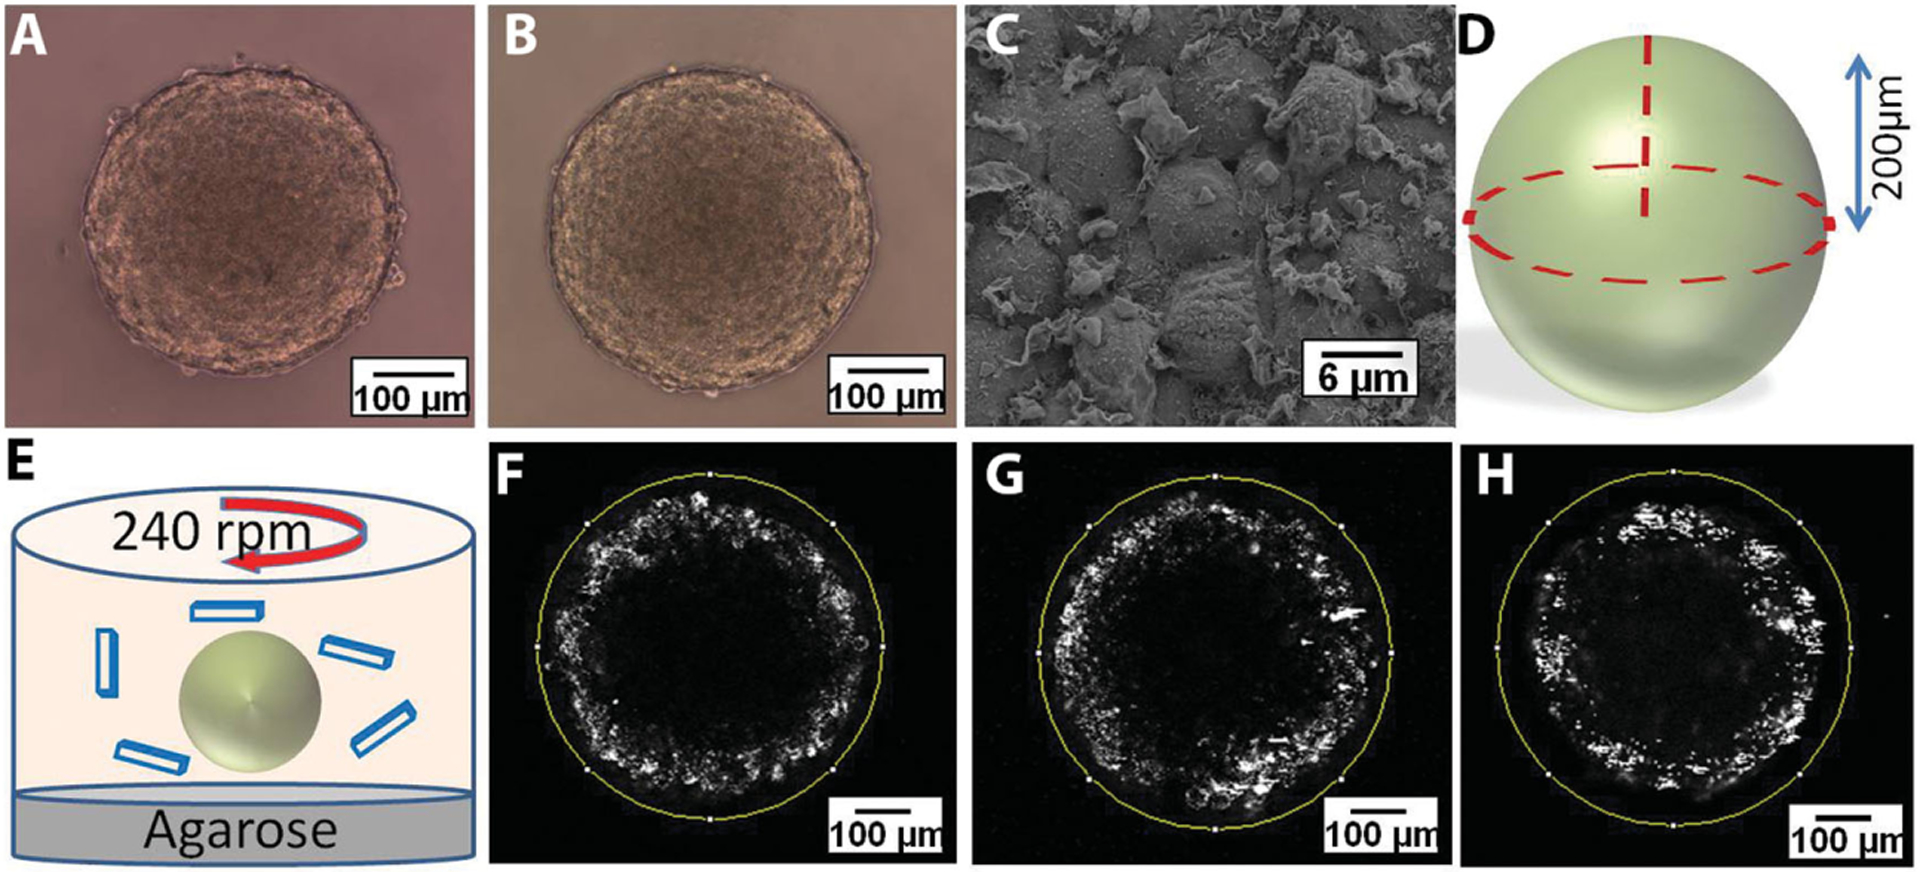
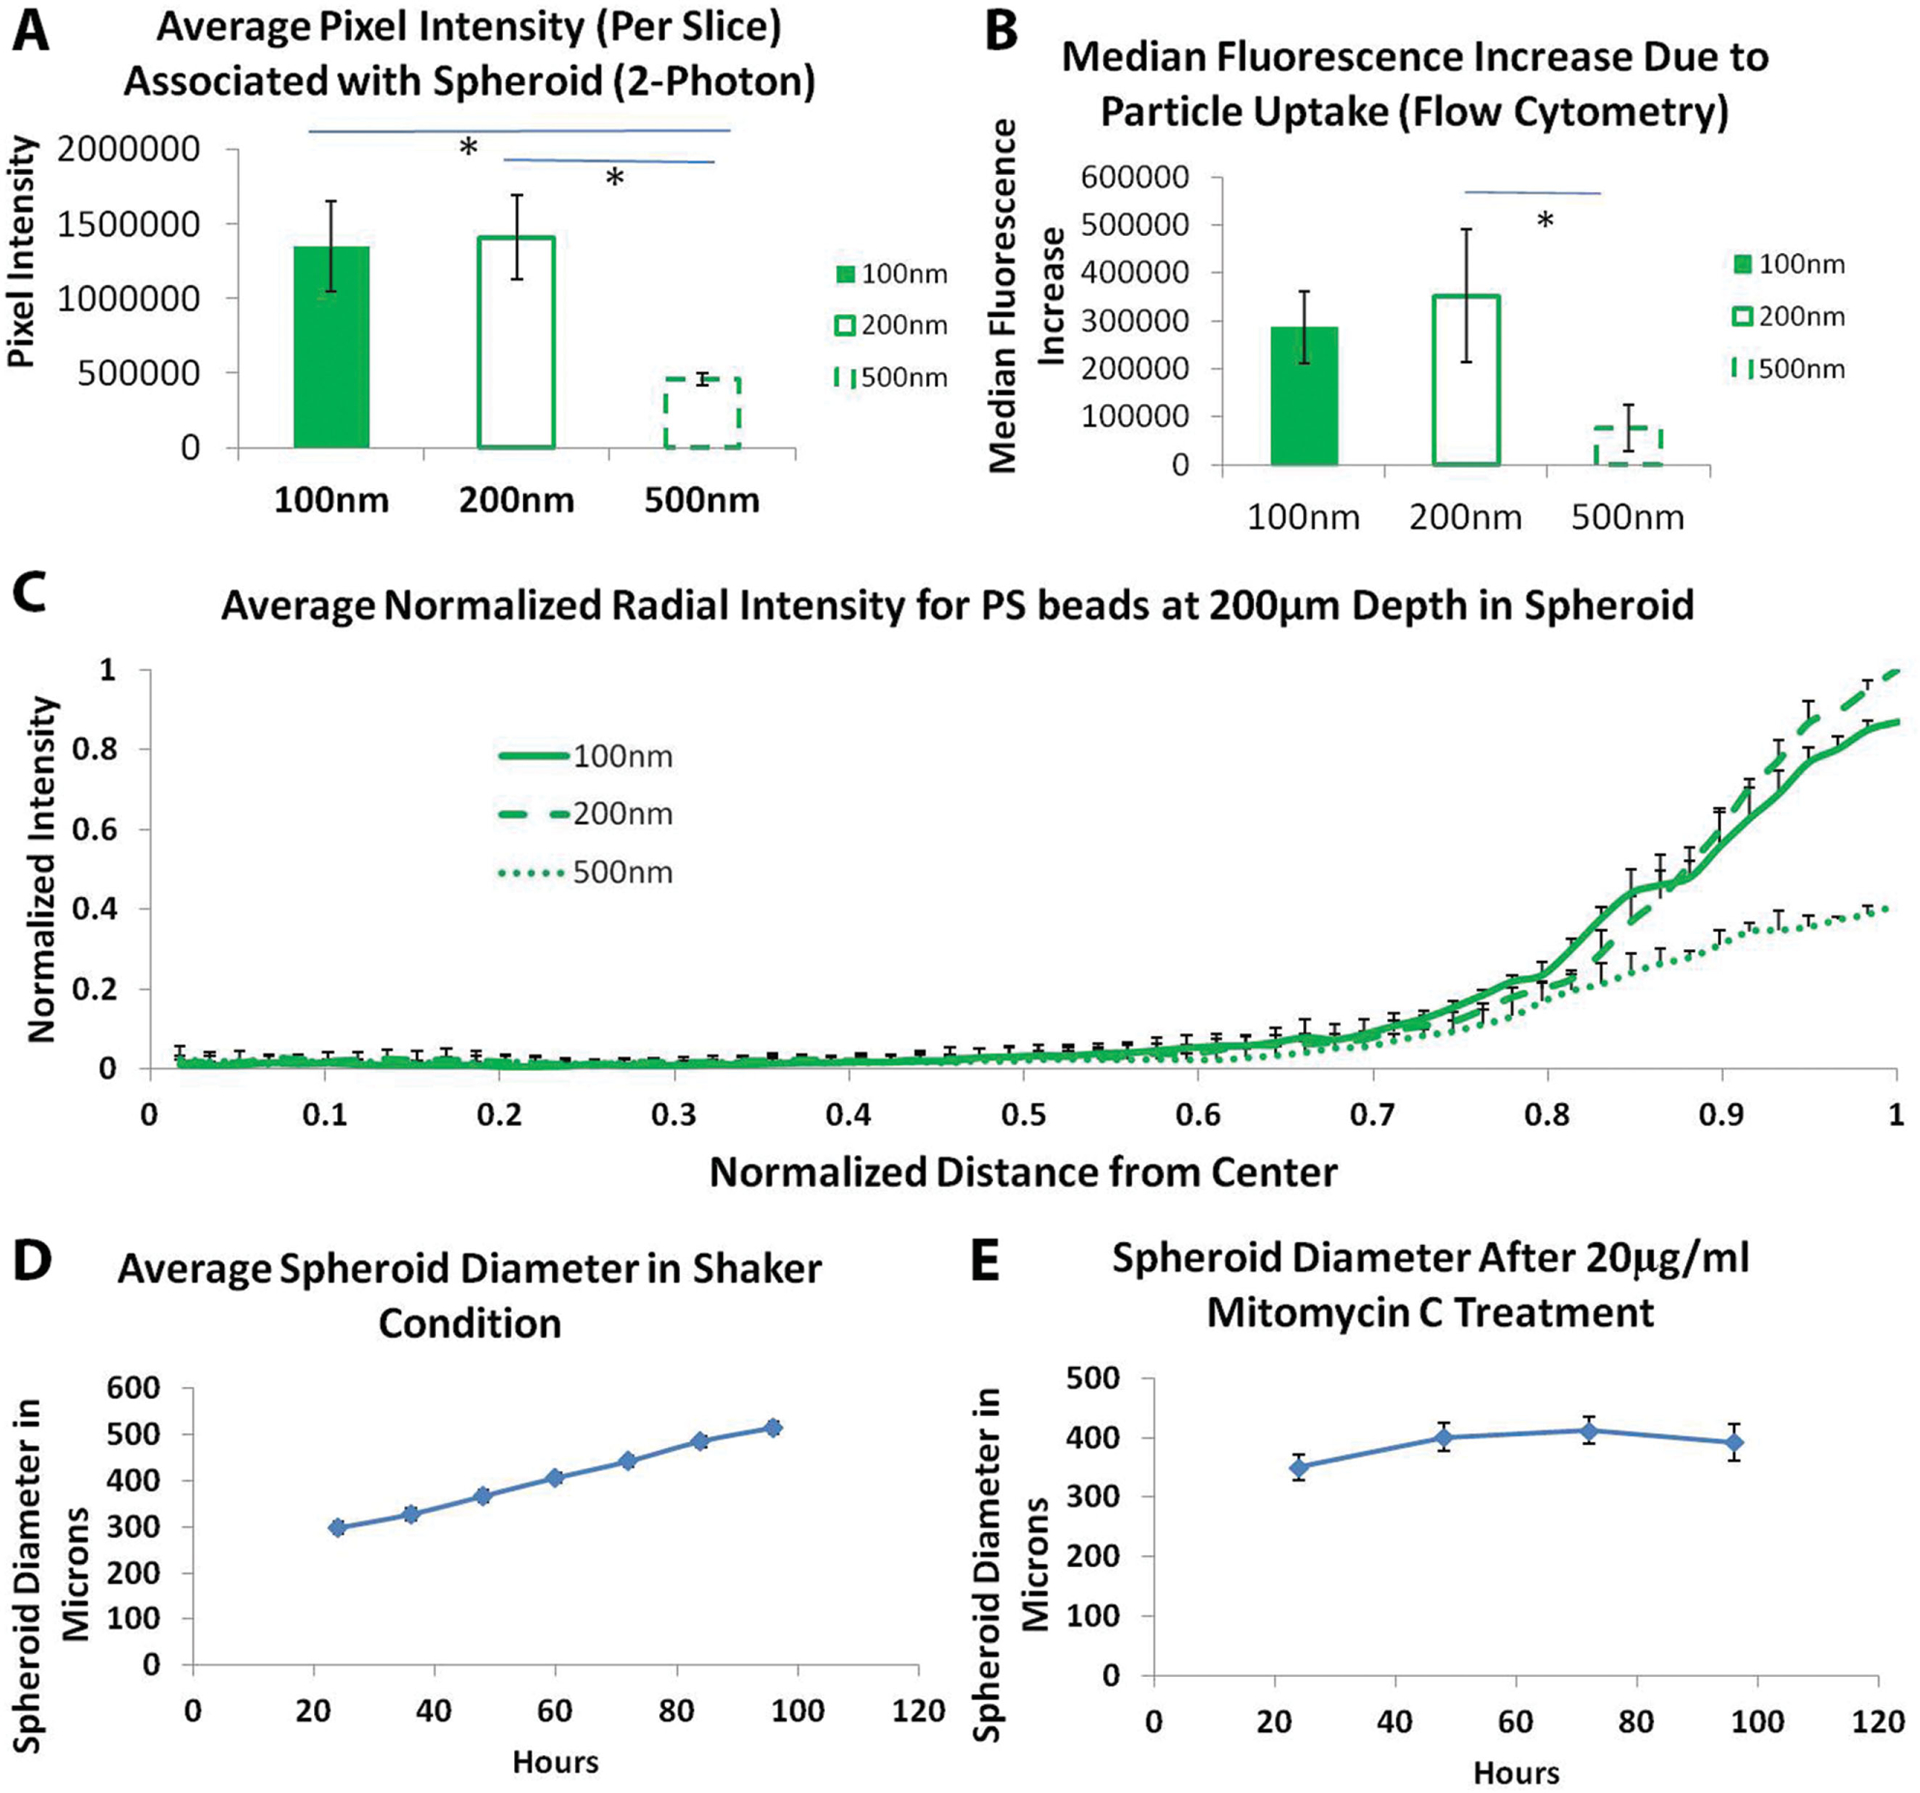
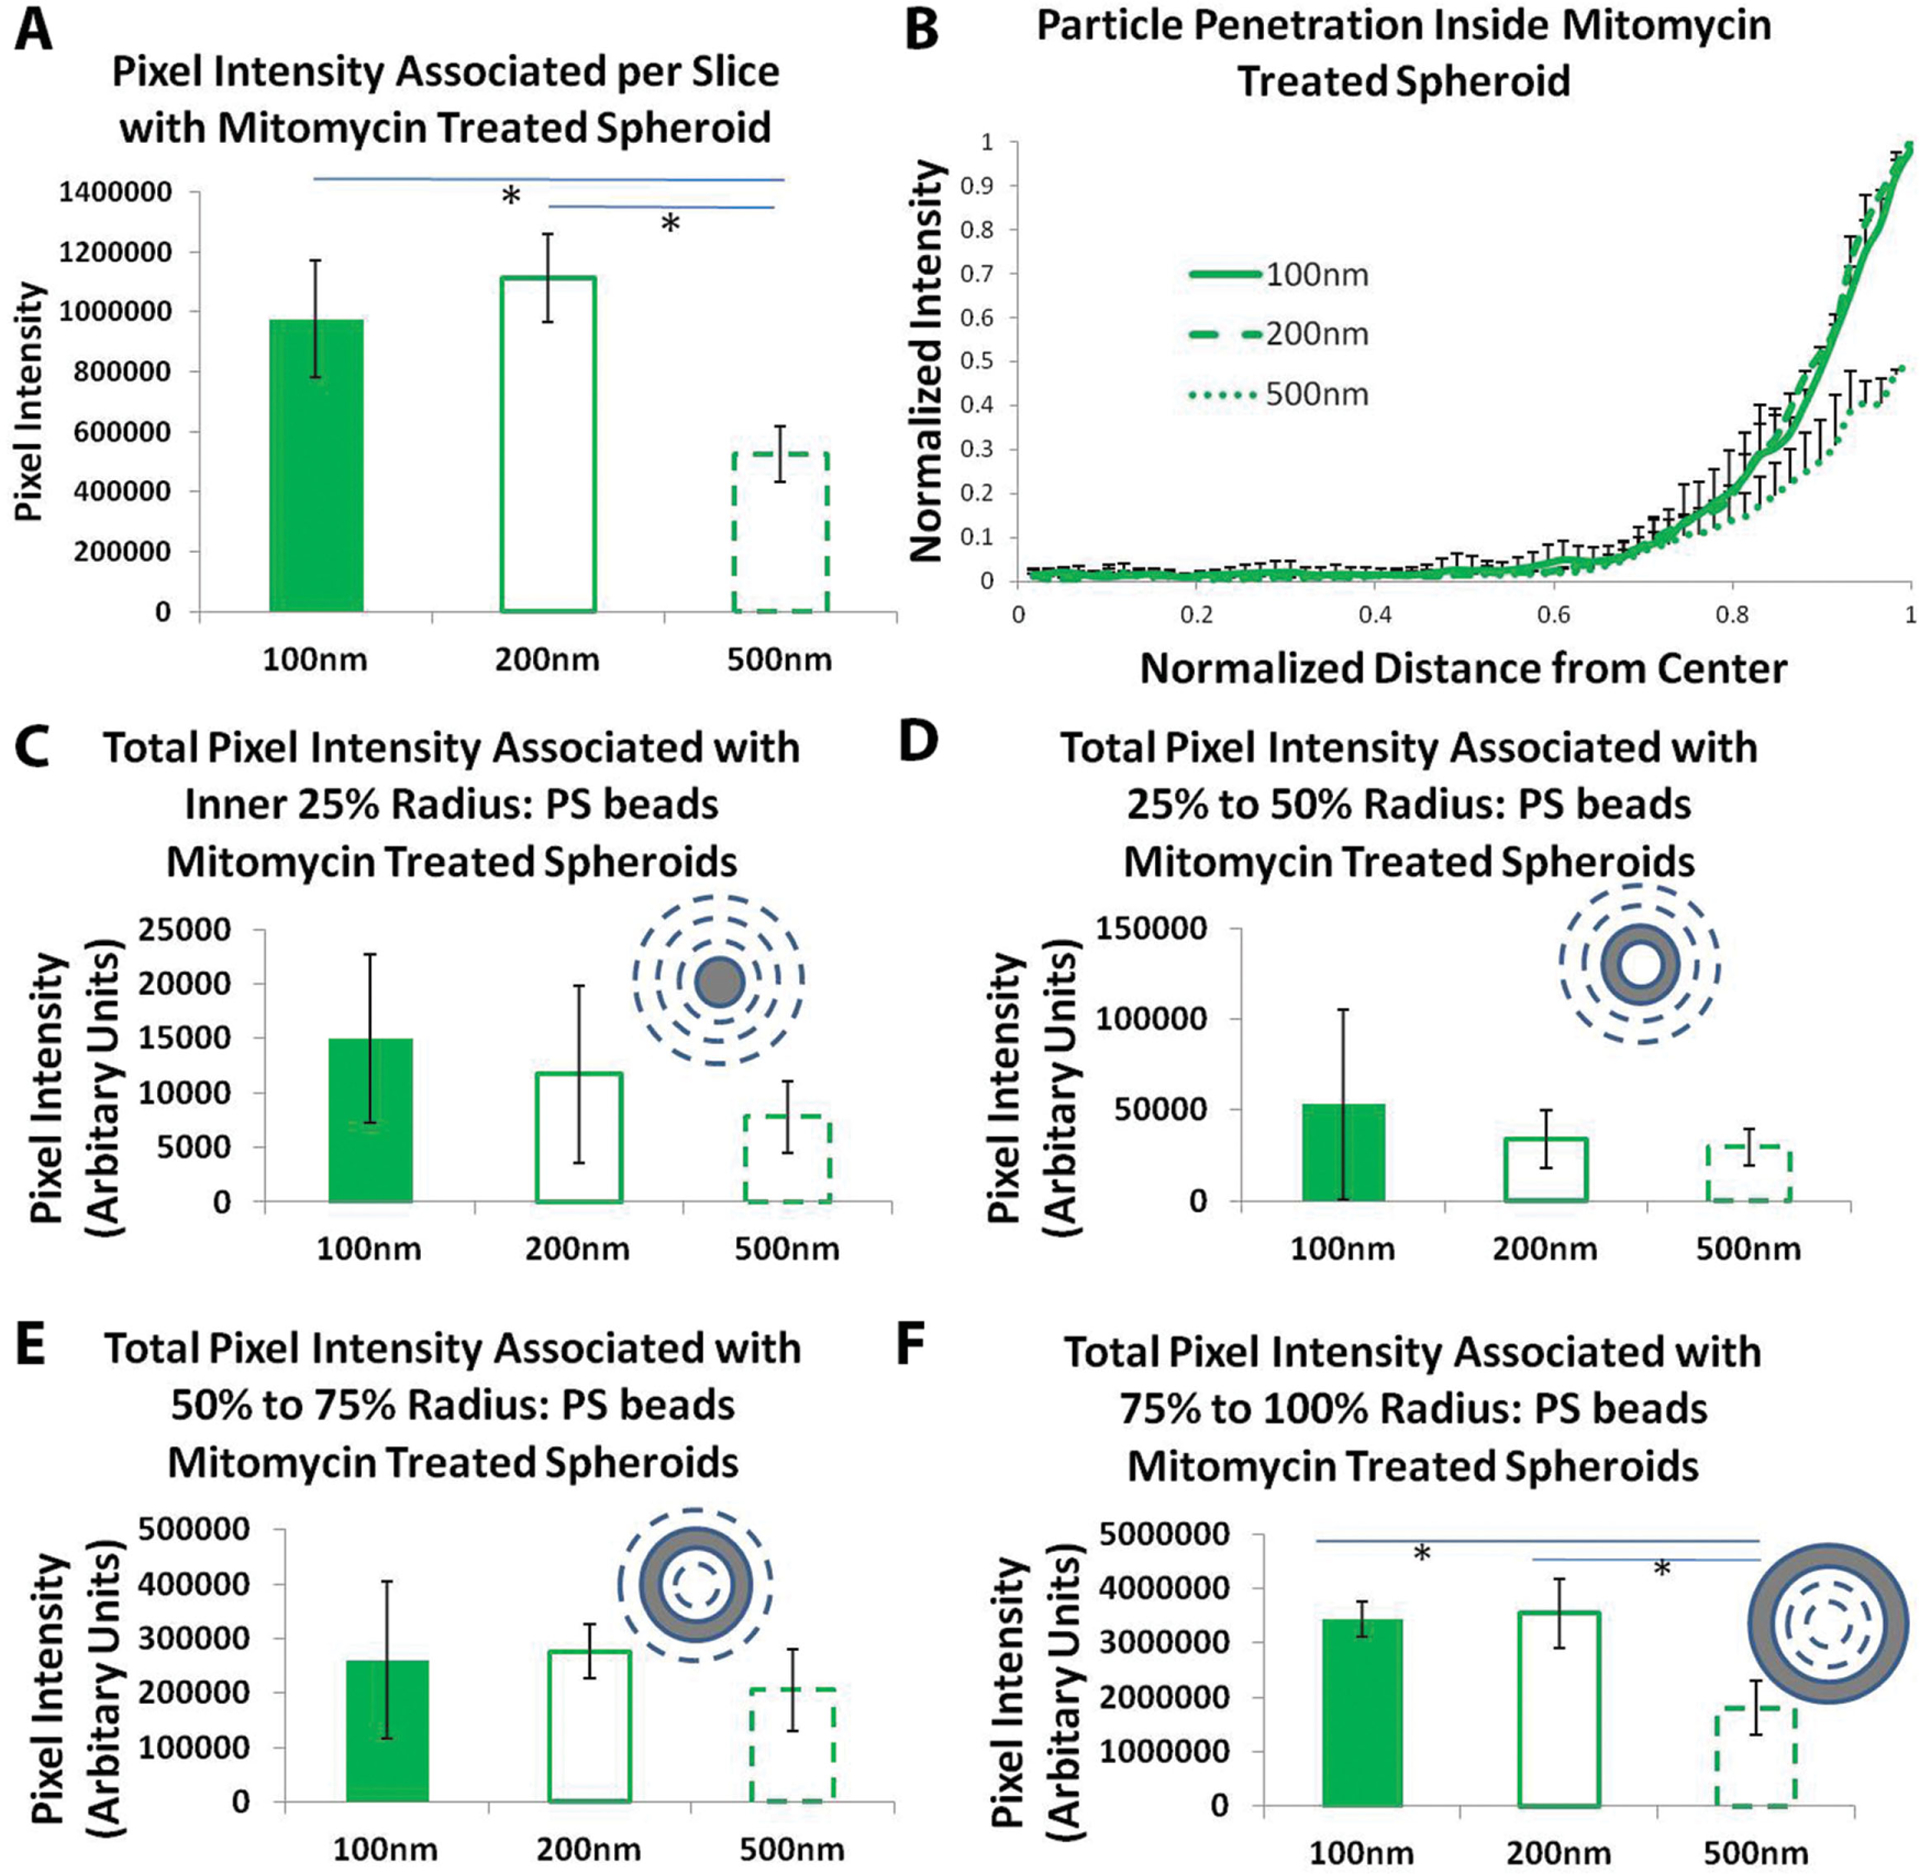
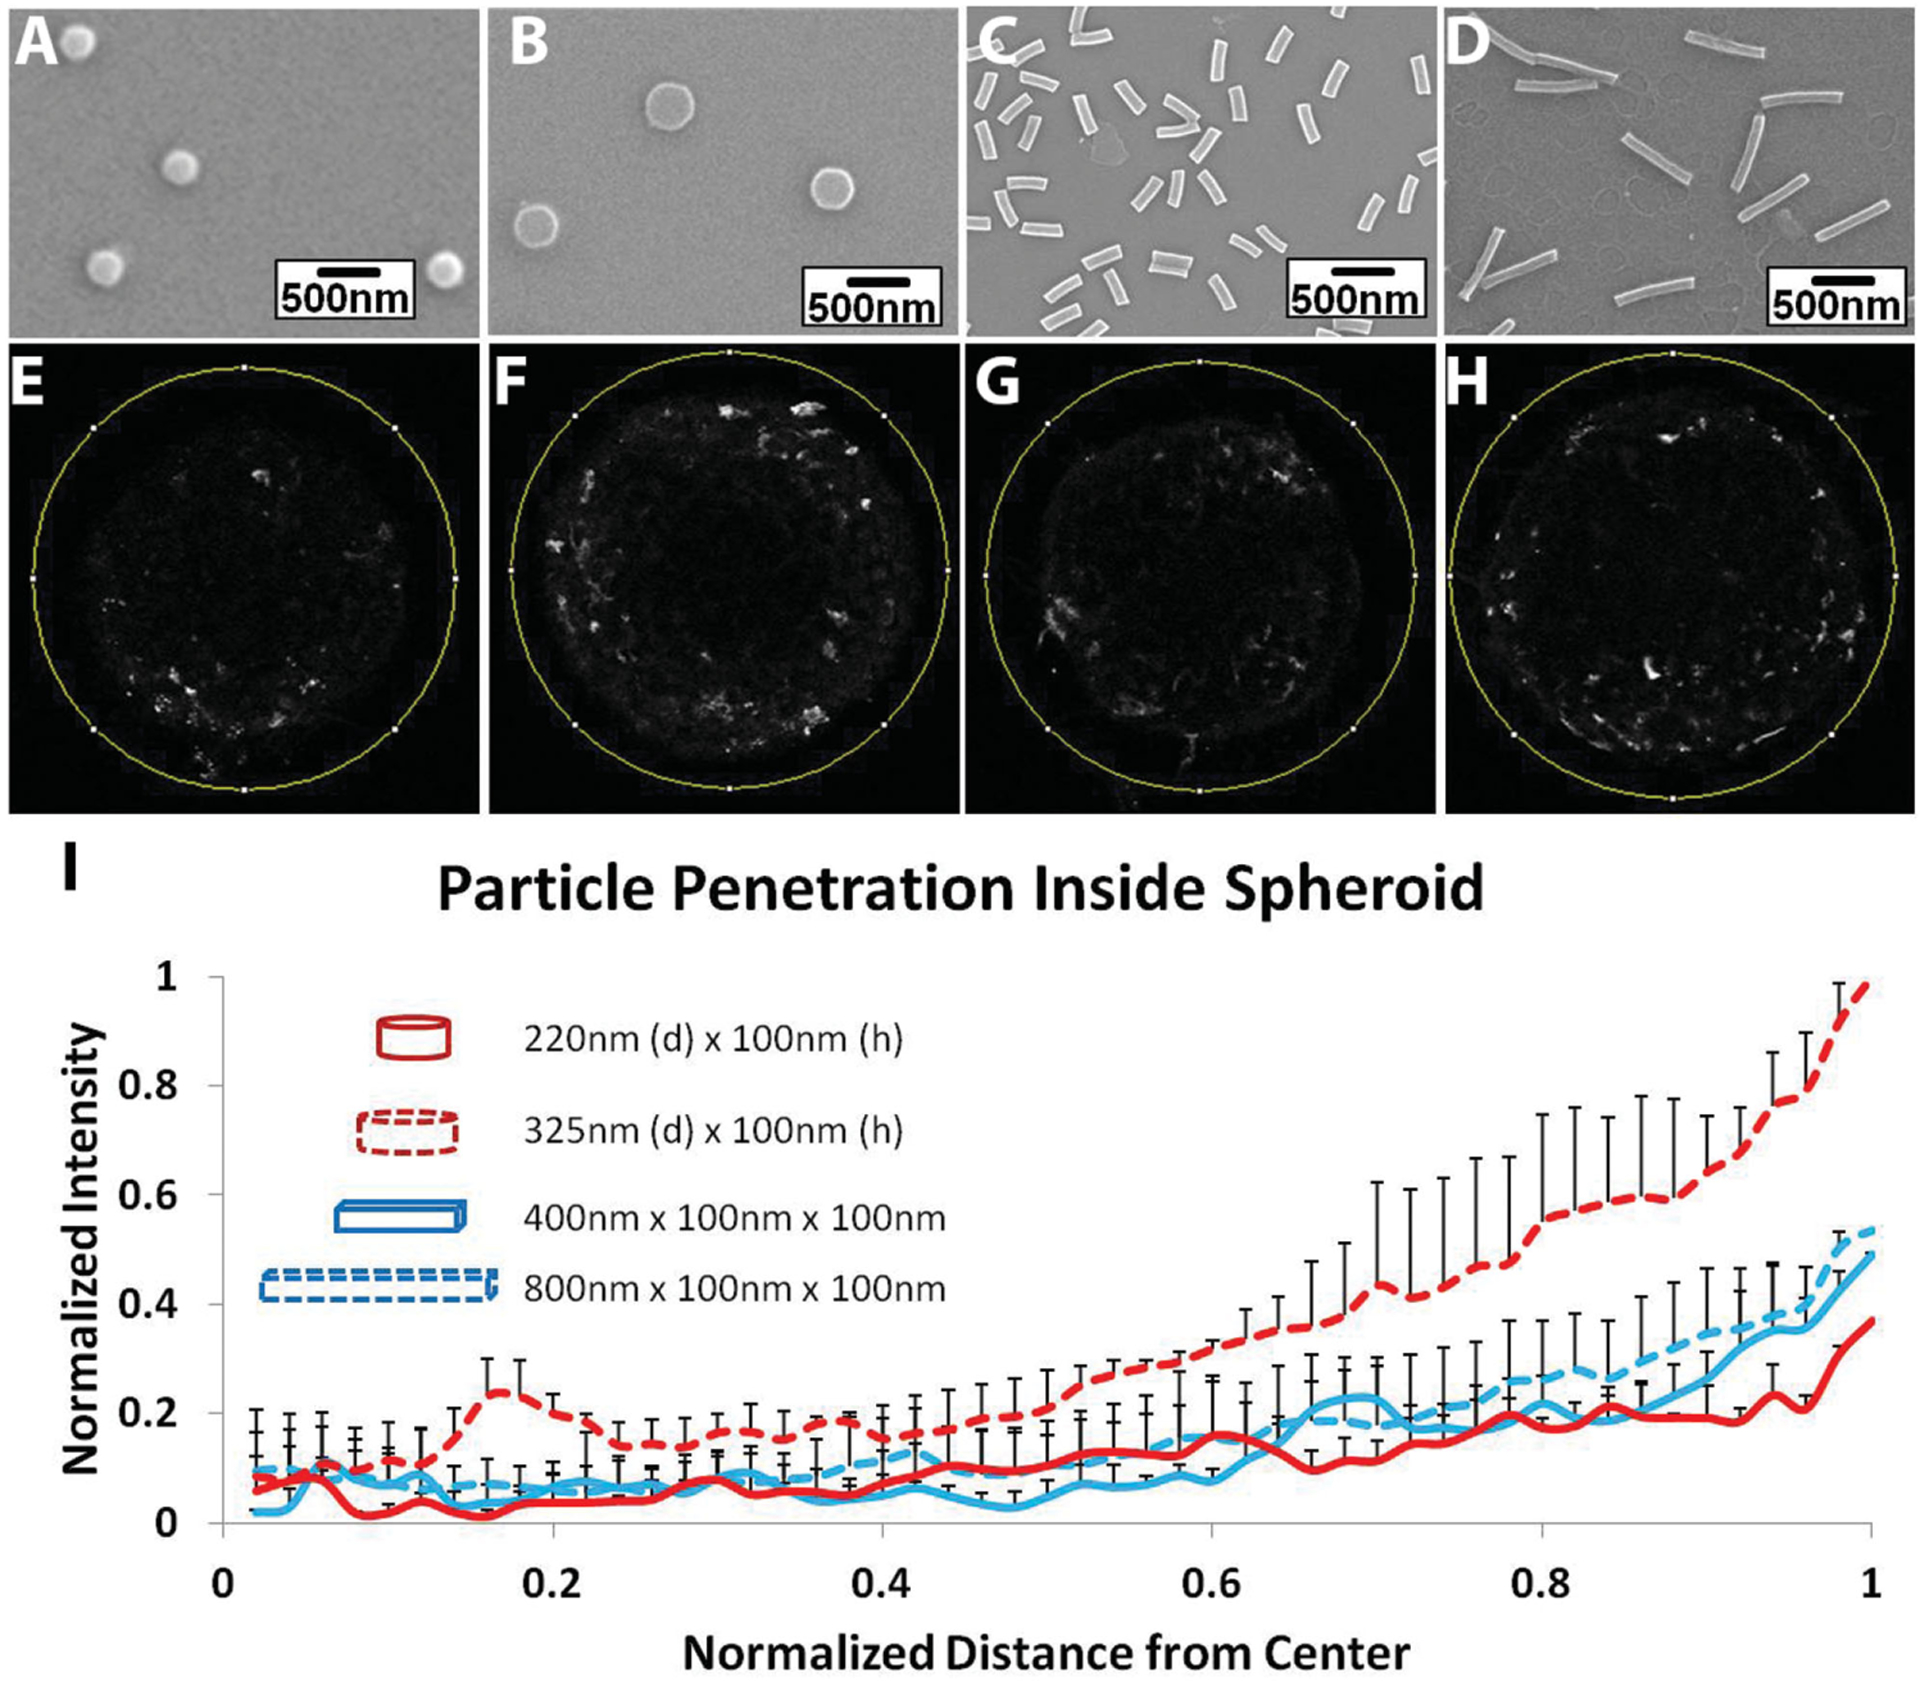
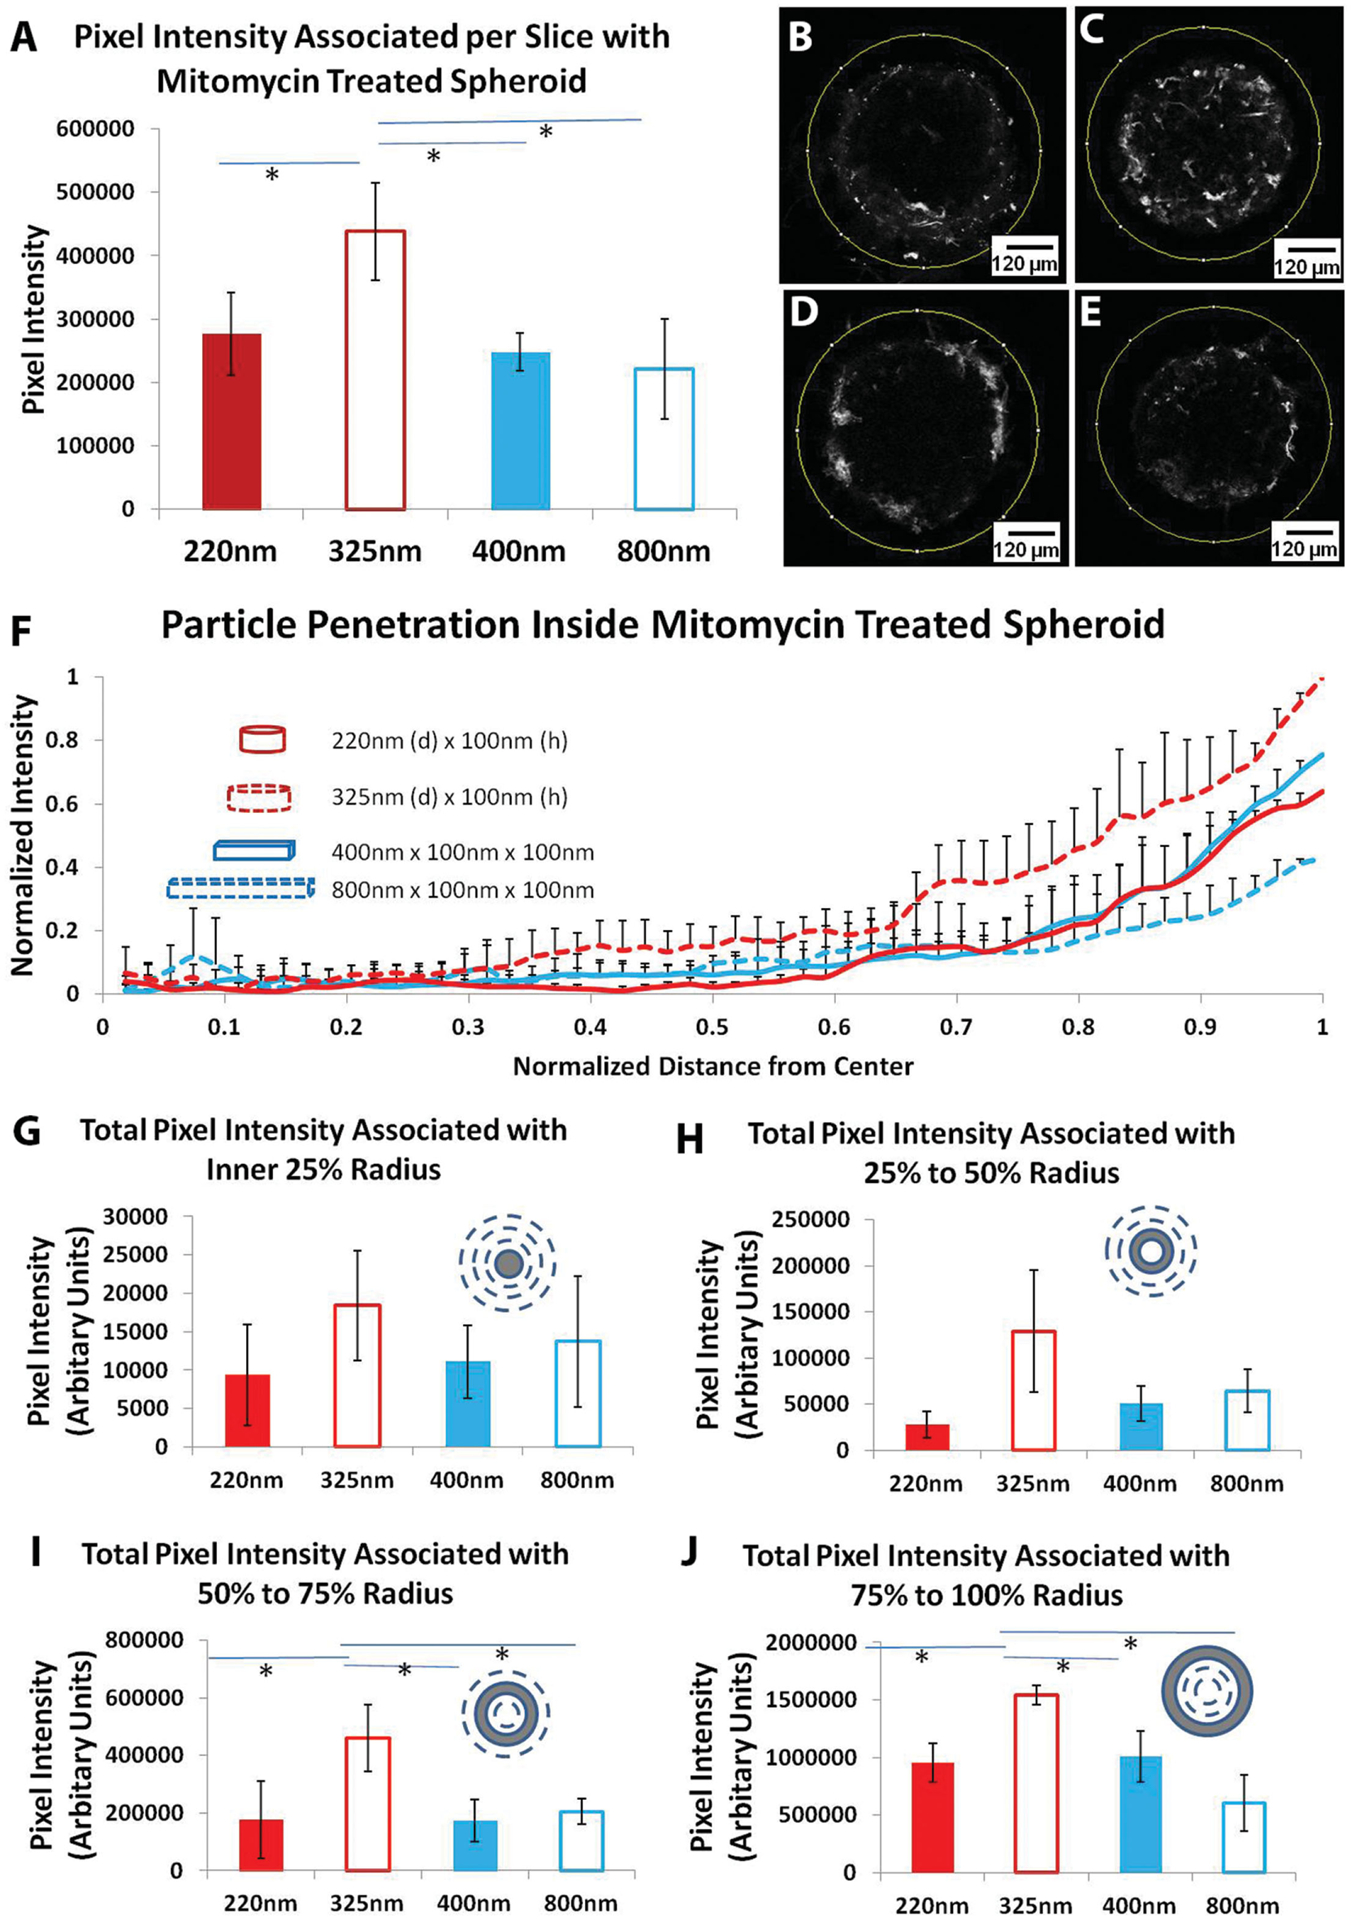
Efficient penetration and uniform distribution of nanoparticles (NPs) inside solid tissues and tumors is paramount to their therapeutic and diagnostic success. While many studies have reported the effect of NP size and charge on intratissue distribution, role of shape, and aspect ratio on NP transport inside solid tissues remain unclear. Here experimental and theoretical studies are reported on how nanoscale geometry of Jet and Flash Imprint Lithography-fabricated, polyethylene-glycol-based anionic nanohydrogels affect their penetration and distribution inside 3D spheroids, a model representing the intervascular region of solid, tumor-like tissues. Unexpectedly, low aspect ratio cylindrical NPs (H/D ≈0.3; disk-like particles, 100 nm height, and 325 nm diameter) show maximal intratissue delivery (>50% increase in total cargo delivered) and more uniform penetration compared to nanorods or smaller NPs of the same shape. This is in contrast to spherical NPs where smaller NP size resulted in deeper, more uniform penetration. Our results provide fundamental new knowledge on NP transport inside solid tissues and further establish shape and aspect ratio as important design parameters in developing more efficient, better penetrating, nanocarriers for drug, or contrast-agent delivery.

Keywords: nanodisks; nanoparticle shape; nanorods; spheroids; tumor distribution.


Figures

Figure 1.
Figure 1.
Light microscopy images of HEK spheroids cultured over 2% agarose gel under A) static conditions and B) rotatory shaker at 240 rpm. C) Scanning electron microscopy images of HEK spheroid cultured over 2% agarose gel on rotatory shaker at 240 rpm. D) Illustration of spheroid imaging using two-photon microscope. E) Cartoon showing the configuration of particle incubation with spheroids under rotatory conditions. F–H) Two-photon microscopy images of spheroids at 200 μm deep from the top edge of the spheroids incubated with F) 100 nm polystyrene beads, G) 200 nm polystyrene beads, and H) 500 nm polystyrene beads.
Figure 2.
Figure 2.
Uptake and penetration of spherical polystyrene particles in untreated spheroid. A) Graph showing comparison of normalized pixel intensity from 2P microscopy associated with spheroid per slice with different diameter polystyrene beads. B) Graph showing comparison of particle association with spheroid after 48 h of incubation with different size polystyrene beads analyzed using flow cytometry. C) Normalized radial intensity distribution of polystyrene nanoparticles as a function of distance from the center of the spheroid. Only positive error bars are shown to allow proper visualization of data. Graphs showing growth of spheroids over time under D) untreated conditions and E) Mitomycin C-treated spheroids. Two-photon microscopy of Mitomycin C-treated spheroids. * denotes p-value <0.05. One-way Anova followed by Tukey’s multiple comparisons test was used to determine statistical significance.
Figure 3.
Figure 3.
Uptake and penetration of spherical polystyrene particles in Mitomycin C-treated spheroids. A) Graph showing comparison of normalized pixel intensity associated with spheroid per slice with different diameter PS beads. B) Normalized radial intensity distribution of PS beads as a function of distance from the center of the spheroid. Only positive error bars are shown to allow proper visualization of data. Graphs showing total PS beads pixel intensity associated with different zones of mitomycin-treated spheroid corresponding to C) inner 25% radius, D) 25%–50% radius, E) 50%–75% radius, and F) 75%–100% radius. * denotes p-value <0.05. One-way Anova followed by Tukey’s multiple comparisons test was used to determine statistical significance.
Figure 4.
Figure 4.
Uptake and penetration of shape specific particles in untreated spheroid. Scanning Electron Microscope (SEM) images of A) 220 nm × 100 nm disks, B) 325 nm × 100 nm disks, C) 400 nm × 100 nm × 100 nm rods, and D) 800 nm × 100 nm × 100 nm rods. Two-photon pictures of spheroids at a depth of 200 μm from the surface incubated with E) 220 nm × 100 nm disks, F) 325 nm × 100 nm disks, G) 400 nm × 100 nm × 100 nm rods, and H) 800 nm × 100 nm × 100 nm rods. I) Normalized radial intensity distribution of shape-specific nanoparticles as a function of distance from the center of the spheroid. Only positive error bars are shown to allow proper visualization of data.
Figure 5.
Figure 5.
Uptake and penetration of shape specific particles in mitomycin-treated spheroid. A) Graph showing comparison of normalized pixel intensity from 2P microscopy associated with mitomycin-treated spheroid per slice with different shape-specific particles. Two-photon pictures of spheroids at a depth of 200 μm from the surface incubated with B) 220 nm × 100 nm disks (n = 3), C) 325 nm × 100 nm disks (n = 4), D) 400 nm × 100 nm × 100 nm rods (n = 3), and E) 800 nm × 100 nm × 100 nm rods (n = 4). F) Normalized radial intensity distribution of shape-specific nanoparticles as a function of distance from the center of the mitomycin-treated spheroid. Only positive error bars are shown to allow proper visualization of data. Graphs showing total PS beads pixel intensity associated with different zones of mitomycin treated spheroid corresponding to G) inner 25% radius, H) 25%–50% radius, I) 50%–75% radius, and J) 75%–100% radius. * denotes p-value <0.05. One-way Anova followed by Tukey’s multiple comparisons test was used to determine statistical significance.
Figure 6.
Figure 6.
Theoretical analysis of hydrodynamic properties of the four nanoparticle shapes used in uptake and penetration studies.

References

    1. Petros RA, DeSimone JM, Nat. Rev. Drug Discovery 2010, 9, 615. - PubMed
    1. Baish JW, Stylianopoulos T, Lanning RM, Kamoun WS, Fukumura D, Munn LL, Jain RK, Proc. Natl. Acad. Sci. USA 2011, 108, 1799. - PMC - PubMed
    1. Jain RK, Stylianopoulos T, Nat. Rev. Clin. Oncol 2010, 7, 653. - PMC - PubMed
    1. Carmeliet P, Jain RK, Nature 2000, 407, 249. - PubMed
    1. Weis SM, Cheresh DA, Nature 2005, 437, 497. - PubMed

Publication types

Substances

LinkOut - more resources